Informe meteorológico de People's CDC COVID-19

Publicado

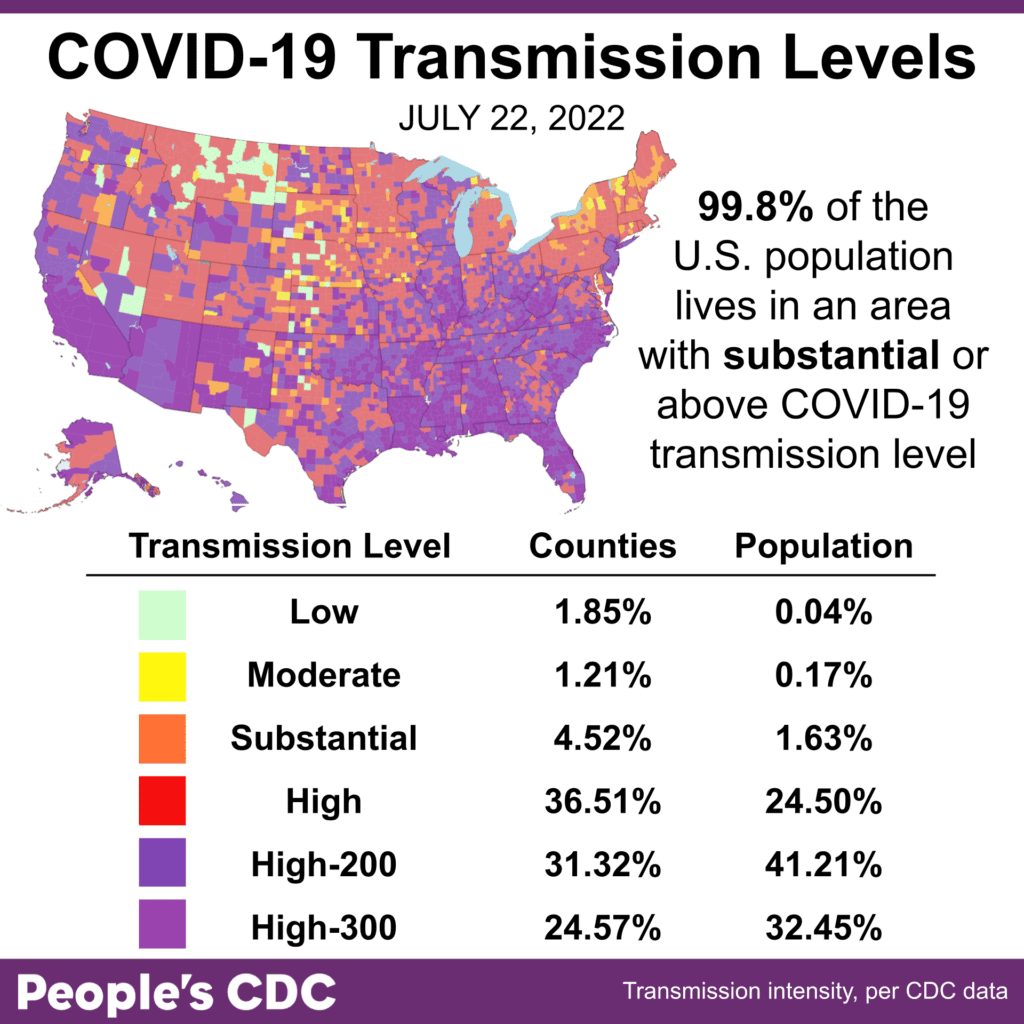
El clima: Seguimos en un aumento sostenido de COVID: cada semana desde principios de junio, 99% de la población de EE. UU. vive en transmisión alta o sustancial.

De hecho, hemos actualizado nuestra mapa de transmisión (h/t @JasonSalemi) para mostrar cuán alta es la transmisión, ¡73% vive en los dos niveles más altos!

This map and corresponding table show COVID community transmission in the US by county, with an updated legend. To show more detail than before, the map breaks out high into 3 categories: High, High-200, & High-300, which are red, purple, & magenta, respectively. High indicates transmission between 100 & 199 cases per 100,000 population, High-200 means transmission between 200 & 299 cases per 100,000, & High-300 means transmission greater than or equal to 300 cases per 100,000.  Most of the US map is orange, red, purple, and magenta, indicating substantial to extremely high levels at 99.8 percent of the population or 96.9 percent of counties. Only part of Montana and Idaho and the middle vertical line of the contiguous US--the Dakotas, Nebraska, Kansas, Oklahoma, and northern Texas--show a higher concentration of moderate and low transmission, in yellow and blue, respectively. The graphic is visualized by the People’s CDC and the data are from the CDC.

Mira la difusión aquí: https://www.youtube.com/watch?v=QGsKEGL0bvg

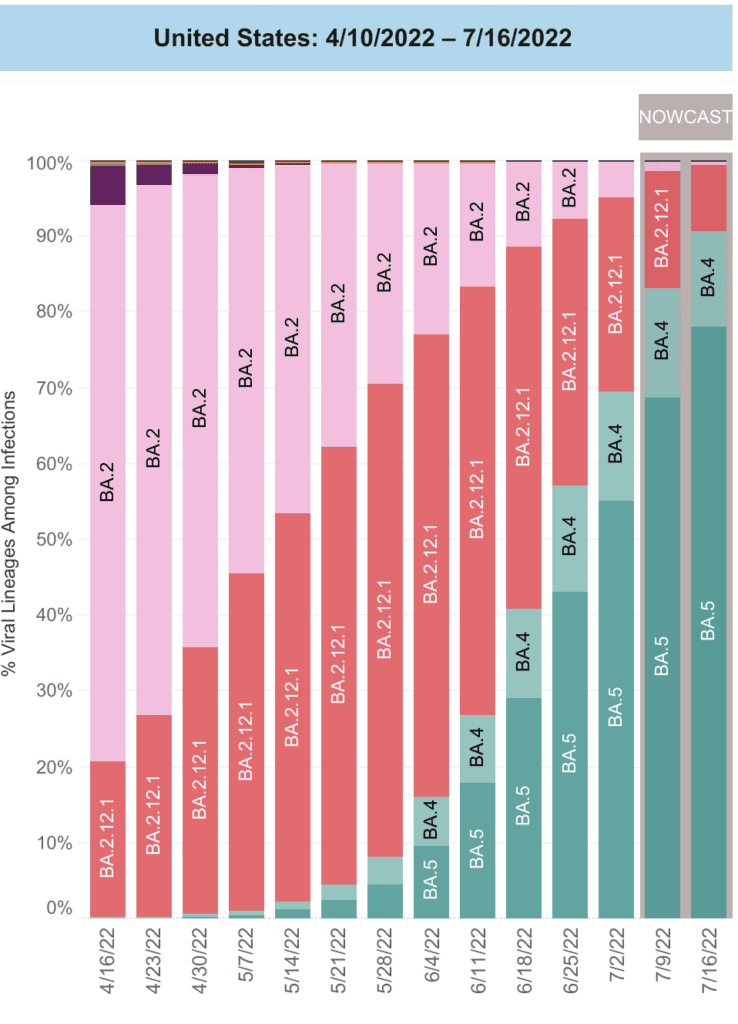
Sobre variantes: Tiempo BA4/5 ahora componen 90% de casos a nivel nacional, aún no están surgiendo nuevas variantes. 

Se ha detectado Centaurus (BA2.75) en algunos estados, pero no está claro si superará a BA5. ¡Seguiremos actualizando esto!

A bar chart shows data for the weeks of 4/16/2022 through 7/16/2022 with levels for each viral lineage shown vertically. In mid-April, BA.2 was the dominant lineage, with a small level of BA1 and moderate level, 20 percent of BA2.12.1. As time went on, BA.2.12.1 continued to grow, and the aforementioned variants shrunk. In mid-May, BA.2.12.1 and BA.2 were equally found. By 5/21/2022, BA.2.12.1 overtook BA.2 as the dominant variant.As of 07/16/2022, BA4/5 had long overtaken others, now representing more than 90 percent of cases, with the predominant strain being BA.5. The pattern of growth of BA.5 over the aforementioned time period appears to be exponential.

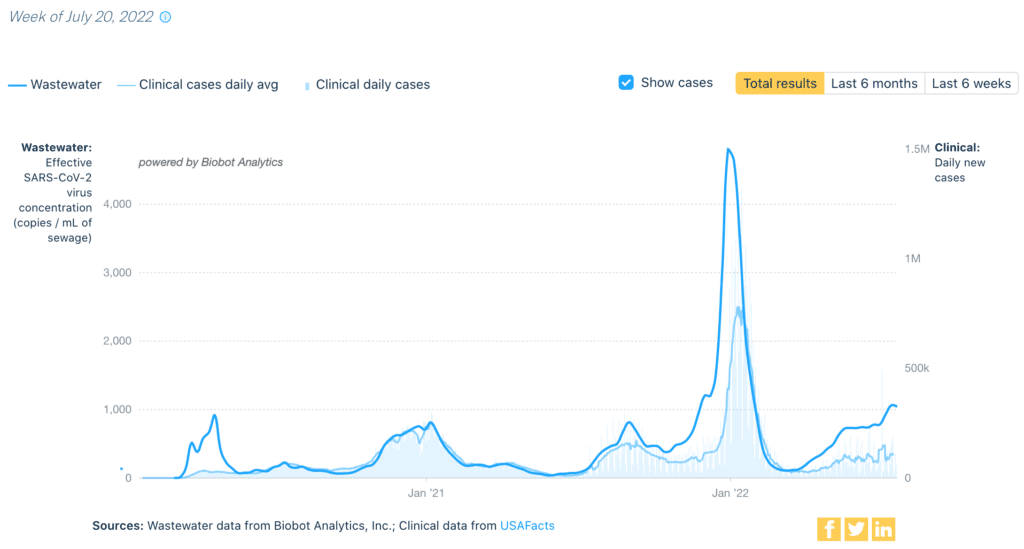
Monitoreo de aguas residuales: aguas residuales nacionales datos de @BiobotAnalytics muestra una pequeña caída por primera vez en meses.

Y, sin embargo, todavía estamos en niveles más altos que cualquier aumento antes de Omicron. Los niveles fluctúan, pero siguen siendo altos en todas las regiones.

 A graph with overlapping lines indicating wastewater viral concentration in dark blue & daily clinical cases in light blue from January 2020 to July 2022. The x-axis is the date & the y-axis on the left states “Wastewater: Effective SARS-CoV-2 virus concentration, copies per mL, or milliliter, of sewage” and the y-axis on the right states “Clinical: daily new cases.” The clinical cases & daily average have fairly consistent peaks & valleys, though the lines are discrepant, with the wastewater levels consistently higher than the daily clinical cases, especially during surges. In this year to date, the wastewater line was at its lowest point in mid-March, at 107 copies per mL. From March onwards, it steadily climbed up. In June, it appeared fairly steady, starting at 732 and ending at 780 copies per mL. In July 2022, the viral concentrations spiked; the latest number from July 20 is 1063 copies per mL. Source: “Wastewater data from Biobot Analytics, Inc.; Clinical data from USAFacts.”

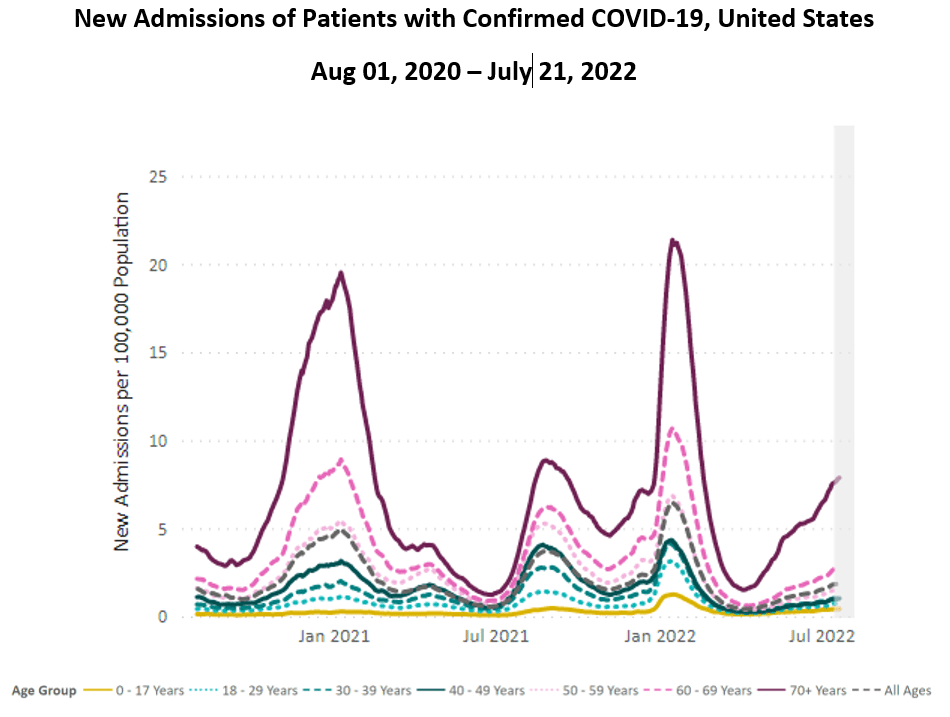
Hospitalizaciones: Durante 13 semanas seguidas, hospitalizaciones siguen aumentando a nivel nacional, con los aumentos más dramáticos entre los mayores de 70 años.

Este aumento sostenido está teniendo un impacto significativo en la salud de muchas personas que viven en los EE. UU., y es insostenible para nuestros trabajadores de la salud.

A line chart with “New Admissions of Patients with Confirmed COVID-19, United States,” as its title, “New Admissions per 100,000 Population” on its y-axis, and dates from January 2021 to July 2022 on its x-axis. The graph contains 8 lines, which include 7 age groups and an all-ages line. The lines indicate peaks in admissions around January 2021, August 2021, and January 2022, with hospitalizations rising from spring 2022 to July 2022. The 70+ age group consistently has much higher hospitalizations than other ages, especially during peaks. Since April 2022, the 70+ disparity has been greatly increasing, and July continues this exponential trend.

Fallecidos: Del 14 de julio al 20 de julio de 2.468 personas han fallecido por COVID a nivel nacional. Incluso el New York Times comentó cómo esta versión de "normal" es brutal, y la estimación de 100,000 muertos por año casi seguramente se superará este año.
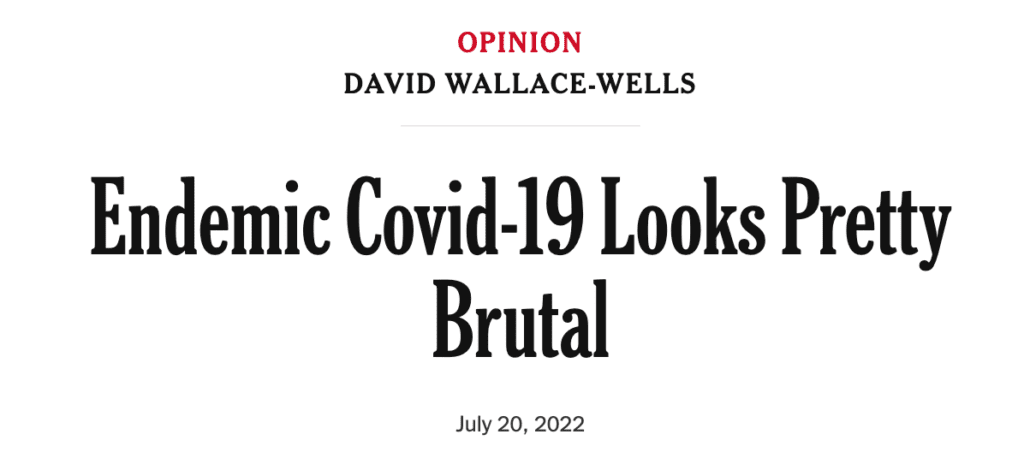
This is a headline dated July 20, 2022 from the New York Times, “Endemic COVID-19 Looks Pretty Brutal,” authored by David Wallace-Wells.
This is a paragraph of text from the editorial, with a highlighted sentence: “As a ballpark estimate, [Dr Trevor Bedford, an evolutionary virologist] says, going forward we can expect that every year, around 50 percent of Americans will be infected and more than 100,000 will die.”

Por supuesto, los altos niveles sostenidos de casos, hospitalizaciones y muertes no son inevitables. El gobierno podría elegir una mejor respuesta (vacunas actualizadas, máscaras y pruebas gratuitas de alta calidad, ventilación mejorada y licencia por enfermedad pagada) y crear una "normalidad" mejor y más saludable.

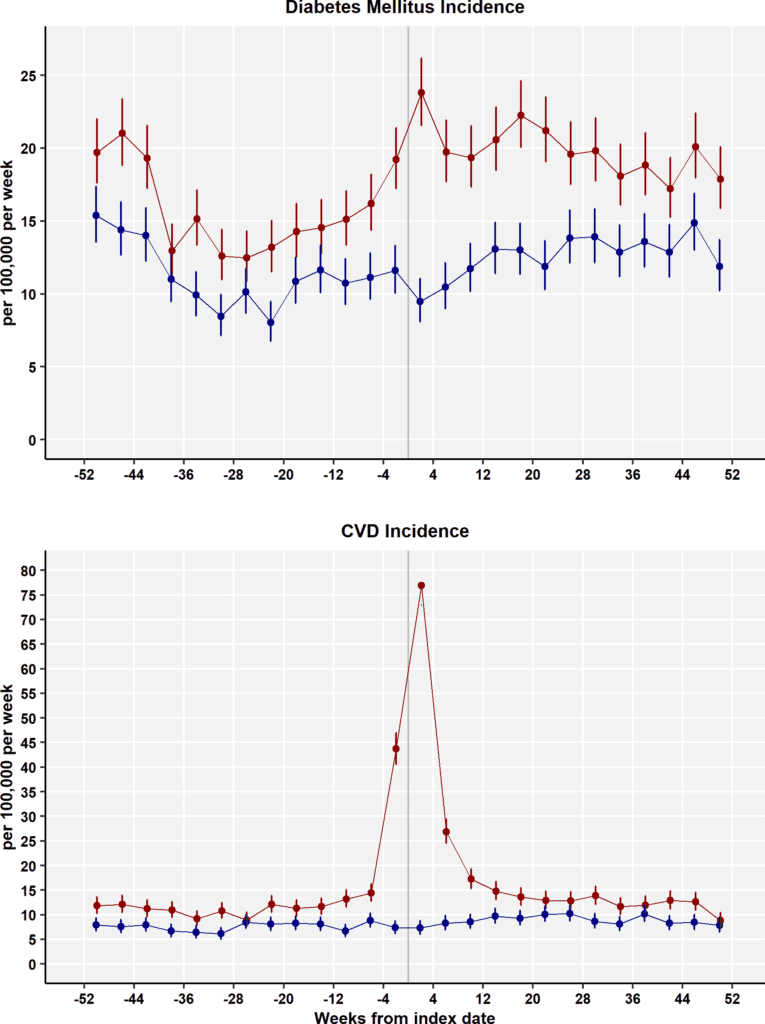
Sobre COVID largo: Otro estudio ha diagnósticos más altos confirmados de diabetes y enfermedades cardiovasculares en las 4-12 semanas posteriores a una infección por COVID. Esto sugiere la necesidad de un mayor control durante la recuperación temprana.

This is a panel of two line graphs, top and bottom. The top graph shows diabetes mellitus incidence up to 12 months after COVID infection and the bottom CVD or cardiovascular disease incidence with the same time period. The y-axes both show the number of people with such incidence per 100,000 per week. The graphs compare COVID patients in red lines compared to controls in blue lines. The red lines are the only ones with increased diabetes or CVD incidence within 4 weeks of COVID infection.

en uno de los primeros estudios de cohorte para examinar a los niños a los que se les hizo la prueba de COVID en las salas de emergencias, y nuevamente a los 90 días, 4,61 TP3T de los niños positivos para COVID tenían síntomas nuevos o persistentes en el seguimiento, en comparación con solo 2,71 TP3T en los niños negativos para COVID.

Estas proporciones casi se duplicaron en los niños hospitalizados. 

Además, el estudio identificó síntomas que fueron más comunes en los niños positivos para COVID en el seguimiento, que incluyen: fatiga o debilidad, pérdida de apetito, preocupaciones psicológicas generales y pérdida continua del olfato o el gusto.

This is a bar chart with error bars, titled “Matched nonhospitalized SARS-CoV-2-positive and SARS-CoV-2-negative children reporting persistent, new, or returning health problems.” The x-axis lists Type of PCC, or Post-COVID Condition. 25 conditions are listed, which are Fatigue or weakness; cough; difficulty breathing; appetite loss; fever; loss of smell or taste; skin condition; other miscellaneous; asthma or wheeze; other respiratory; gastrointestinal; pain; mental fuzziness; chest pain; rhinorrhea; anxiety; depression; headache; cardiovascular; dizzy or lightheaded; other mental health; eye or ear; sneezing; sore throat; and epilepsy. The y-axis indicates the percentage of children experiencing these conditions. For the most part, those who were positive have a higher prevalence of these conditions, except for cough, asthma or wheeze, rhinorrhea, sneezing, sore throat, and epilepsy, where more of the negative group experienced these conditions than the positive group.

Pronóstico: Existente refuerzos basado en la cepa original de COVID (ancestral) puede proporcionar suficiente protección contra los resultados graves de BA.5.

Todos los mayores de 5 años son elegibles para un refuerzo; ¡los mayores de 50 años o inmunocomprometidos son elegibles para un segundo refuerzo!

La directora de salud pública del condado de Los Ángeles, Barbara Ferrer, declaró sobre: mandatos de máscara:: “No creo que debamos conformarnos con una alta mortalidad que afecta desproporcionadamente a las personas de menos recursos económicos y a las personas de color”.

Continuó afirmando que “el enmascaramiento sigue siendo una estrategia que agrega protecciones cuando la transmisión es alta”. 

Estar preparado: BA5 ha superado rápidamente a todas las demás variantes en los EE. UU. Todavía no hemos visto evidencia de una nueva variante que pueda superarlo.

Aunque esto puede darnos un breve descanso antes de que surja la siguiente variante, las infecciones repetidas de BA5 también podrían mantener los casos altos en el futuro previsible.

Al reducir la transmisión, le damos al virus menos oportunidades de adaptarse y mantenernos más saludables.

Las capas de protección (máscaras, ventilación, vacunas y pruebas de alta calidad) siguen siendo nuestra mejor defensa.

Fuentes: consulte los enlaces a lo largo y visite nuestro sitio web para obtener más información. https://peoplescdc.org

Disculpa

PCDC se disculpa por nuestra cobertura de la viruela del simio (MPV) la semana pasada. Tanto los voluntarios del PCDC como Los lectores externos notaron que nuestro encuadre perpetuó algunos de los mismos errores de exclusión e intolerancia a los que buscamos oponernos. Incluimos el idioma original aquí para referencia y responsabilidad.* Estamos reflexionando actualmente sobre cómo nos relacionamos con el tema en el futuro. Nosotros tienen como objetivo compartir información que no sea estigmatizante, precisa y prioriza a los más afectados. Si tiene recursos MPV que ha encontrado útil, o ideas sobre cómo PCDC puede contribuir mejor, por favor permítanos saber a través de el formulario vinculado aquí.       

*Removed from original Weather Report 7/25/22: “On Monkeypox: As of July 21, the US has 2,593 cases of monkeypox, an 85% increase from last week. The WHO finally declared monkeypox a public health emergency. We need to act - not panic or stigmatize. While CDC has not reported demographics or transmission, data from Europe & NYC show most cases are among men who have sex with men, with no deaths reported.There have also been reports among children - monkeypox can be transmitted from mother to child and through household contacts.Providing education & vaccines to men who have sex with men and their close contacts is an important strategy to limit further spread, especially as cases may be linked to large superspreader events. Healthcare workers need education and adequate resources to identify and treat potential monkeypox cases.With more testing available, we need freely accessible testing of anyone with symptoms to learn how this disease is spreading. We should also learn from experts from African countries, who were long ignored when monkeypox was only a “foreign” problem.”
Compartir esto:
Traducir
Cerrar