Informe meteorológico de los CDC de People

Publicado

El clima: A pesar de la negación de la realidad de Biden que prioriza las ganancias sobre la vida de las personas, la pandemia de COVID está lejos de terminar.

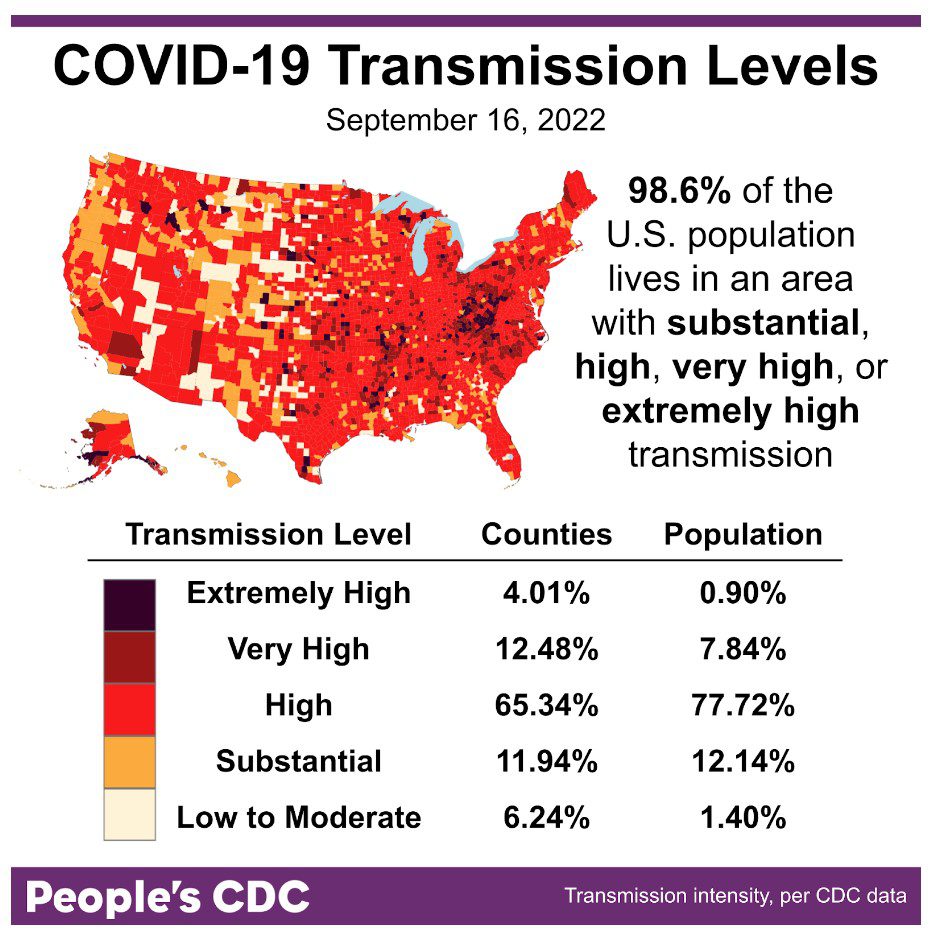
Como hemos visto durante todo el verano, más del 99 por ciento de la población vive en áreas con una transmisión de COVID sustancial o más alta. Los dos niveles de mapa más altos aquí muestran cuán altos son los niveles de casos, en 100-199 y 200-299 casos por 100,000 respectivamente.

This map and table show COVID community transmission in the US by county, with High broken into 3 subcategories: High, Very High, and Extremely High. Transmission is indicated via shades of red, with the darkest shade indicating areas of Extremely High transmission, and the palest shade representing Low to Moderate transmission. Text indicates that 98.6 percent of the US population lives in an area with substantial or higher COVID transmission level, which is also represented via the three darkest shades of red covering most of the map itself. Most of the country is experiencing High transmission, at 65.34 percent of counties representing 77.72 percent of the population; 11.94 of counties representing 12.14 percent of the population are experiencing substantial transmission. Only 6.24 percent of counties, representing 1.40 percent of the population, are experiencing Low to Moderate transmission. The graphic is visualized by the People’s CDC and the data are from the CDC.

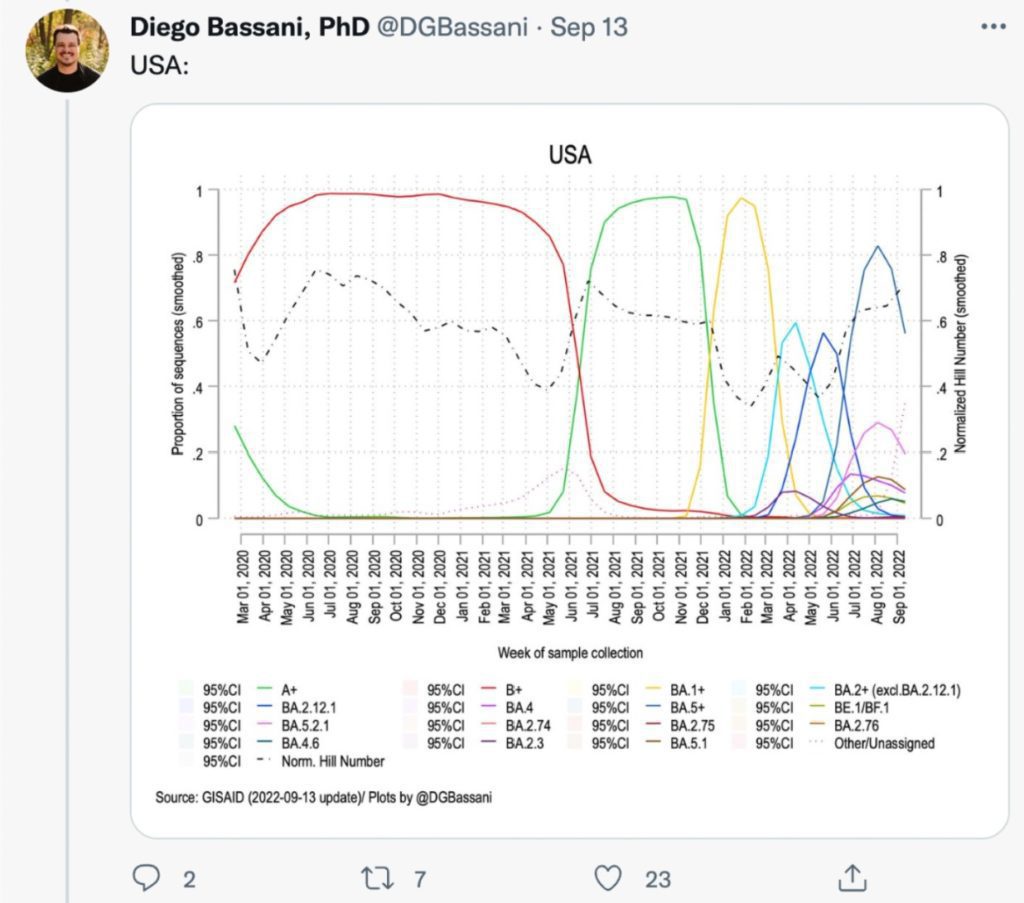
Sobre variantes: La diversidad de variantes es cada vez más alta en los EE. UU. (y en muchos otros países), como Profesor Bassani dice..

A line chart shows USA data for the weeks of 3/1/2020 through 9/1/2022 with the proportion of each viral lineage shown in a different color line and the Normalized Hill Number showing variant diversity shown in a dotted line. Variant diversity is increasing as of May 2022 and BA.5 has the highest proportion as of July 2022, with many other variants with proportions between 0.0 and 0.2. The graphic is visualized by Diego Bassani with data from GISAID.

Nosotros continuamos a ver disminuciones en la proporción de casos debido a BA.5, aunque sigue siendo la mayoría (85%). Otras 3 variantes están ganando terreno: BA.4.6 ahora representa el 10 % de los casos, particularmente en las regiones de Central Plains, sureste y noreste...

A bar chart shows data for the weeks of 6/18/2022 through 9/17/2022 with levels for each viral lineage shown vertically. In mid-June, BA.2.12.1 was the dominant lineage, with smaller amounts of BA.5, BA.4, and BA.2 circulating. As time went on, BA.5 quickly grew and BA.2.12.1 and BA.2 began to shrink, with BA.4 remaining stable at around 10 percent of viral lineages. By early July, BA.5 had become the dominant variant. As of 9/17/2022, BA.5 makes up the vast majority of cases at 84.8 percent, followed by BA.4.6 at 10.3 percent. In the past two weeks, it appears BA.5 is slowly declining while BA.4.6 slightly increases.

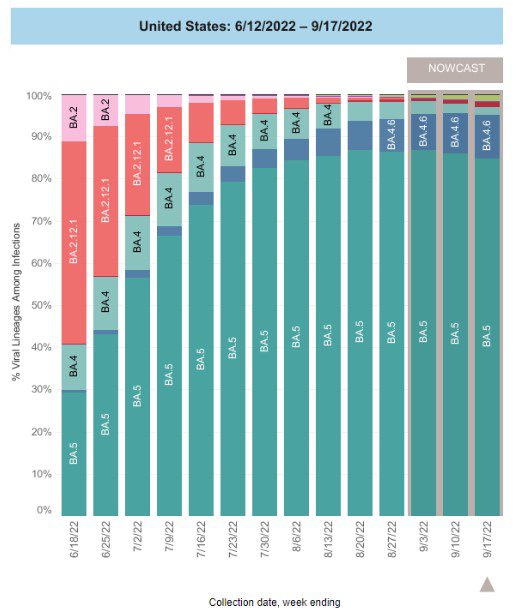
BF.7 (verde lima) está en 1.7% y es el más alto en el noreste; y BA.2.75/BA.2.75.2 (rojo oscuro) es del 1,3 %, con porcentajes ligeramente más altos en la costa oeste y los Grandes Lagos.

Cada vez es más difícil hacer un seguimiento de estas variantes y sus subvariantes. Dr Topol provides a nice summary. BA2.75 (Centauro) había causado un aumento en la India, pero no ha sido predominante en áreas que primero tenían BA4/5. No está claro qué hará el nuevo BA2.75.2.

Screenshot of a Twitter post from Eric Topol reading, “BF.7 is BA.5.2.1X. BA.27 isn’t as concerning as further BA.2 derivatives. BA.2.75.2 acquired 3 more key spike mutations, more immune evasion potential. NB: The virus is still showing substantial signs of evolution; this is just the spike.” There’s a graph attached to the bottom of the tweet in which the genetic mutations of BA.4/BA.5, BA.2.75, BA.2.75.2, BJ.1, BA.2.10.4, and BA.2.3.20 are illustrated. BA.2.75.2 acquired 3 more key spike mutations with more immune evasion potential. BA.2.10.4 and BA.2.3.20 show 8 and 9 mutations respectively. Text and illustrations by Eric Topol with original data from Tom Peacock.

La existencia de tantos variantes es preocupante por muchas razones. Significa que el virus tiene muchas posibilidades de evolucionar. Es más difícil estudiar la gravedad relativa, la inmunidad y la transmisibilidad de tantas variantes. Y aumenta las posibilidades de otra oleada.

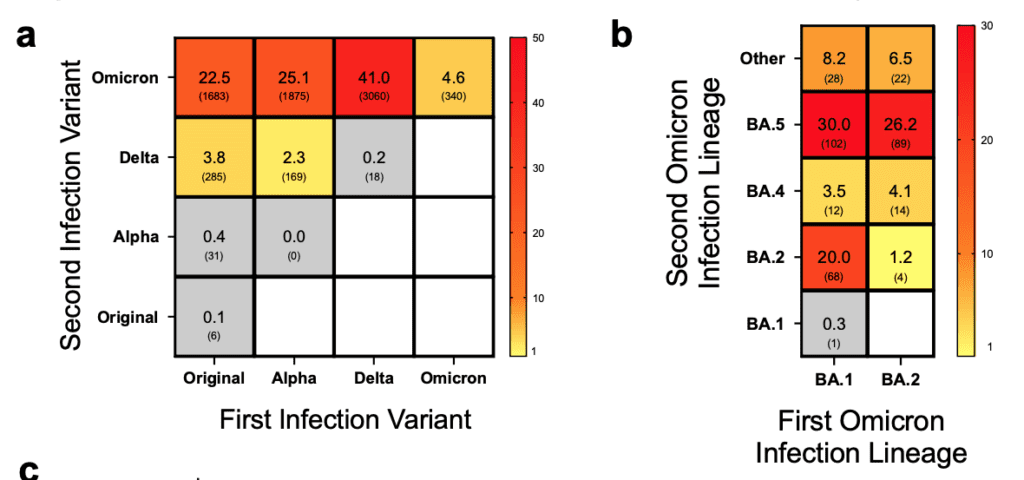
Una preimpresión de Dinamarca muestra que las reinfecciones se han vuelto más comunes con las variantes más nuevas. Pocas personas (en cuadrados grises) se volvieron a infectar antes de Omicron. Sin embargo, Omicron pudo volver a infectar fácilmente a las personas. La segunda figura muestra que es posible la reinfección entre las cepas de Omicron.

Two tables show reinfection frequencies across infection variants, with first infection variants in each column and second infection variants in each row. The table on the left shows data across original, alpha, delta, and omicron variants, with greater reinfection frequencies among Omicron variants; 93.2 percent or 6,958 cases of all reinfections were due to Omicron. The table on the right compares Omicron-to-Omicron reinfection cases across major sublineages BA.1, BA.2, BA.4, BA.5, and Other. BA.1 initial infections accounted for 62 percent of second Omicron infections, with the majority of those being infections from BA.5 at 30 percent or 102 cases, or BA.2 at 20 percent or 68 cases.

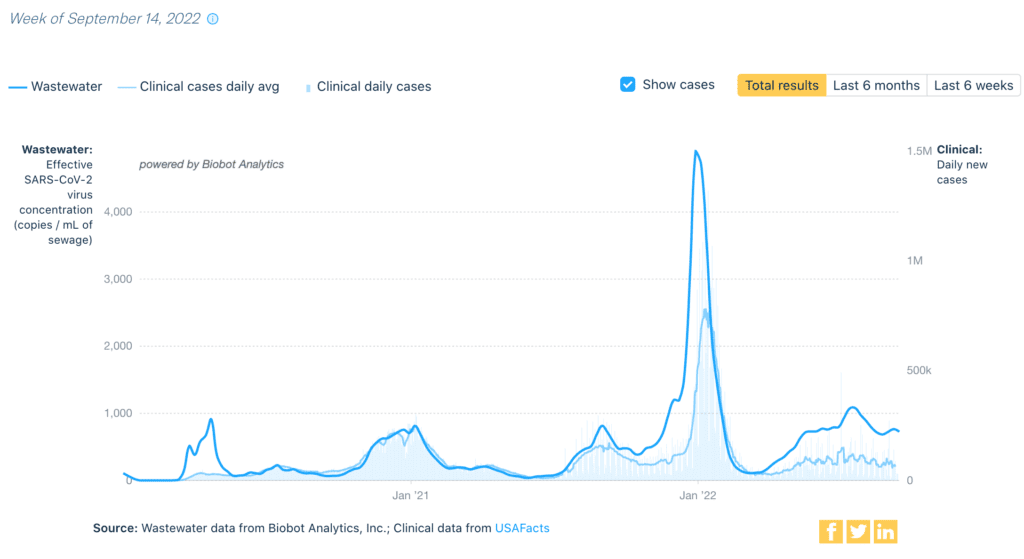
Monitoreo de aguas residuales: Datos nacionales de aguas residuales ha estado fluctuando después de un breve descenso. Todavía está en niveles relativamente altos. A nivel regional, el aumento proviene principalmente del noreste.

A line graph with overlapping lines indicates wastewater viral concentration in dark blue & daily clinical cases in light blue from January 2020 to September 2022. The x-axis is the date & the y-axis on the left states “Wastewater: Effective SARS-CoV-2 virus concentration, copies per mL, or milliliter, of sewage” and the y-axis on the right states “Clinical: daily new cases.” The clinical cases & daily average wastewaters have corresponding peaks & valleys, though the wastewater levels are consistently higher than the daily clinical cases, especially during surges, and the discrepancy has persisted since May 2022, confirming an ongoing summer surge. Wastwater and clinical daily cases have been relatively stable in recent weeks. On 9/14, wastewater showed 725 copies/mL of sewage. An average of 62,169 daily clinical cases was reported on 9/9. Source: “Wastewater data from Biobot Analytics, Inc.; Clinical data from USAFacts.”

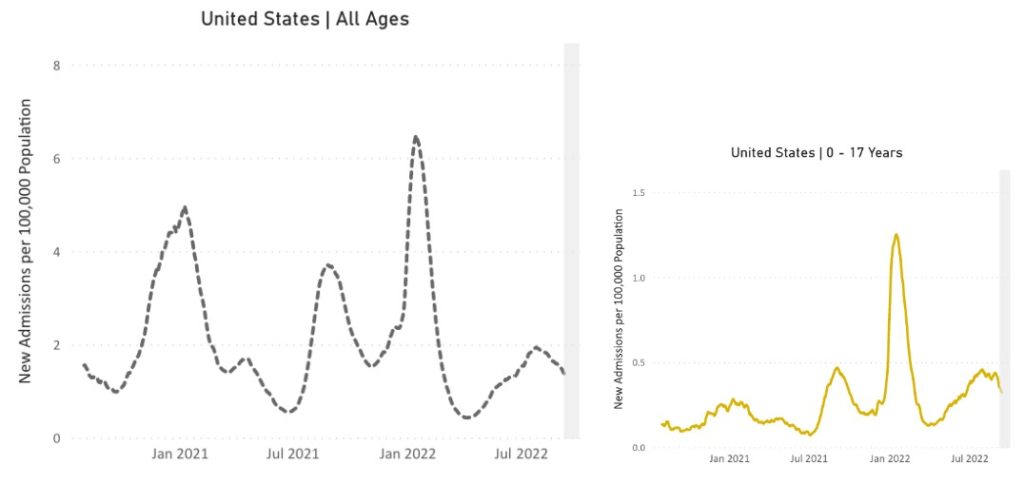
Hospitalizaciones: En general hospitalizaciones siguen bajando, lo cual es una excelente noticia. Entre los niños, las hospitalizaciones están comenzando a disminuir, pero siguen siendo bastante altas en comparación con la mayor parte de la pandemia. Nuestros niños merecen mejores protecciones.

Two line charts representing new admissions of patients with confirmed COVID in the United States over time. The chart has “United States, All Ages,” as its title, “New Admissions per 100,000 Population” on its y-axis, and dates from January 2021 to July 2022 on its x-axis, though actual dates range from August 2020 to August 2022. The dotted line represents new admissions of patients with confirmed COVID in the US over time across all age ranges. The line indicates peak hospitalizations occurred in January 2021, August 2021, and January 2022, with smaller peaks happening in April 2021 and July 2022. At its latest data point, the line indicates that hospitalizations are currently moving in a downward trend. The solid yellow line shows new hospitalizations for children ages 0 to 17 years. Their hospitalizations have remained stable in recent months and are starting to decrease.

Fallecidos: De Septiembre 1 hasta el 7, 2,503 personas han fallecido por COVID a nivel nacional

Sobre COVID largo: A Encuesta de población de 3000 adultos de EE. UU. encontró que el 7% de todos los encuestados informaron Long COVID (usando la definición del Reino Unido). El COVID prolongada fue menos común, pero no eliminada, entre los que recibieron el impulso.

“El COVID prolongada es ahora el tercer trastorno neurológico más importante del país” la Academia Americana de Neurología declaró en julio. La gravedad y el efecto duradero en el cerebro pueden no estar relacionados: las personas con síntomas similares a los del resfriado están desarrollando problemas cognitivos, ansiedad, depresión y sueño.

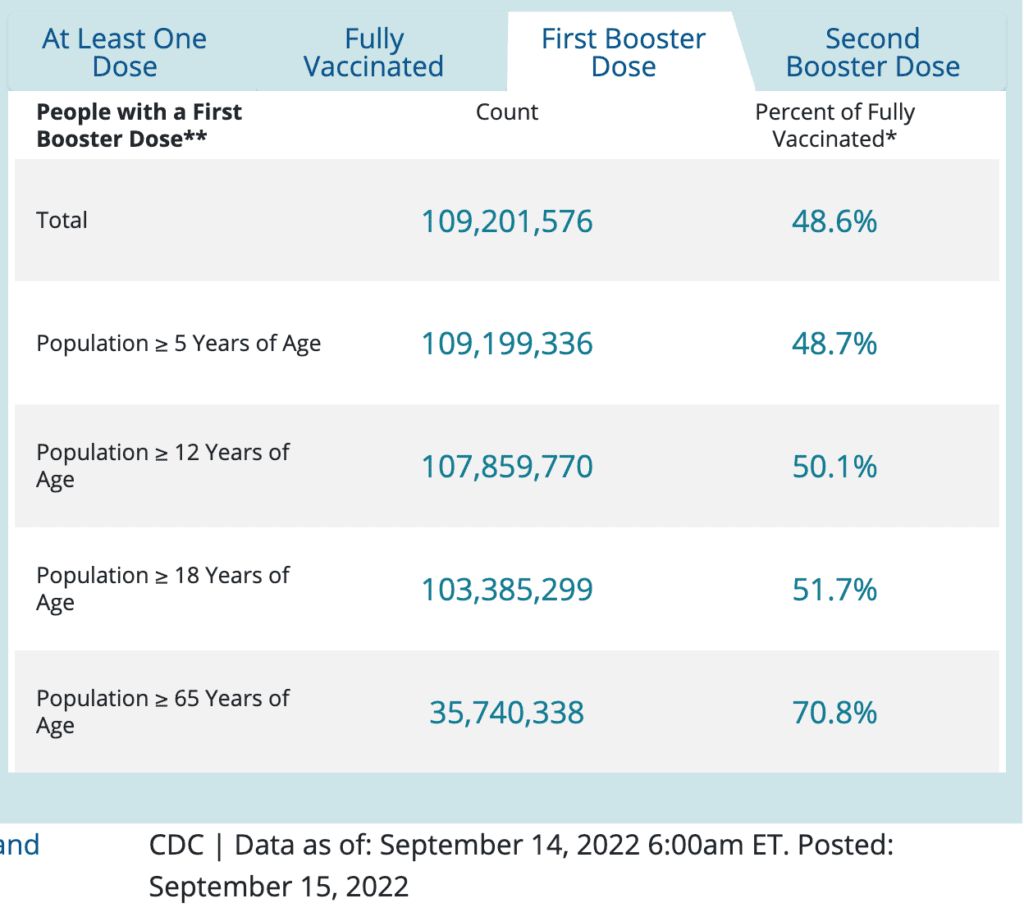
Pronóstico: Los nuevos refuerzos actualizados finalmente coinciden con la variedad actual. Sin embargo, la aceptación del refuerzo ha sido baja en los EE. UU.: menos de la mitad de la población tiene siquiera un refuerzo. ¡El enmascaramiento de alta calidad, la buena ventilación, el acceso a las pruebas y la licencia por enfermedad pagada son importantes para mantenerse saludables!

A table highlights people with a first booster dose, with “Count” of those vaccinated in the center column and “Percent of Fully Vaccinated” in the right-most column. Rows show different populations of people: Total  population has 109, 201, 576 count, at 48.6 percent. Population greater than or equal to 5 years of age has 109,199,336 count, at 48.7 percent. Population greater than or equal to 12 years of age has 107,859,770 count, at 50.1 percent. Population greater than or equal to 18 years of age has 103,385,299 count, at 51.7 percent. Population greater than or equal to 65 years of age has 35,740,338 count, at 70.8 percent. Source: “CDC Data as of: September 14, 2022 6:00am ET. Posted: September 15, 2022”

¿Está buscando una manera fácil y efectiva de limpiar su aire? Las cajas de Corsi-Rosenthal superan a muchos filtros de aire disponibles y trabajan en hogares, escuelas y oficinas. ¡Aprenda más sobre cómo construir uno en cleanaircrew.org!

¡Acciones a tomar! Los activistas de Long COVID exigen una mejor investigación hoy, 19 de septiembre. Obtenga más información y participe en: https://millionsmissing.meaction.net/protest2022/ 

Notes: 1) The numbers in this report were current as of 9/16/22. The CDC updates data frequently as it receives refreshed information. Today’s numbers may be slightly different from the data here. 2) Check out the links throughout & see our website for more! https://peoplescdc.org.

Compartir esto:
Traducir
Cerrar