
El clima: More than half of the counties in the country are still experiencing substantial or high transmission levels.

This week, we want to highlight the CDC’s own Transmission Levels map – the map they make nearly impossible to find on their website despite that their own research shows that people are more likely to mask and take other protective measures when they’re aware that transmission levels are high.
Logros: Last week’s was the #WestCoastWeekOfAction. In Portland, Mask Bloc PDX brought folks together to reject the plan to lift masks in healthcare on April 1. In California, Senior And Disability Action, Disability Rights California, and other groups organized actions in support of mask mandates.
@MaskBlocUCDavis launched a fundraising effort to purchase a pack of 240 N95s to distribute and met their goal this week!
And in Oakland, artists shared the art they’d created since the beginning of the pandemic using Layers of Protection. Everyone wore N95s, and some joined remotely.
Monitoreo de aguas residuales: Wastewater levels show a slight uptick across the country, which is best seen on the national average data from the last 6 months. Levels of COVID in wastewater continue to remain high across all regions–about 10 times higher than summer 2021 levels.
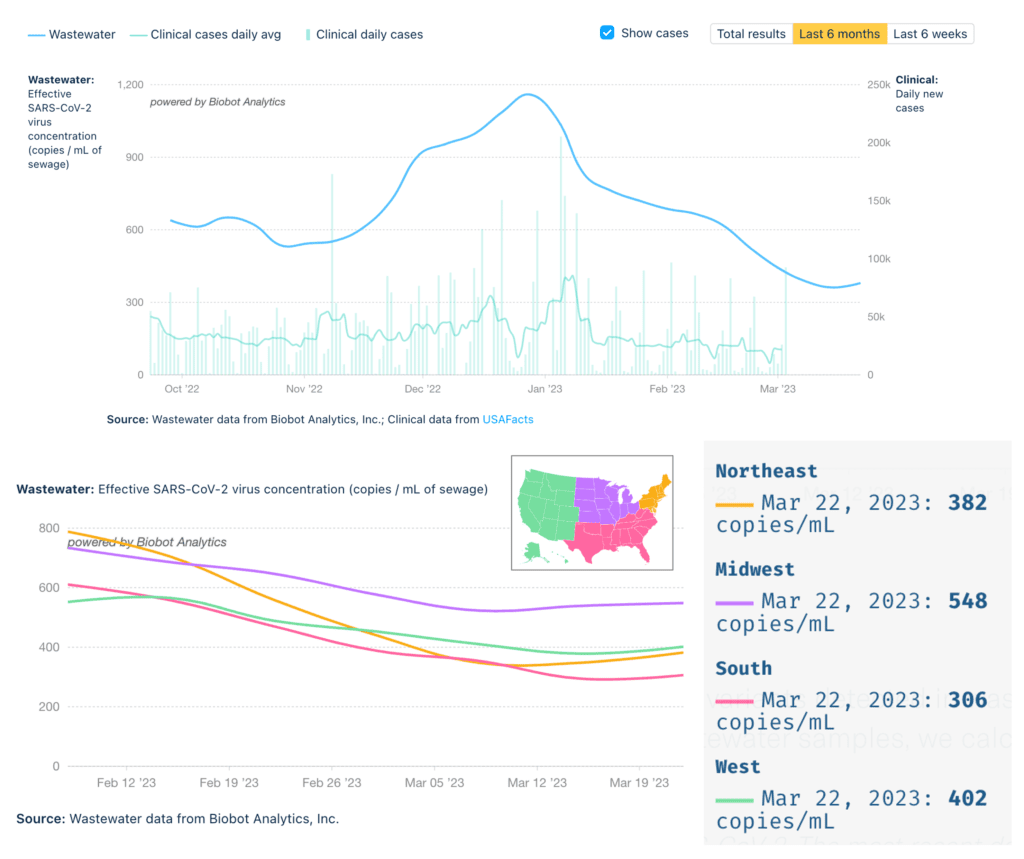
As testing access and data sources diminish, wastewater monitoring is even more important in understanding national and local COVID transmission. Where available, county-level wastewater data (scroll down to “Covid-19 Wastewater Monitoring by County and U.S. Territory”) may give more detailed information about your local COVID situation.
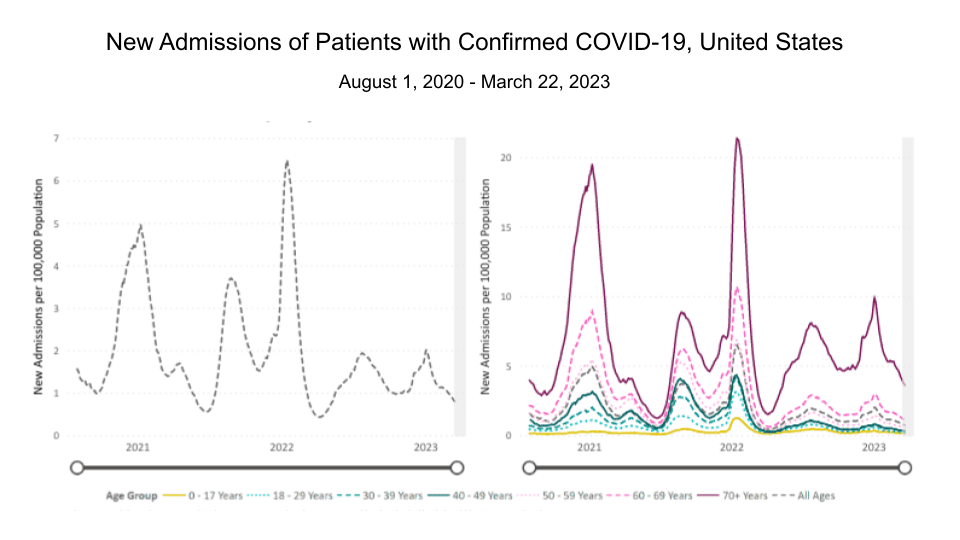
Hospitalizaciones: Hospitalizaciones for confirmed COVID cases continue to decrease since the Winter surge. Still, they are not low; and, as always, these images demonstrate that COVID-19 disproportionately impacts those over 70.
You can read Disability Rights California’s letter in opposition to the California Department of Public Health’s Updated Guidance on Ending Mask Requirements in Health Care Settings March 22, 2023.
Fallecidos: The week of March 22, 2023, 2,060 people died of COVID nationally. At least 1,123,613 people have died from COVID in the US.
And our government’s failure on COVID-19 is not isolated. Read this piece in JAMA about increases in all-cause mortality in kids over the past few years– starting even before the pandemic. While those with power push for a “return to normal,” they miss an opportunity to meaningfully fix problems that predated (and perhaps have been exacerbated by) the pandemic they now try to ignore.
Covid Largo: The Lancet published a 3 year retrospective on Long COVID, ending their article with this reflection: “The acute months of the COVID-19 pandemic motivated an unprecedented response from governments, international organizations, pharmaceutical companies, and civil society. Long COVID has not received anywhere near the same level of attention or resources: the result has been widespread harm to health, societies, and economies. 3 years in, more is needed to recognize, treat, and support patients with long COVID.”
A new cohort estudio reciente among adults in the VA system which was published in JAMA Internal Medicine showed that Paxlovid can reduce the risk of Long COVID.
Pronóstico: One of the most frequently asked questions we get at The People’s CDC is what to do about boosters, particularly for those that received the bivalent booster in early fall. For now, the FDA has failed to provide meaningful guidance. In other countries, a spring booster has been recommended for those at highest risk.
Low wage workers experienced real world wage increases during the pandemic. These are ending. Remember that abandoning working class people is a policy choice, and one we need to reject.
Tome accion: Medicaid Continuous Coverage is set to end at the end of this month. Check out this explainer thread from LongCOVIDJustice Network (@LongCOVIDnetwk) and use esta forma created by folks at the Center for Popular Democracy (@popdemoc) to tell your Governor to #SaveMedicaid.
Join Massachusetts Coalition for Health Equity in resisting their Governor’s plan to roll back free PCR testing for undocumented and uninsured residents by signing this letter.
Tell the Washington Post to stop spreading disinformation about COVID by signing this letter. According to Strategies for High Impact and Long Covid Action Project, “the article created a dangerous misrepresentation of the prevalence and severity of Long COVID, downplaying its existing risk to society – even while including compelling stories of the profound impact it has on individuals.”
Illinois friends! Join ISAQS in supporting Illinois HB3713, the Clean Air for Healthy Equitable Schools bill and encourage Illinois legislators to VOTE YES on this initiative! Our teachers and students deserve to work/learn in schools that meet expert recommendations for clean air!
Patient Led Research Collaboration is asking for support in requesting that “post exertional malaise” be expedited for ICD-10 code status in 2023 rather than 2024. You can read more about what this means here.
Notes: 1) The numbers in this report were current as of 3/24. The CDC updates data frequently as it receives refreshed information. Today’s numbers may be slightly different from the data here. 2) Check out the links throughout & see our website for more! https://peoplescdc.org.