Minnesota ICE OUT! General Strike
Last Friday, January 23rd, tens of thousands of Minnesota residents marched on Minneapolis to participate in a “no work, no school, no shopping” action titled the “Day of Truth & Freedom.” Led by clergy leaders, the AFL-CIO — the state’s federation of 1000+ unions, and dozens of other local labor unions, the people of Minnesota took to the streets to demand that ICE “leave Minnesota, that the ICE officer who killed [Renee Nicole] Good be legally held accountable, [for] an end to additional federal funding for ICE, and for the agency to be investigated for human rights and constitutional violations.”
Even in the course of drafting this weather report, a second legal observer in Minnesota, Alex Jeffrey Pretti, has been killed by ICE. Since this administration took power on January 20, 2025, there have been 27 reported shootings by ICE agents resulting in 8 deaths. Additionally, in 2025, at least 32 people died in ICE custody. We consider all of these deaths to be murder. General Strikes are rare and often pivotal moments in larger labor and social movements. This general strike was the first one in the Minneapolis-St Paul region in almost 100 years. Natasha Lennard writes for The Intercept, “The shooting — the third in Minneapolis by federal immigration agents since Trump’s deportation machine descended on Minnesota with extreme brutality in December — is an unbearable follow-up to the most extraordinary day of mass resistance to Trumpian fascism to date. It is also a searing reminder as to why Friday’s mass strike in Minneapolis must not be swept from our minds.”
By creating fear tactics — such as this terrifying TV and Radio propaganda by Secretary of Homeland Security Kristi Noem that encourages immigrants to register with the government via their new phone app — the current administration is trying to win mass consent for their campaign of maiming, kidnapping, and shooting people in the streets. We commend the people of Minnesota and those nationwide who are coming together on a massive scale to defend their neighborhoods and workplaces from occupation by armed federal police forces.
As a reminder, wearing a mask during protests does not only protect you from future complications from COVID and other illnesses, but it is also a sign of solidarity with immigrant populations who are avoiding vital medical care so as not to risk being kidnapped by ICE.
The Weather
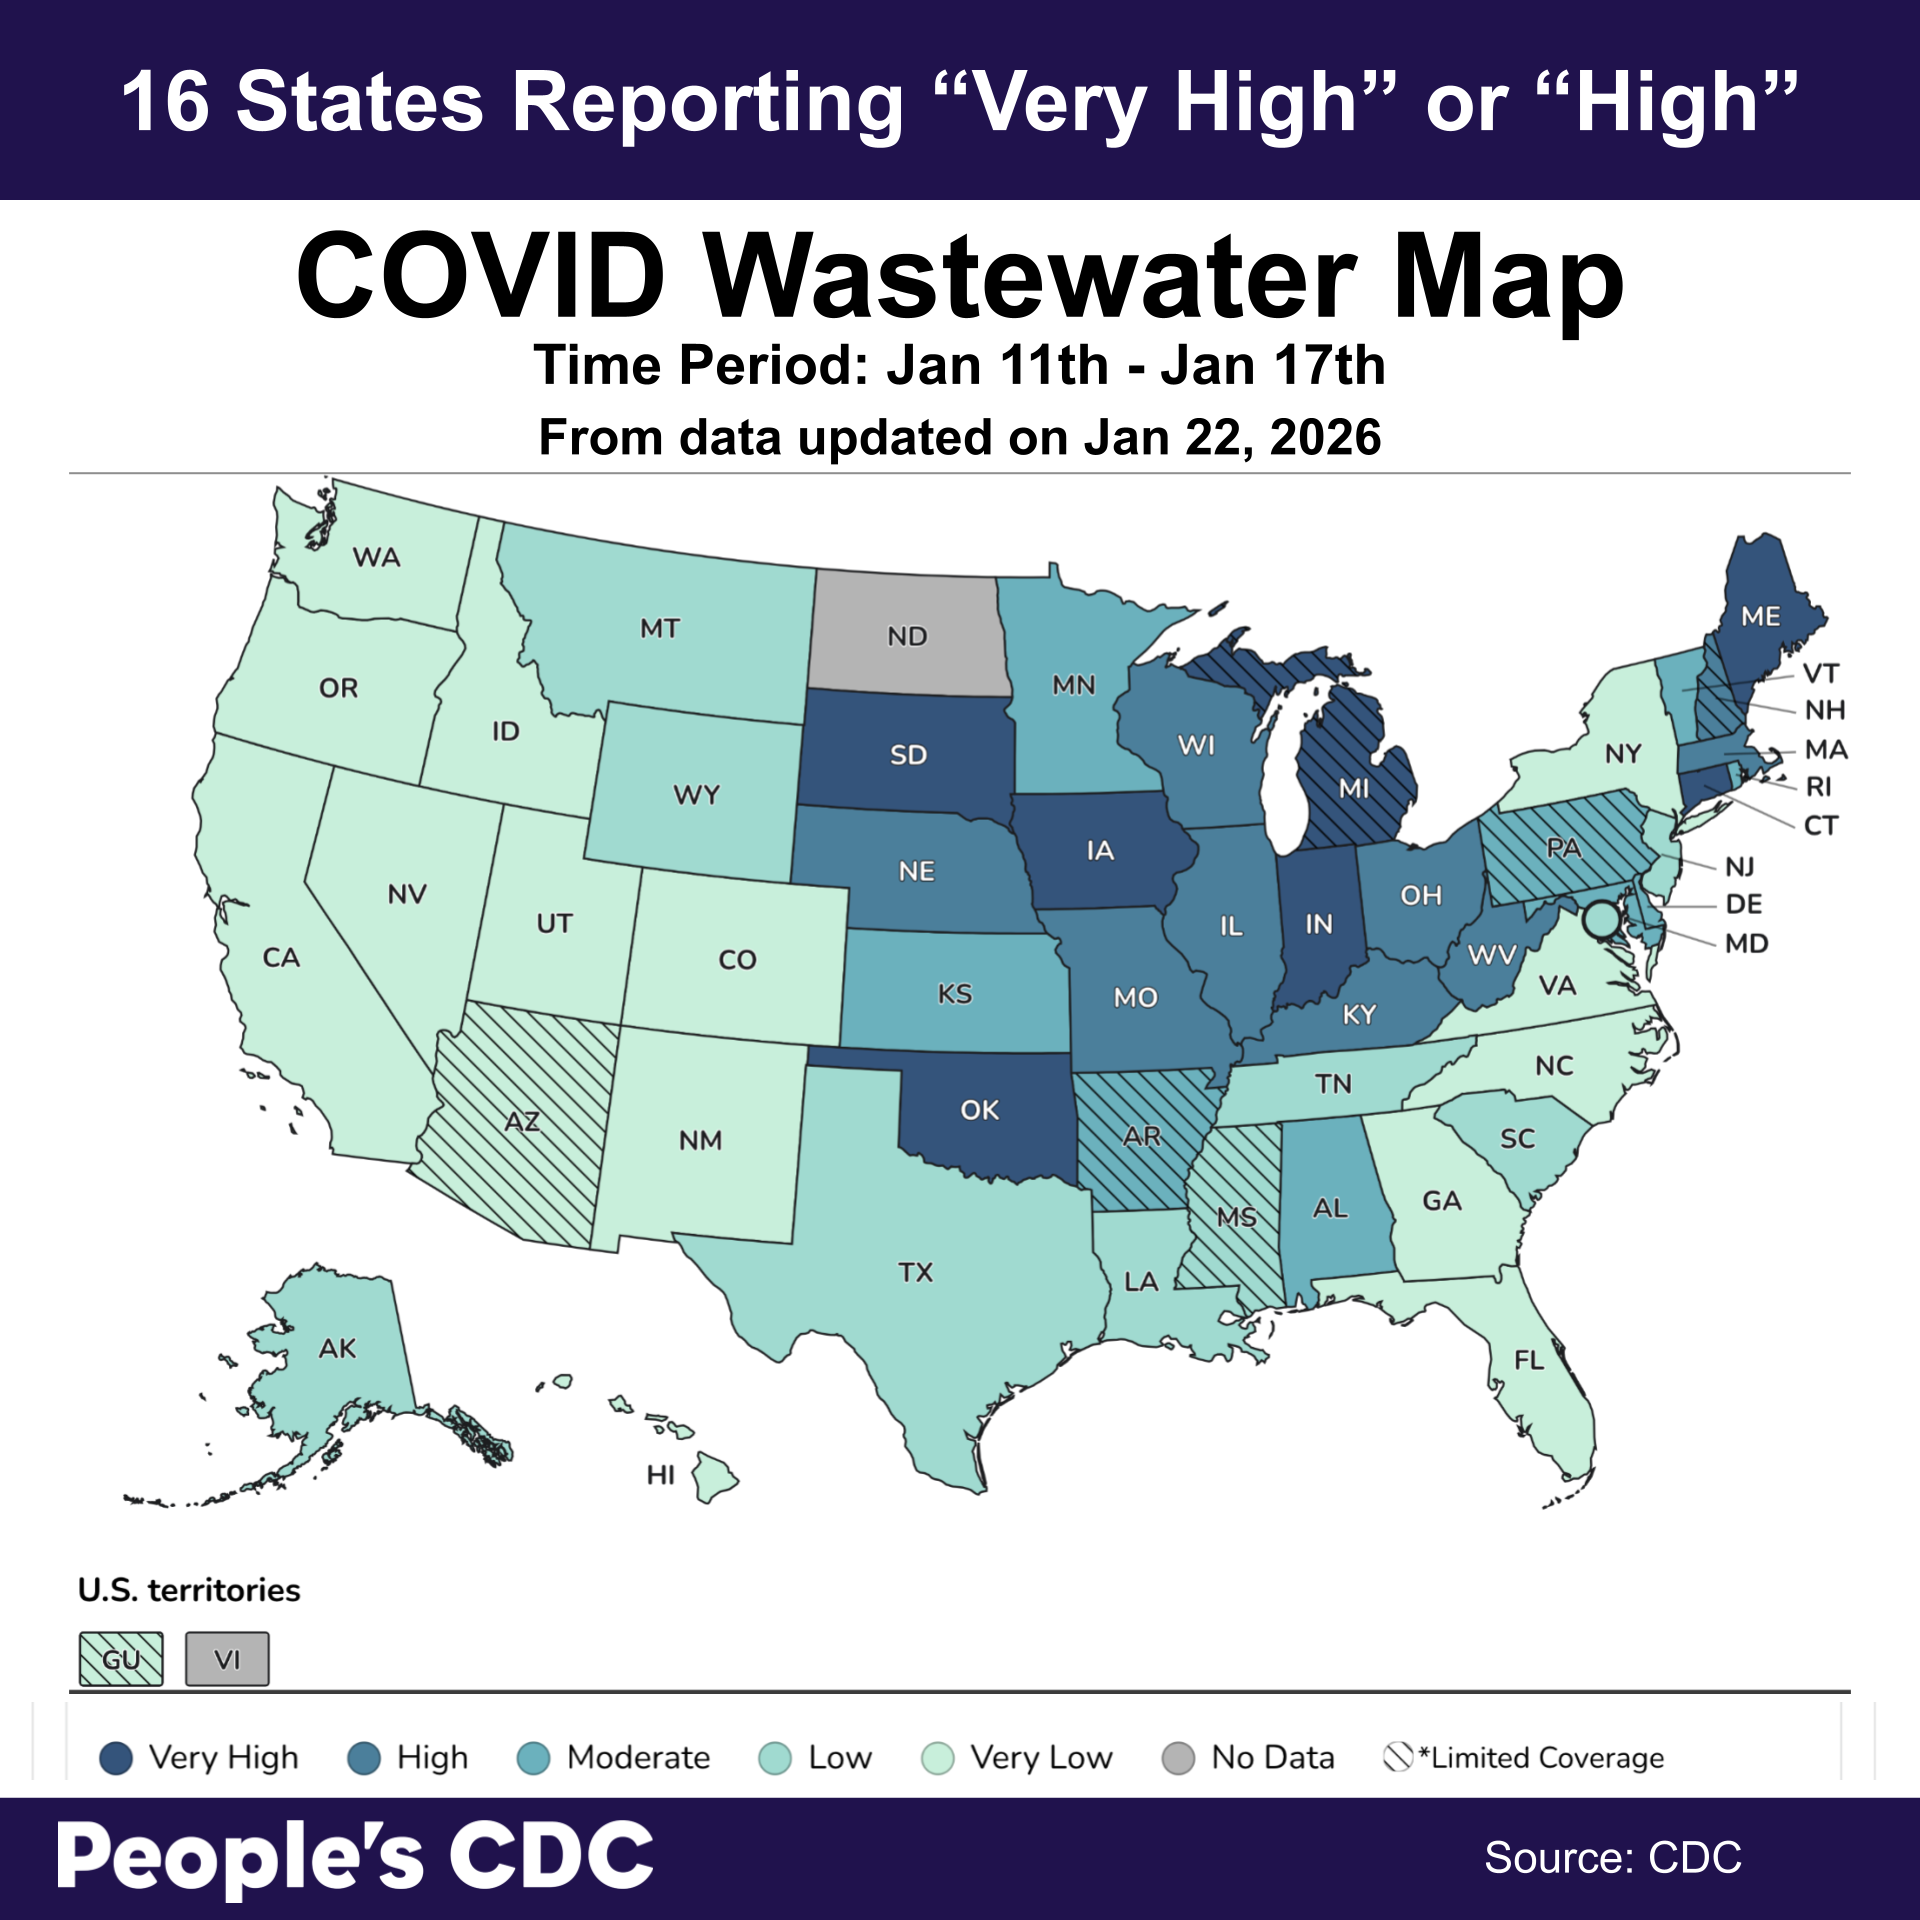
The CDC-based wastewater map was last updated on January 22nd and depicts wastewater levels for the period January 11 – January 17, 2026, showing “very high” or “high” levels across 16 states, most of which are in the Midwest and on the East Coast. It shows “moderate” levels across 9 states, many of which are peppering the South (with the exception of Oklahoma, which is “very high”) and the East Coast. It shows “low” or “very low” levels across 24 states, Guam, and the District of Columbia, which includes the West and the Southern coastal region. Seven states are reporting limited coverage, where only some of the state’s wastewater centers are reporting, so data is based on less than 5%. There is no data for the US Virgin Islands and North Dakota.
Note: our warm-tones wastewater map is currently under construction, but it will return in the coming weeks.
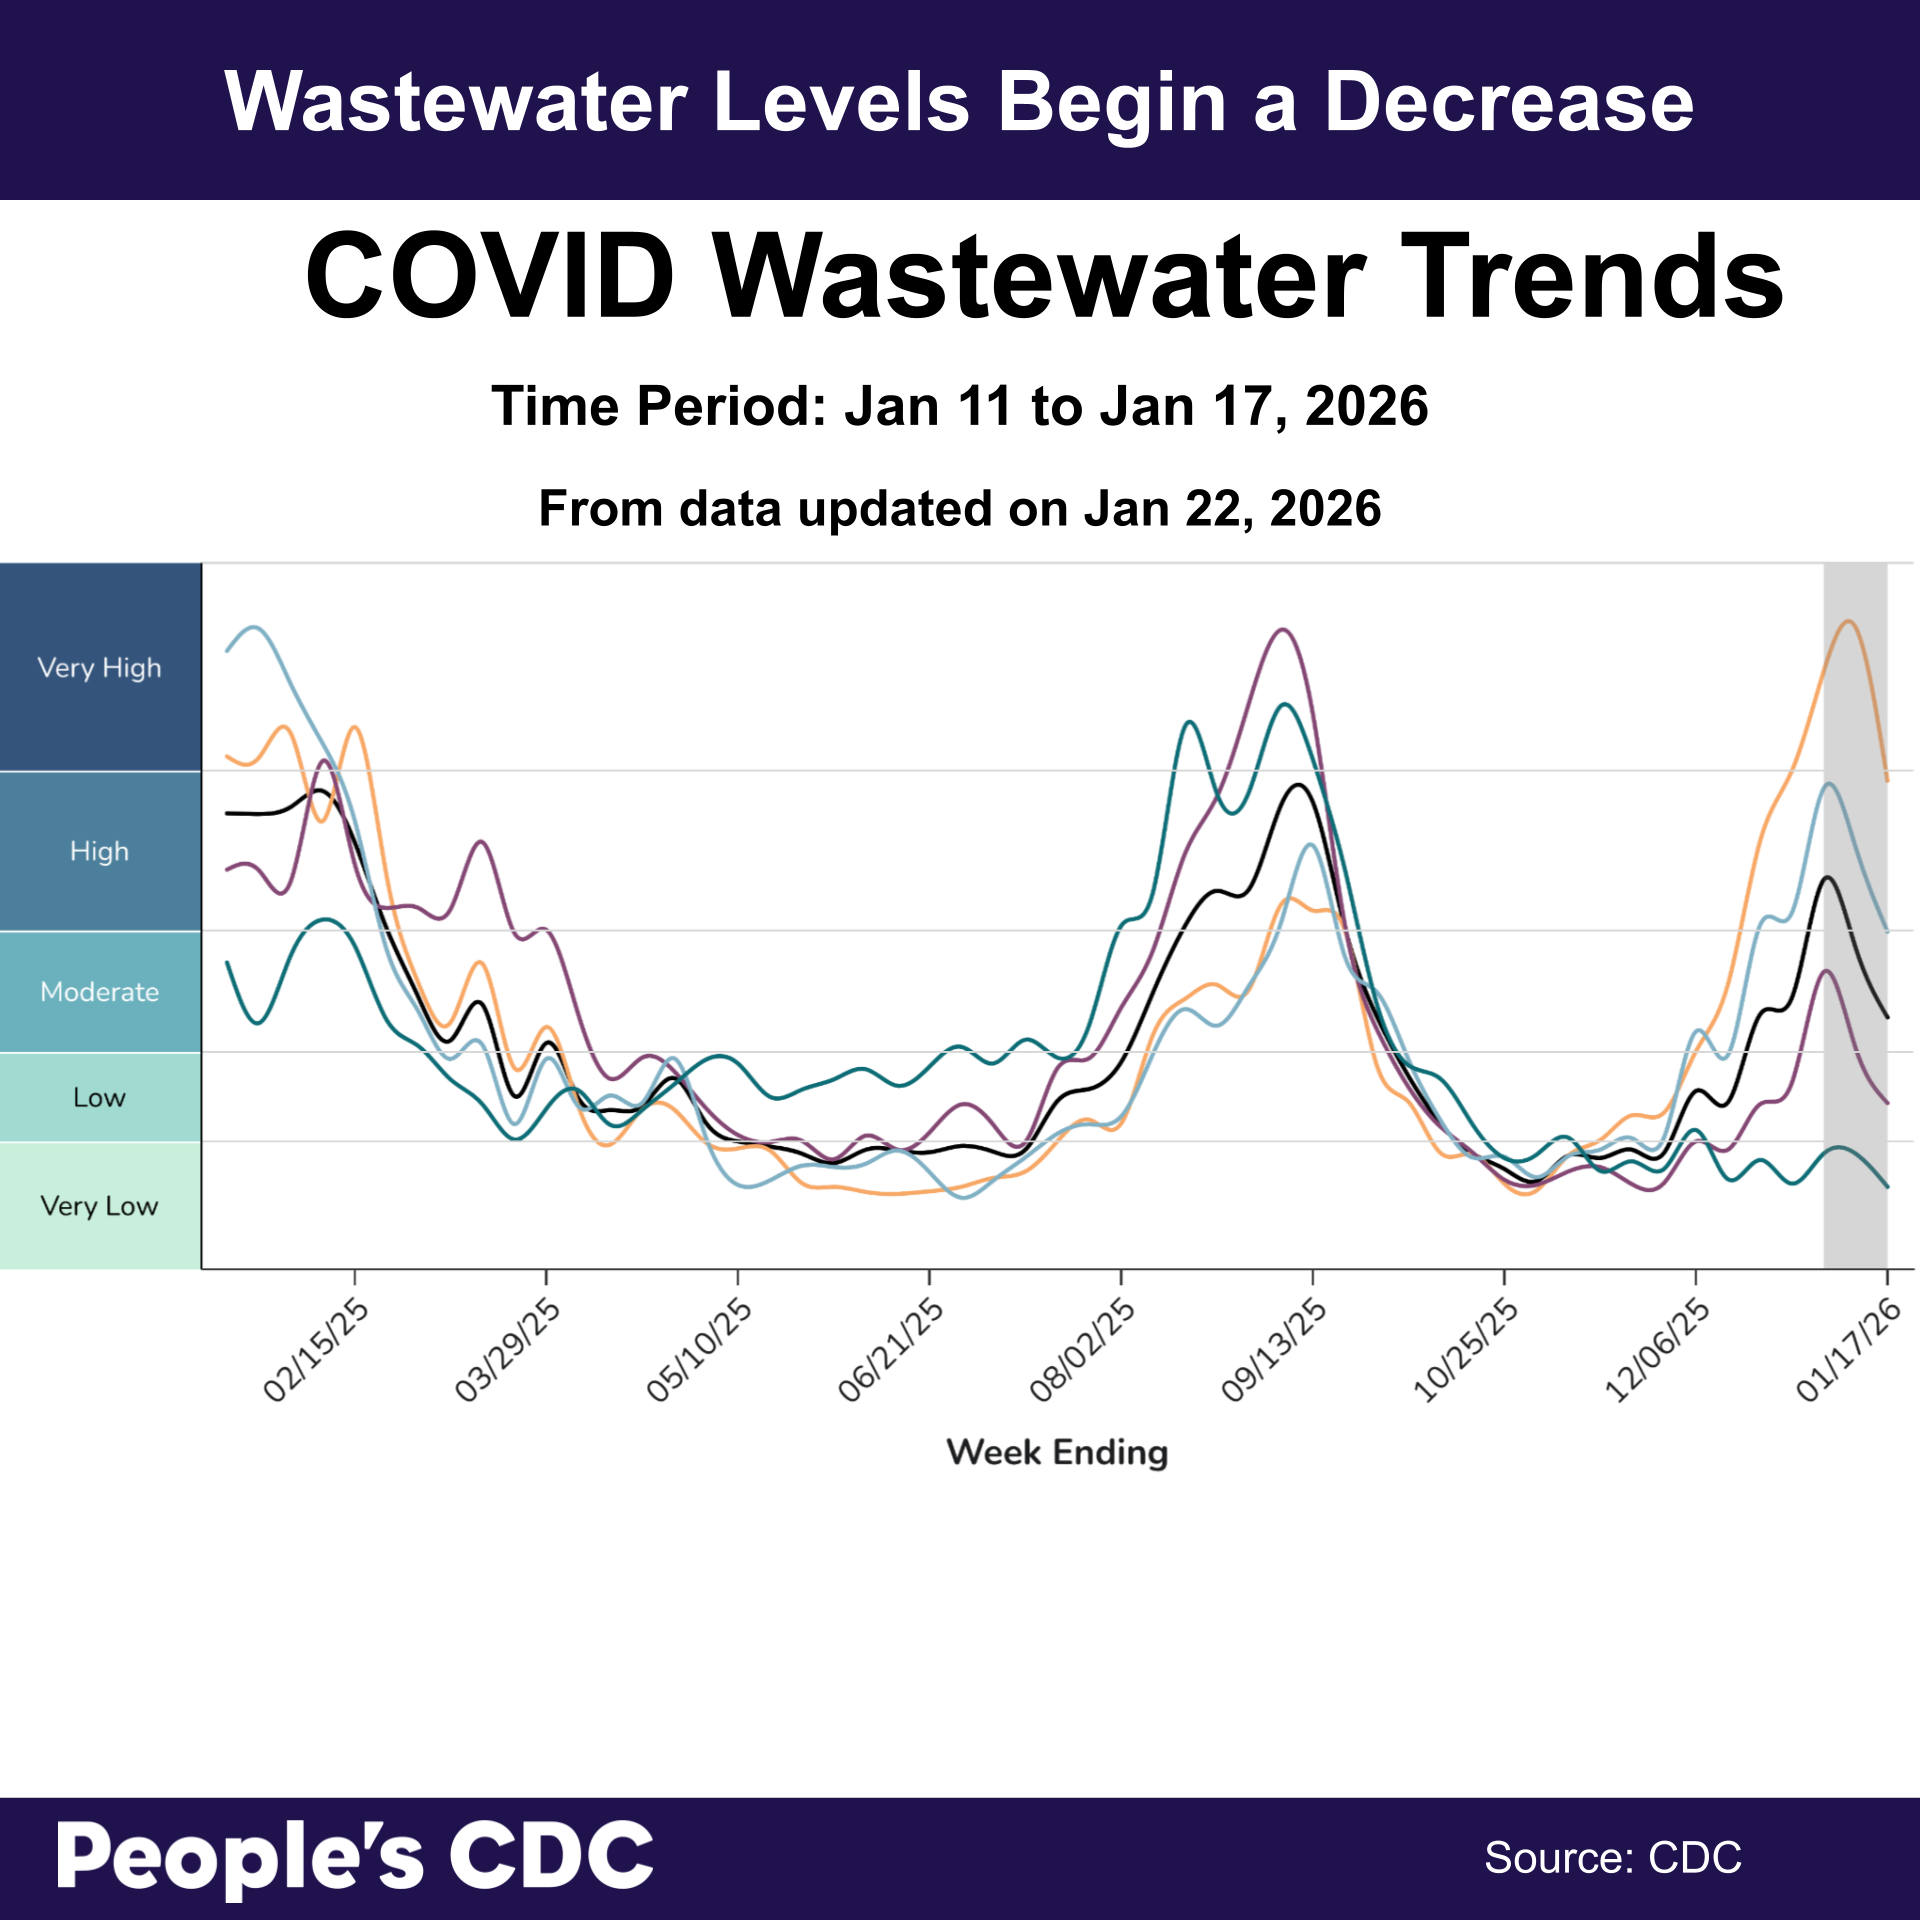
Regional trends show a slight decline in wastewater levels from January 3rd, when we experienced our highest COVID levels of this winter so far. We began the year with national trends and trends for the Northeast being in the “high” category, the Midwest in the “very high” category, the South in “moderate”, and the West in “very low.” These were the highest wastewater levels we have seen since the last surge in August and September of 2025. Though numbers are beginning to decline, it is important to continue to take precautions, as historically, during a surge, elevated levels last for at least 2 months.
Remember that using multiple layers of protection is the most effective way to avoid the virus. For example, regular use of an N95/KN95/KF94 mask in public spaces, combined with vaccination with the latest booster, would be 2 layers of COVID protection. It is important to remember that no single layer is 100% effective — though masking with a N95/KN95/KF94 mask is the most effective single layer, as it filters out over 90% of all incoming air pollution, allergens, and virus particles.
Vaccination with the most up-to-date booster is important because it helps reduce the risk of death and hospitalization and shortens the time a person is contagious, which can decrease the risk of passing illness to others. Despite this, vaccination alone will not prevent a COVID infection. COVID is a vascular disease, and even non-severe and asymptomatic cases increase the risk for complications such as Long COVID down the line. Layers of protection are important to protect you and the ones you love from developing chronic illness and disability.
For the full list of available layers of protection or help creating an accessibility policy for your next function, check out our Safer Gatherings Guide.
Emergency Room Use
Another sign of the serious impact of COVID is the percentage of emergency room visits involving a new COVID diagnosis. According to the CDC, the proportion of Emergency Room visits involving a COVID diagnosis is in the “low” category.
Despite the map that lists most states as “Likely Declining” or “Declining”, the CDC ranks the overall US epidemic trend for this period as “Growing” — “Probability COVID-19 epidemic is growing: 92.57%.”
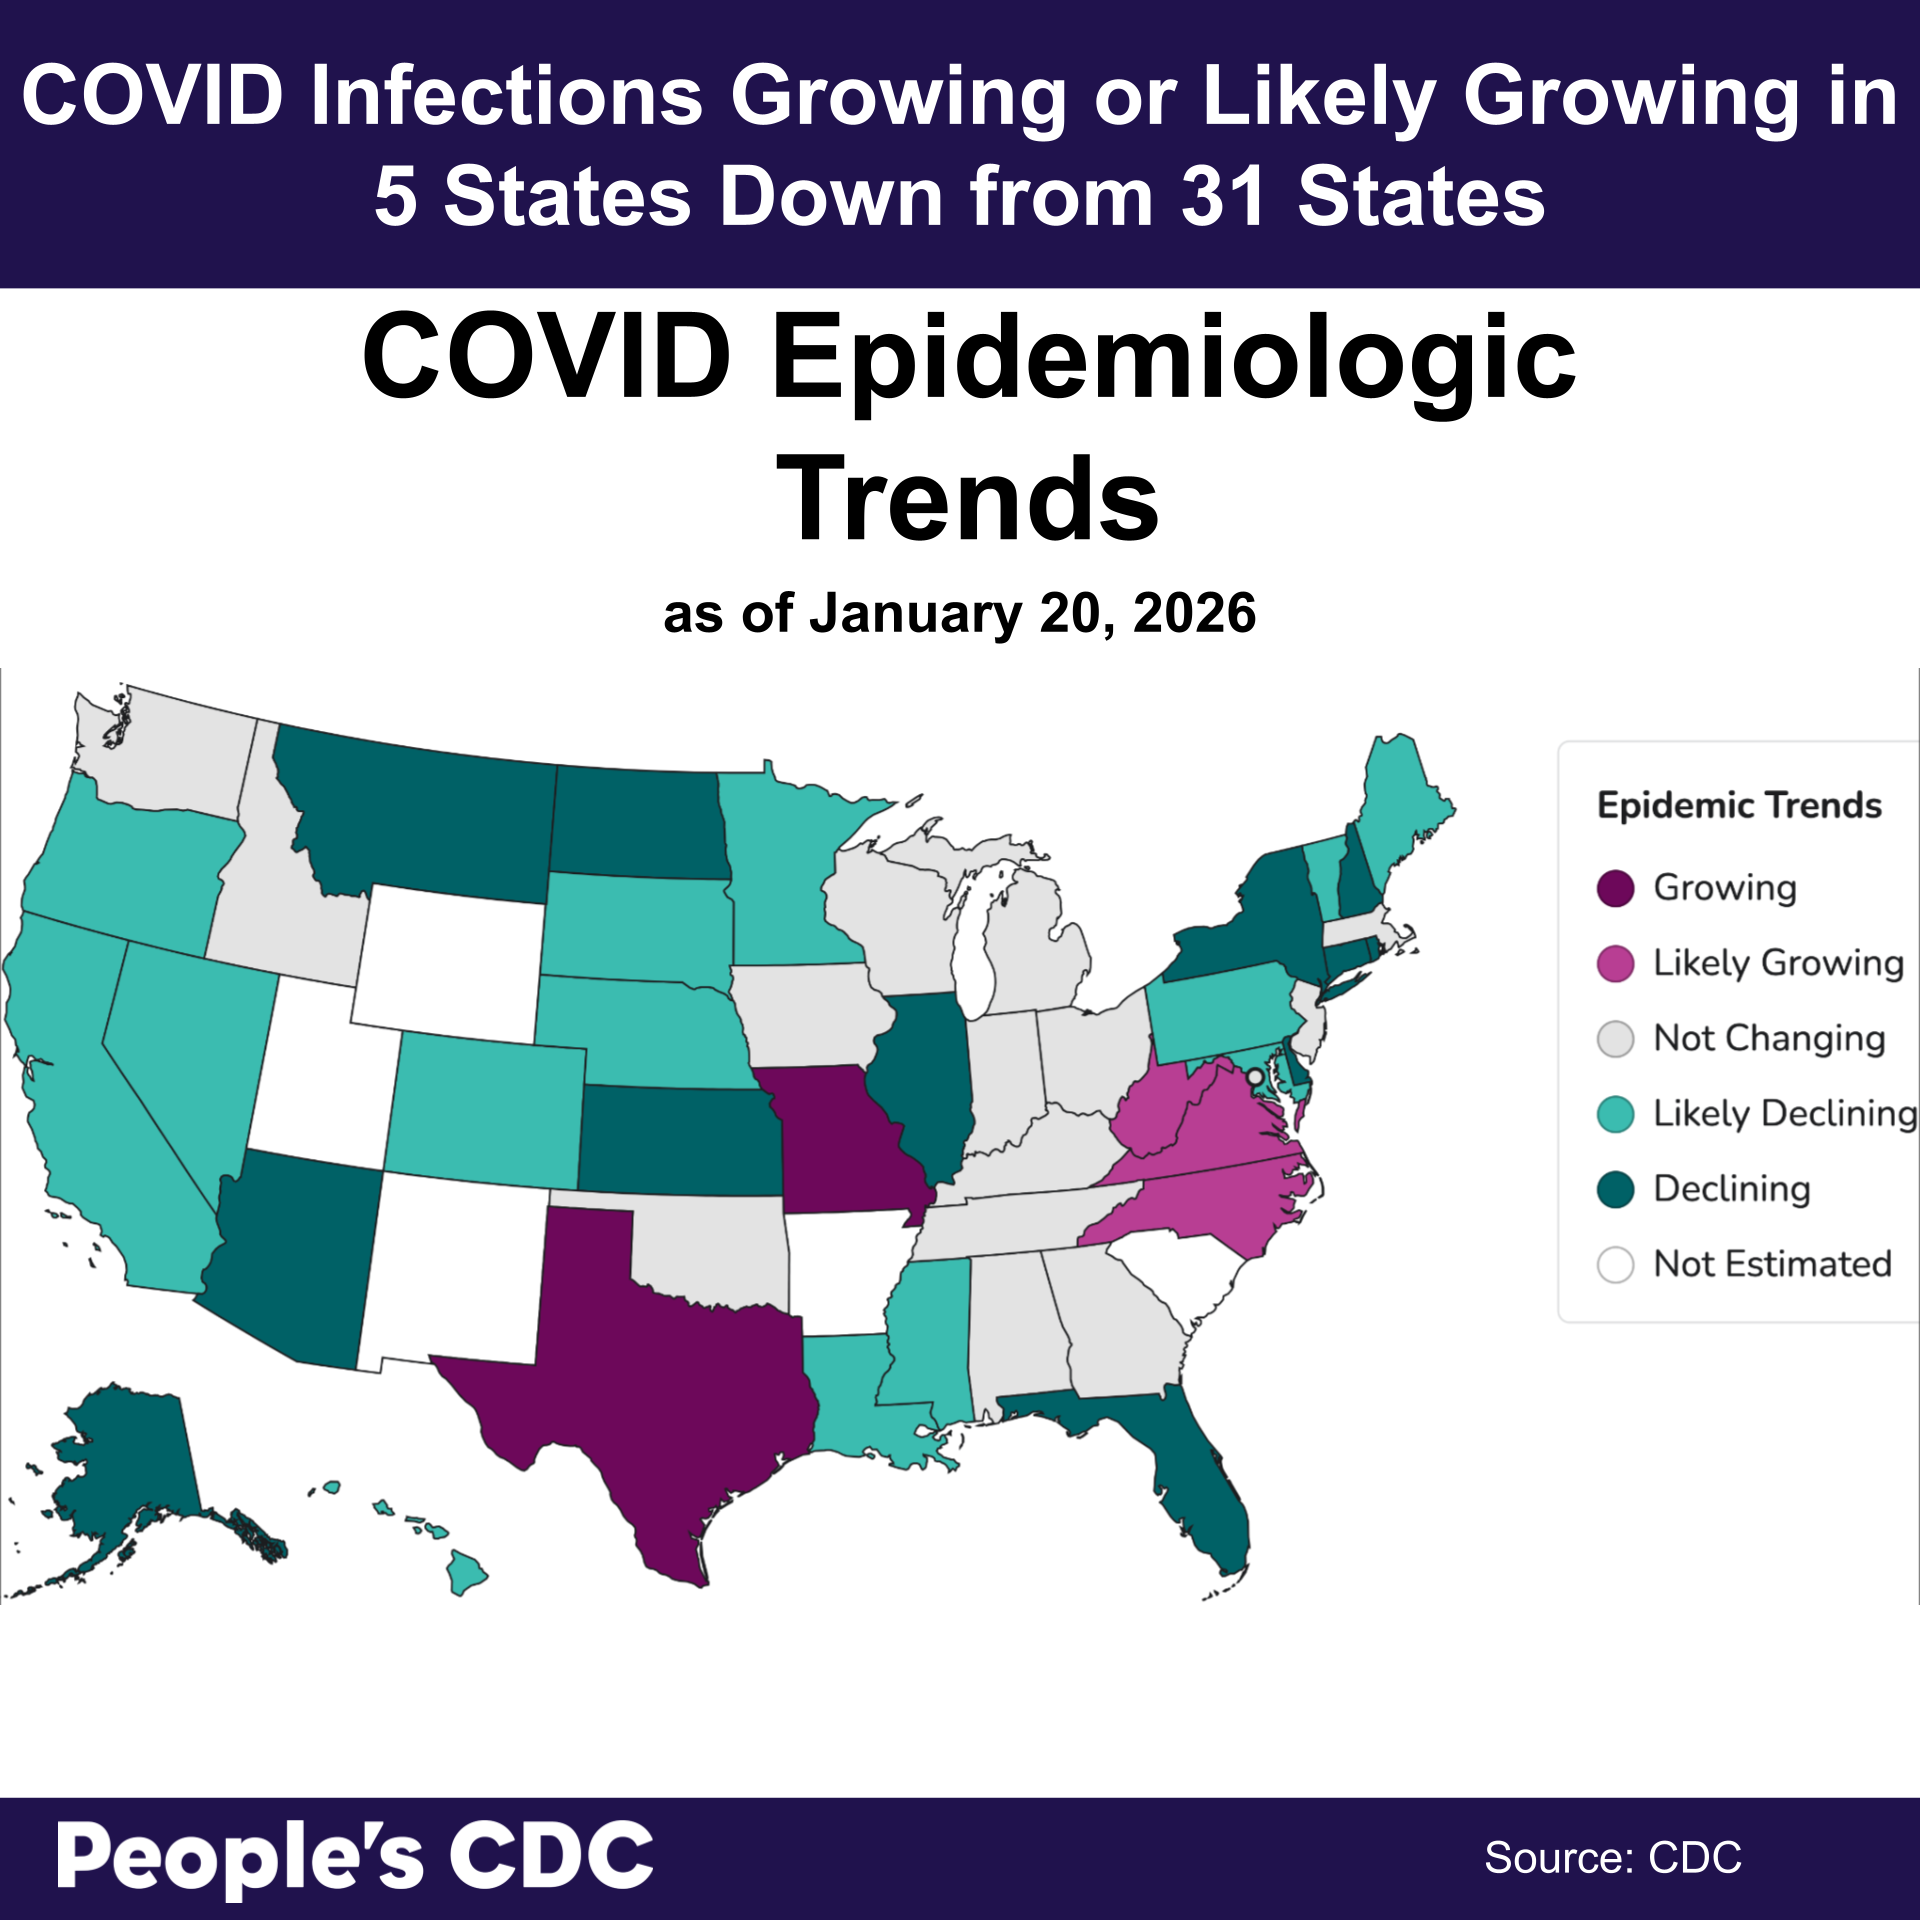
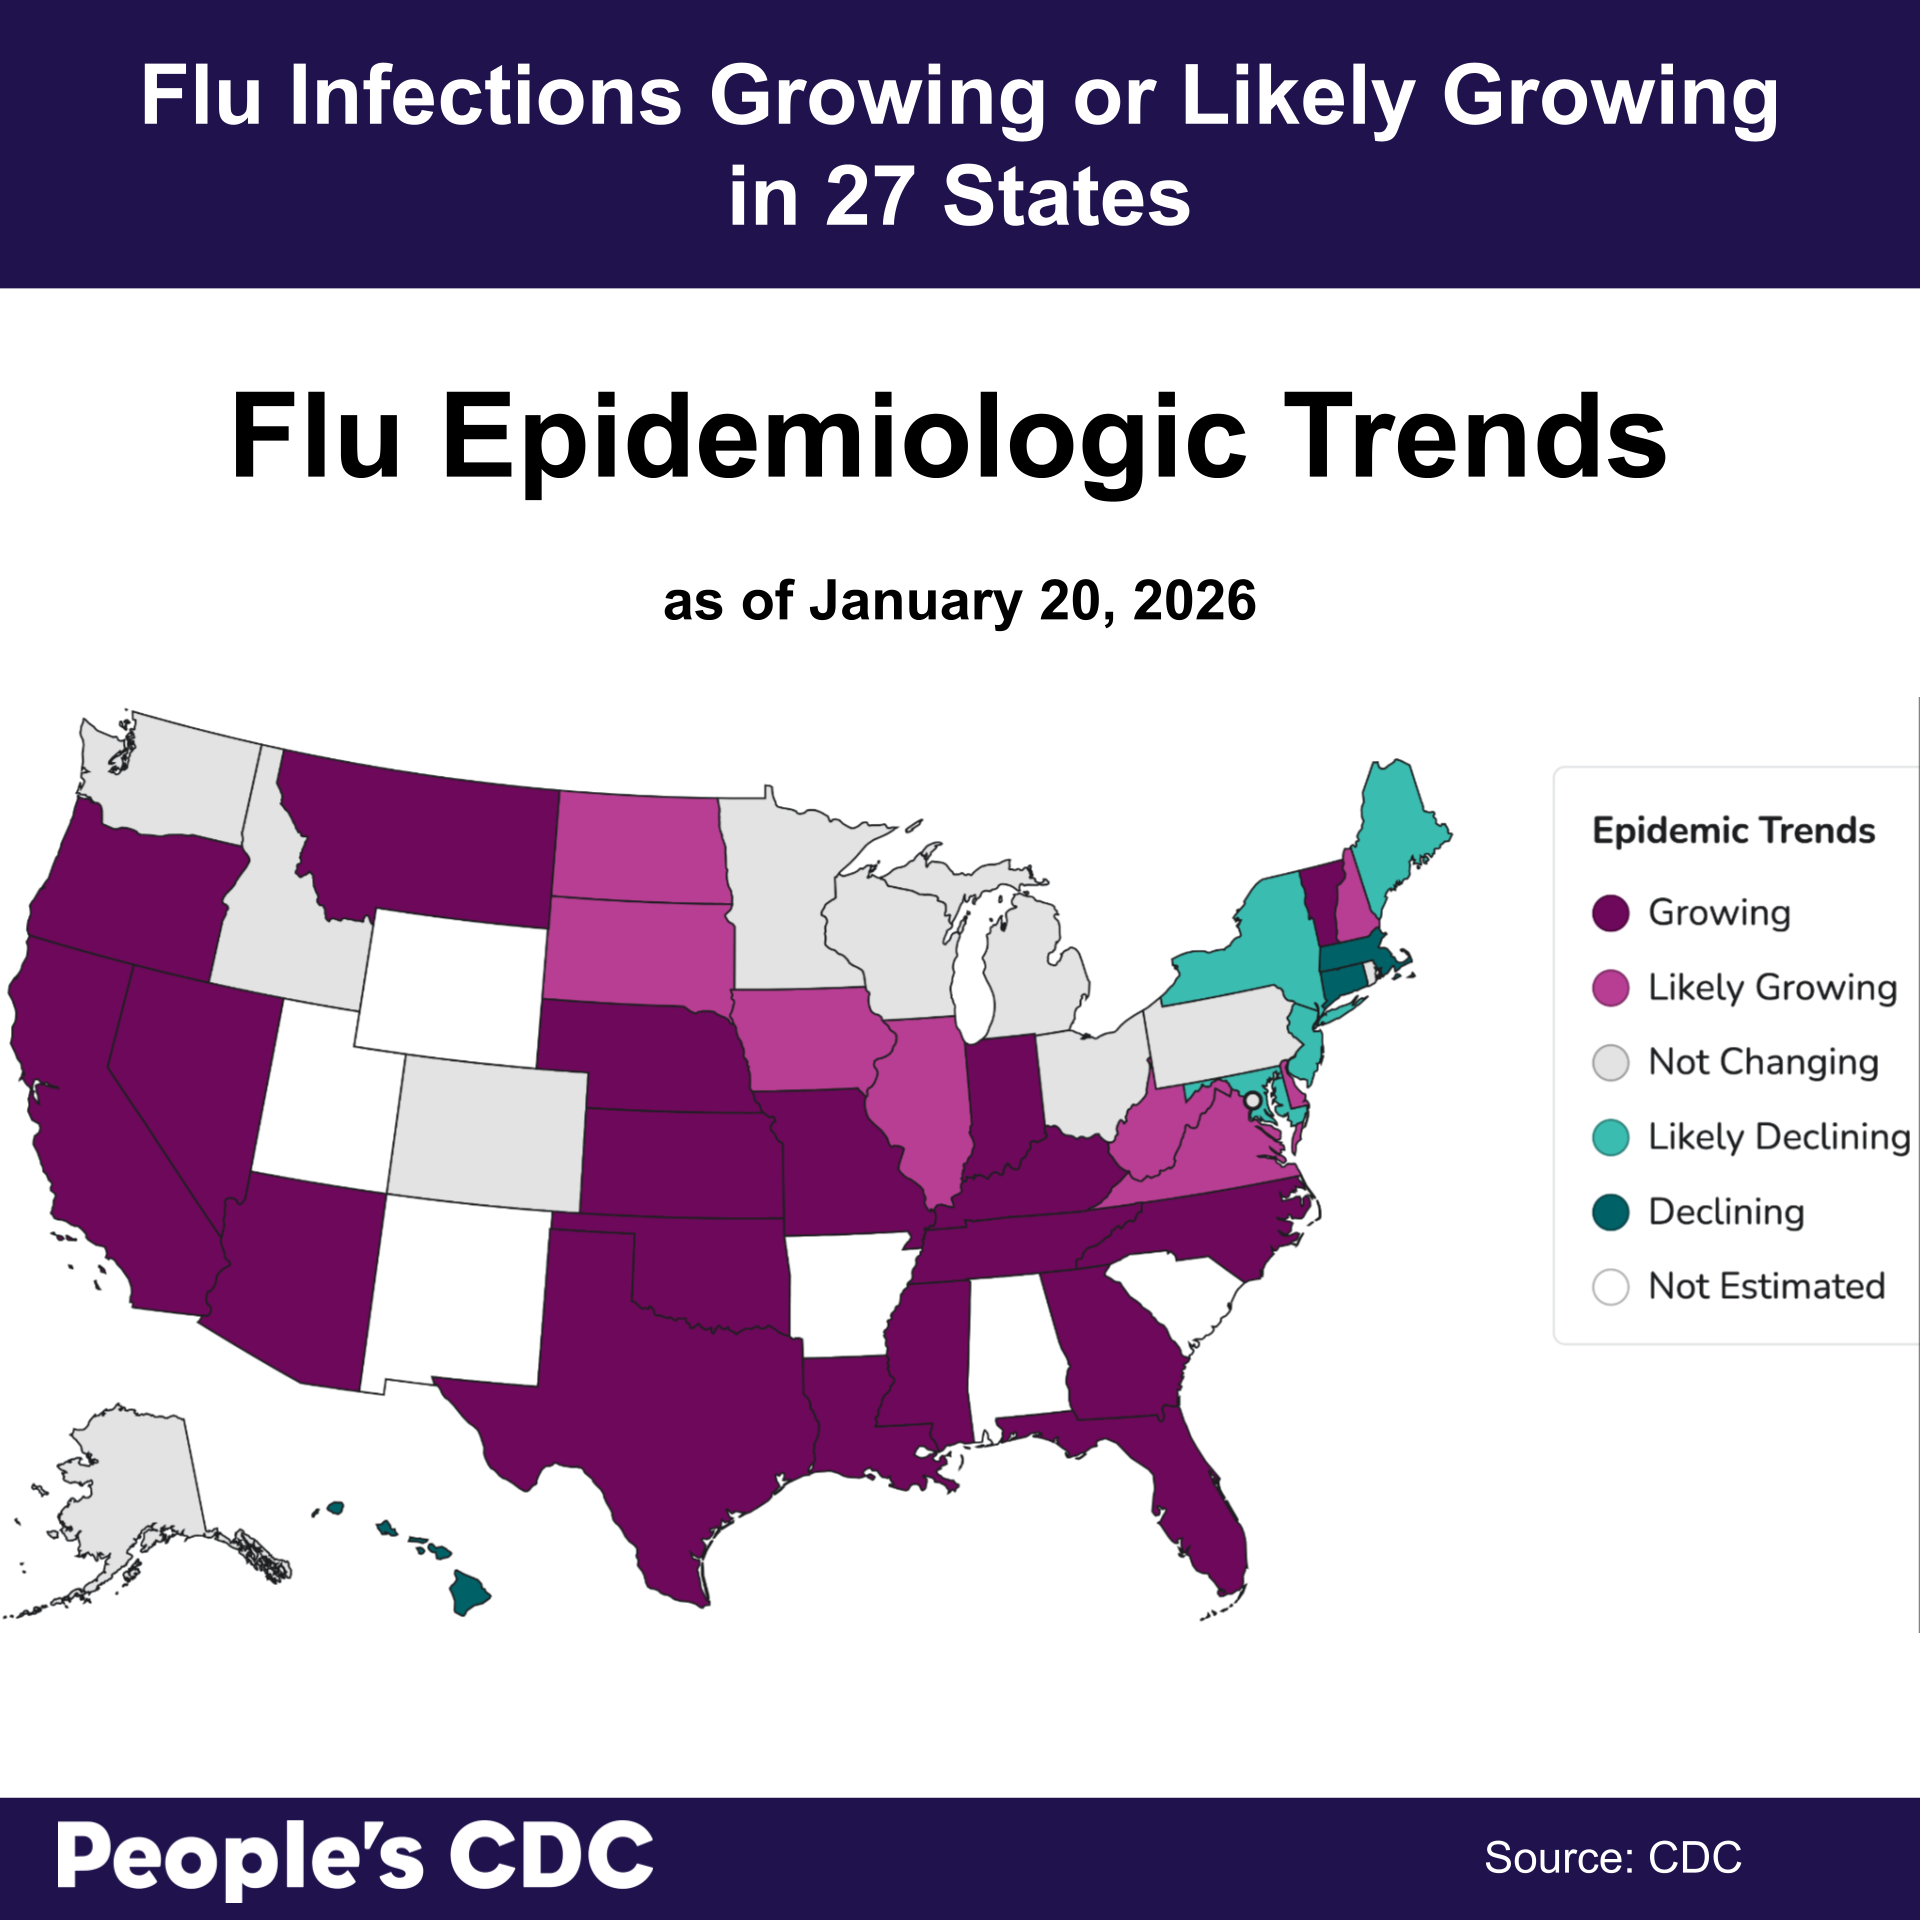
Additionally, this year’s particularly severe flu season, as evidenced by the record flu numbers we saw in New York State a few weeks ago, appears to have spread to the rest of the nation. As of January 20th, 27 states have an influenza infection rate that is “growing” or “likely growing.” Many western and southern coastal states with “low” or “very low” COVID wastewater levels are in the “growing” category for flu, indicating increasing hospitalizations. Some states are experiencing a double whammy, with both “high” or “very high” wastewater levels for COVID and “growing” or “likely growing” levels for the flu. The states included in this double whammy are the Midwestern states of: Nebraska, Oklahoma, Missouri, Iowa, Illinois, and Indiana and the Southern states of: Kentucky and West Virginia.
Variants
The CDC publishes SARS-CoV-2 variant proportions every four weeks on Tuesdays. As of January 16, 2026, the CDC’s wastewater variant tracking shows that variant XFG, AKA “Stratus,” still makes up a majority of infections, but its dominance seems to be dropping as it is predicted to account for 53% of all infections, the lowest percentage since August 2nd, 2025. Behind it, other XFG derivative variants such as XFG.14.1 (16%), XFG.14.1 (16%), XFG.1.1 (8%), and XFG.6 (8%) are gaining ground in the total infections they account for. This means it seems that, unlike one new variant taking the lead as the next dominant strain, we are looking at 50% of infections being made up by a variety of smaller variants. This is the kind of variant outlook that could make it easier to get multiple COVID infections in a shorter period, as the infection that one’s body has produced the most antibodies for in a previous infection is not necessarily the one that they will come into contact with next.
If you have not gotten your COVID booster for this year, it is not too late. WHO has noted that the most recent booster should offer protection against hospitalization and death from XFG variants.
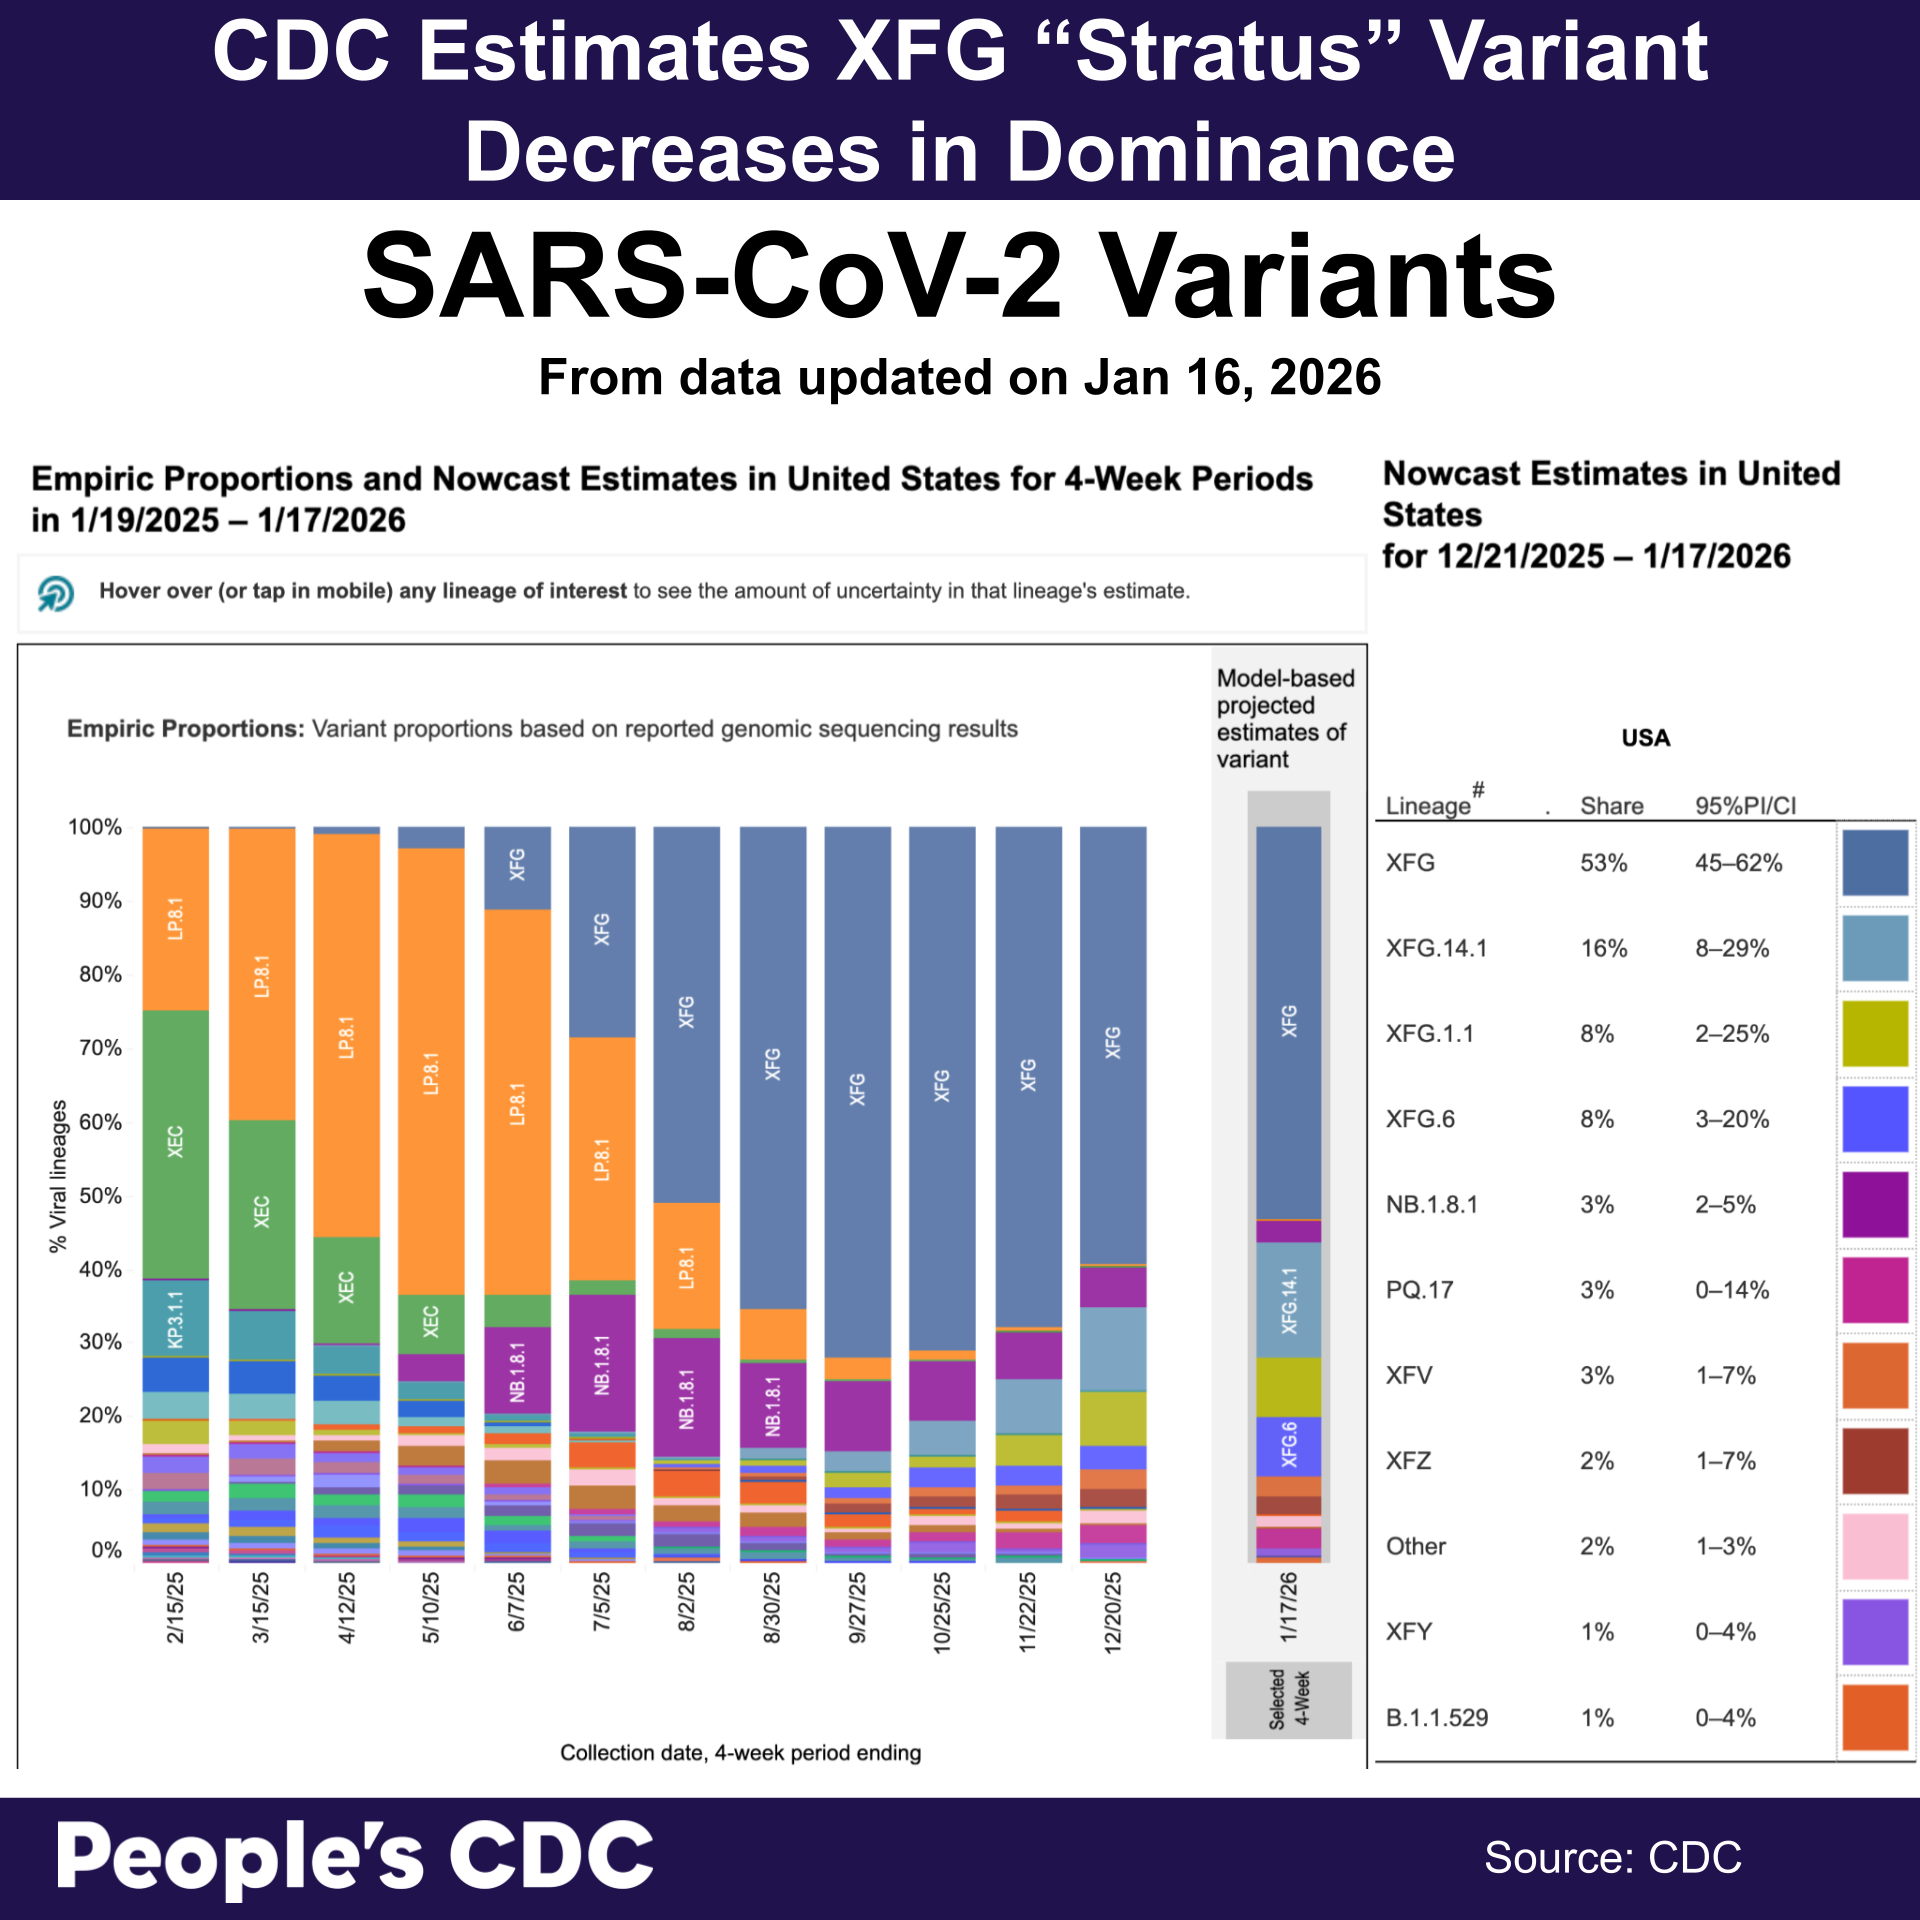 Graphic source: CDC Wastewater Variant Tracker
Proposed Funding Cuts to CDC Wastewater Surveillance Programs
The CDC’s wastewater surveillance program helps detect early increases in the spread of infectious disease across the US. Funding supports local and state wastewater surveillance in partnership with public health departments. This program has estimated transmission levels for SARS-CoV-2, Flu, RSV, Mpox, Measles, and other infectious diseases. The current administration is proposing to reduce funding for wastewater surveillance from $125 million to $25 million. This program already receives limited funding for infectious disease detection; a proposed cut would nearly destroy the current system, effectively eliminating this critical disease monitoring system.
Visit our “Take Action” section to find out how to combat these proposed funding cuts to wastewater surveillance!
Take Action
Maintain Funding of the CDC’s Wastewater Surveillance Program. Wastewater surveillance is an invaluable public health tool that informs estimates of infectious disease transmission, such as SARS-CoV-2, Flu, RSV, Mpox, Measles, and others. Funding cuts will destroy this important public health infrastructure. We ask that you contact your elected leaders before January 30, 2026, to oppose the proposed budget and demand full funding of at least $125 million a year for a permanent infectious disease wastewater surveillance system. More detailed instructions will be provided over the next few days.
Know Your Rights when dealing with ICE. Join up with detention defense movements in your area. Each region will have its own specific strategies, but this video from the Mayor of New York City, Zohran Mamdani, explains the basics, reminding us that “ICE is legally allowed to lie to you.” Check out our COVID Safety for Protests toolkit and remember to wear a mask — if not for yourself, for everyone else!
Make the classroom safer. Encouraging your student(s) to wear a high-quality mask is a fantastic way to help protect them. You can also add an air purifier to the classroom. Studies have shown that adding an air purifier can greatly reduce infection rates not just of COVID but also of many other common illnesses in classrooms and daycares. You can meet with teachers or go to your local school board meeting to pitch the idea. If you are worried about the sensitivity around discussing COVID, you can frame the discussion around colds and the flu more generally, since the air purifiers work on those as well! Teachers can pitch this idea to their unions as a reasonable workplace safety measure. No one wants their child coming home sick. Teachers don’t enjoy getting sick at work. Air purifiers are a simple intervention that benefits everyone. If costs are an issue, propose a classroom/school fundraiser. We need to be creative in these sensitive and tumultuous times on how to keep ourselves and our communities safer. See our Safer Gatherings toolkit for more tips on making classrooms safer.
Remove RFK Jr. petition: We continue to call for the removal of RFK Jr. Stand Up For Science has created its own petition calling for the removal of RFK Jr. as Secretary of Health and Human Services. We encourage you to read it and sign on.
With the spread of COVID, Flu, RSV, and measles in the US, we need to keep ourselves and our communities safe by using KF94/KN95/N95 masks and as many layers of protection as possible. Our Safer Gathering Guide provides recommendations for safer meetings and gatherings. Please continue to share it!
Notes: 1) The numbers in this report were current as of 1/24/2026. 2) Check out the links throughout & see our website for more at https://peoplescdc.org. 3) Subscribe to our newsletter: People’s CDC | Substack.
If you’re donating to us through Substack, consider getting the Substack for free (it’s not paywalled!) and donating to us directly. That way, there are fewer fees for everyone.