Wins
We’re putting wins upfront this week, because we need to remember that authoritarianism relies on our feeling isolated and powerless. But across the country, people continue to rise up, fight back, and WIN!
Potential ICE “detention facilities” are getting shut down throughout the country, including in Ashland, Virginia and Kansas City, Missouri. Opposition is growing in other places as well, including Social Circle, Georgia. To better appreciate the scale and the varied approaches communities are using, read this summary of resistance by the Marshall Project.
The Weather
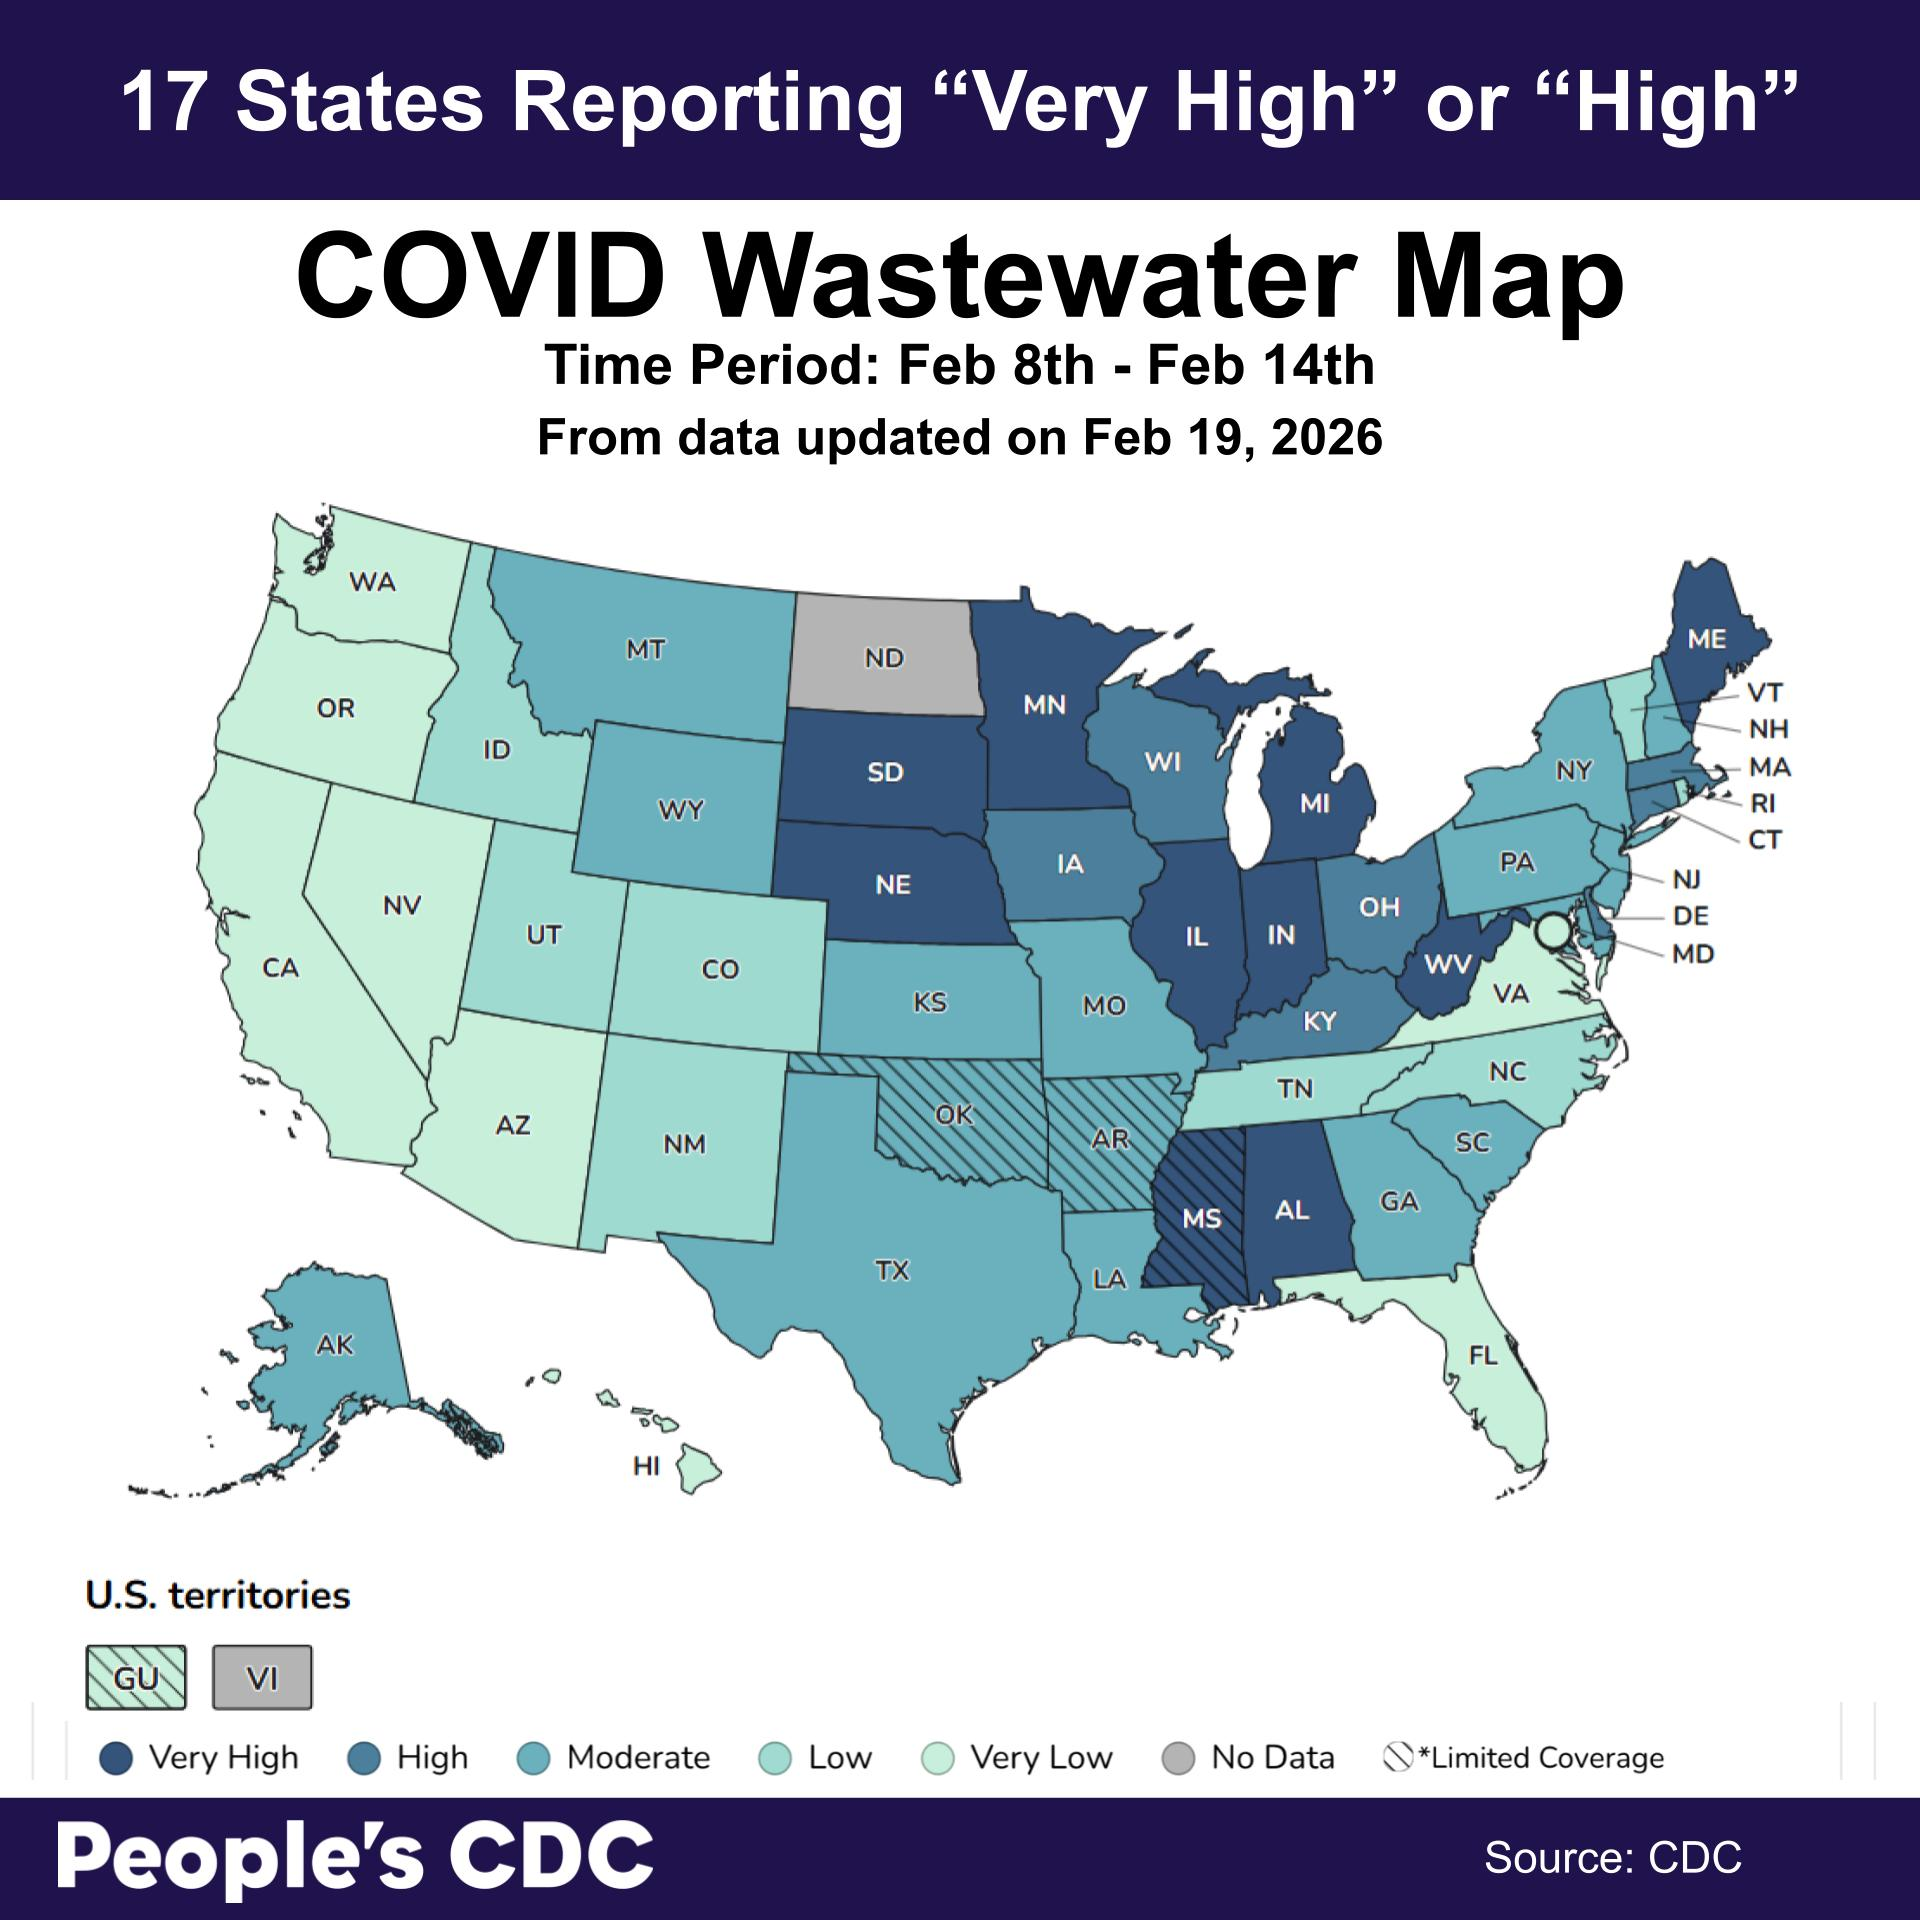
The CDC-based wastewater map was last updated on February 19th, and depicts wastewater levels for the period February 8th – February 14th, 2026, showing “very high” or “high” levels across 17 states, most of which are in the Midwest and Northeast. It shows “moderate” levels across 16 states, an increase from our last report, scattered across the country. It shows “low” or “very low” levels across 16 states, mostly in the West, as well as Washington, DC and Guam. Three states and Guam are reporting limited coverage, meaning only some of the state’s wastewater centers are reporting, and the data is based on less than 5%. There is no data for the US Virgin Islands and North Dakota.
Note: We will be rolling out a new map soon, and we look forward to your feedback!
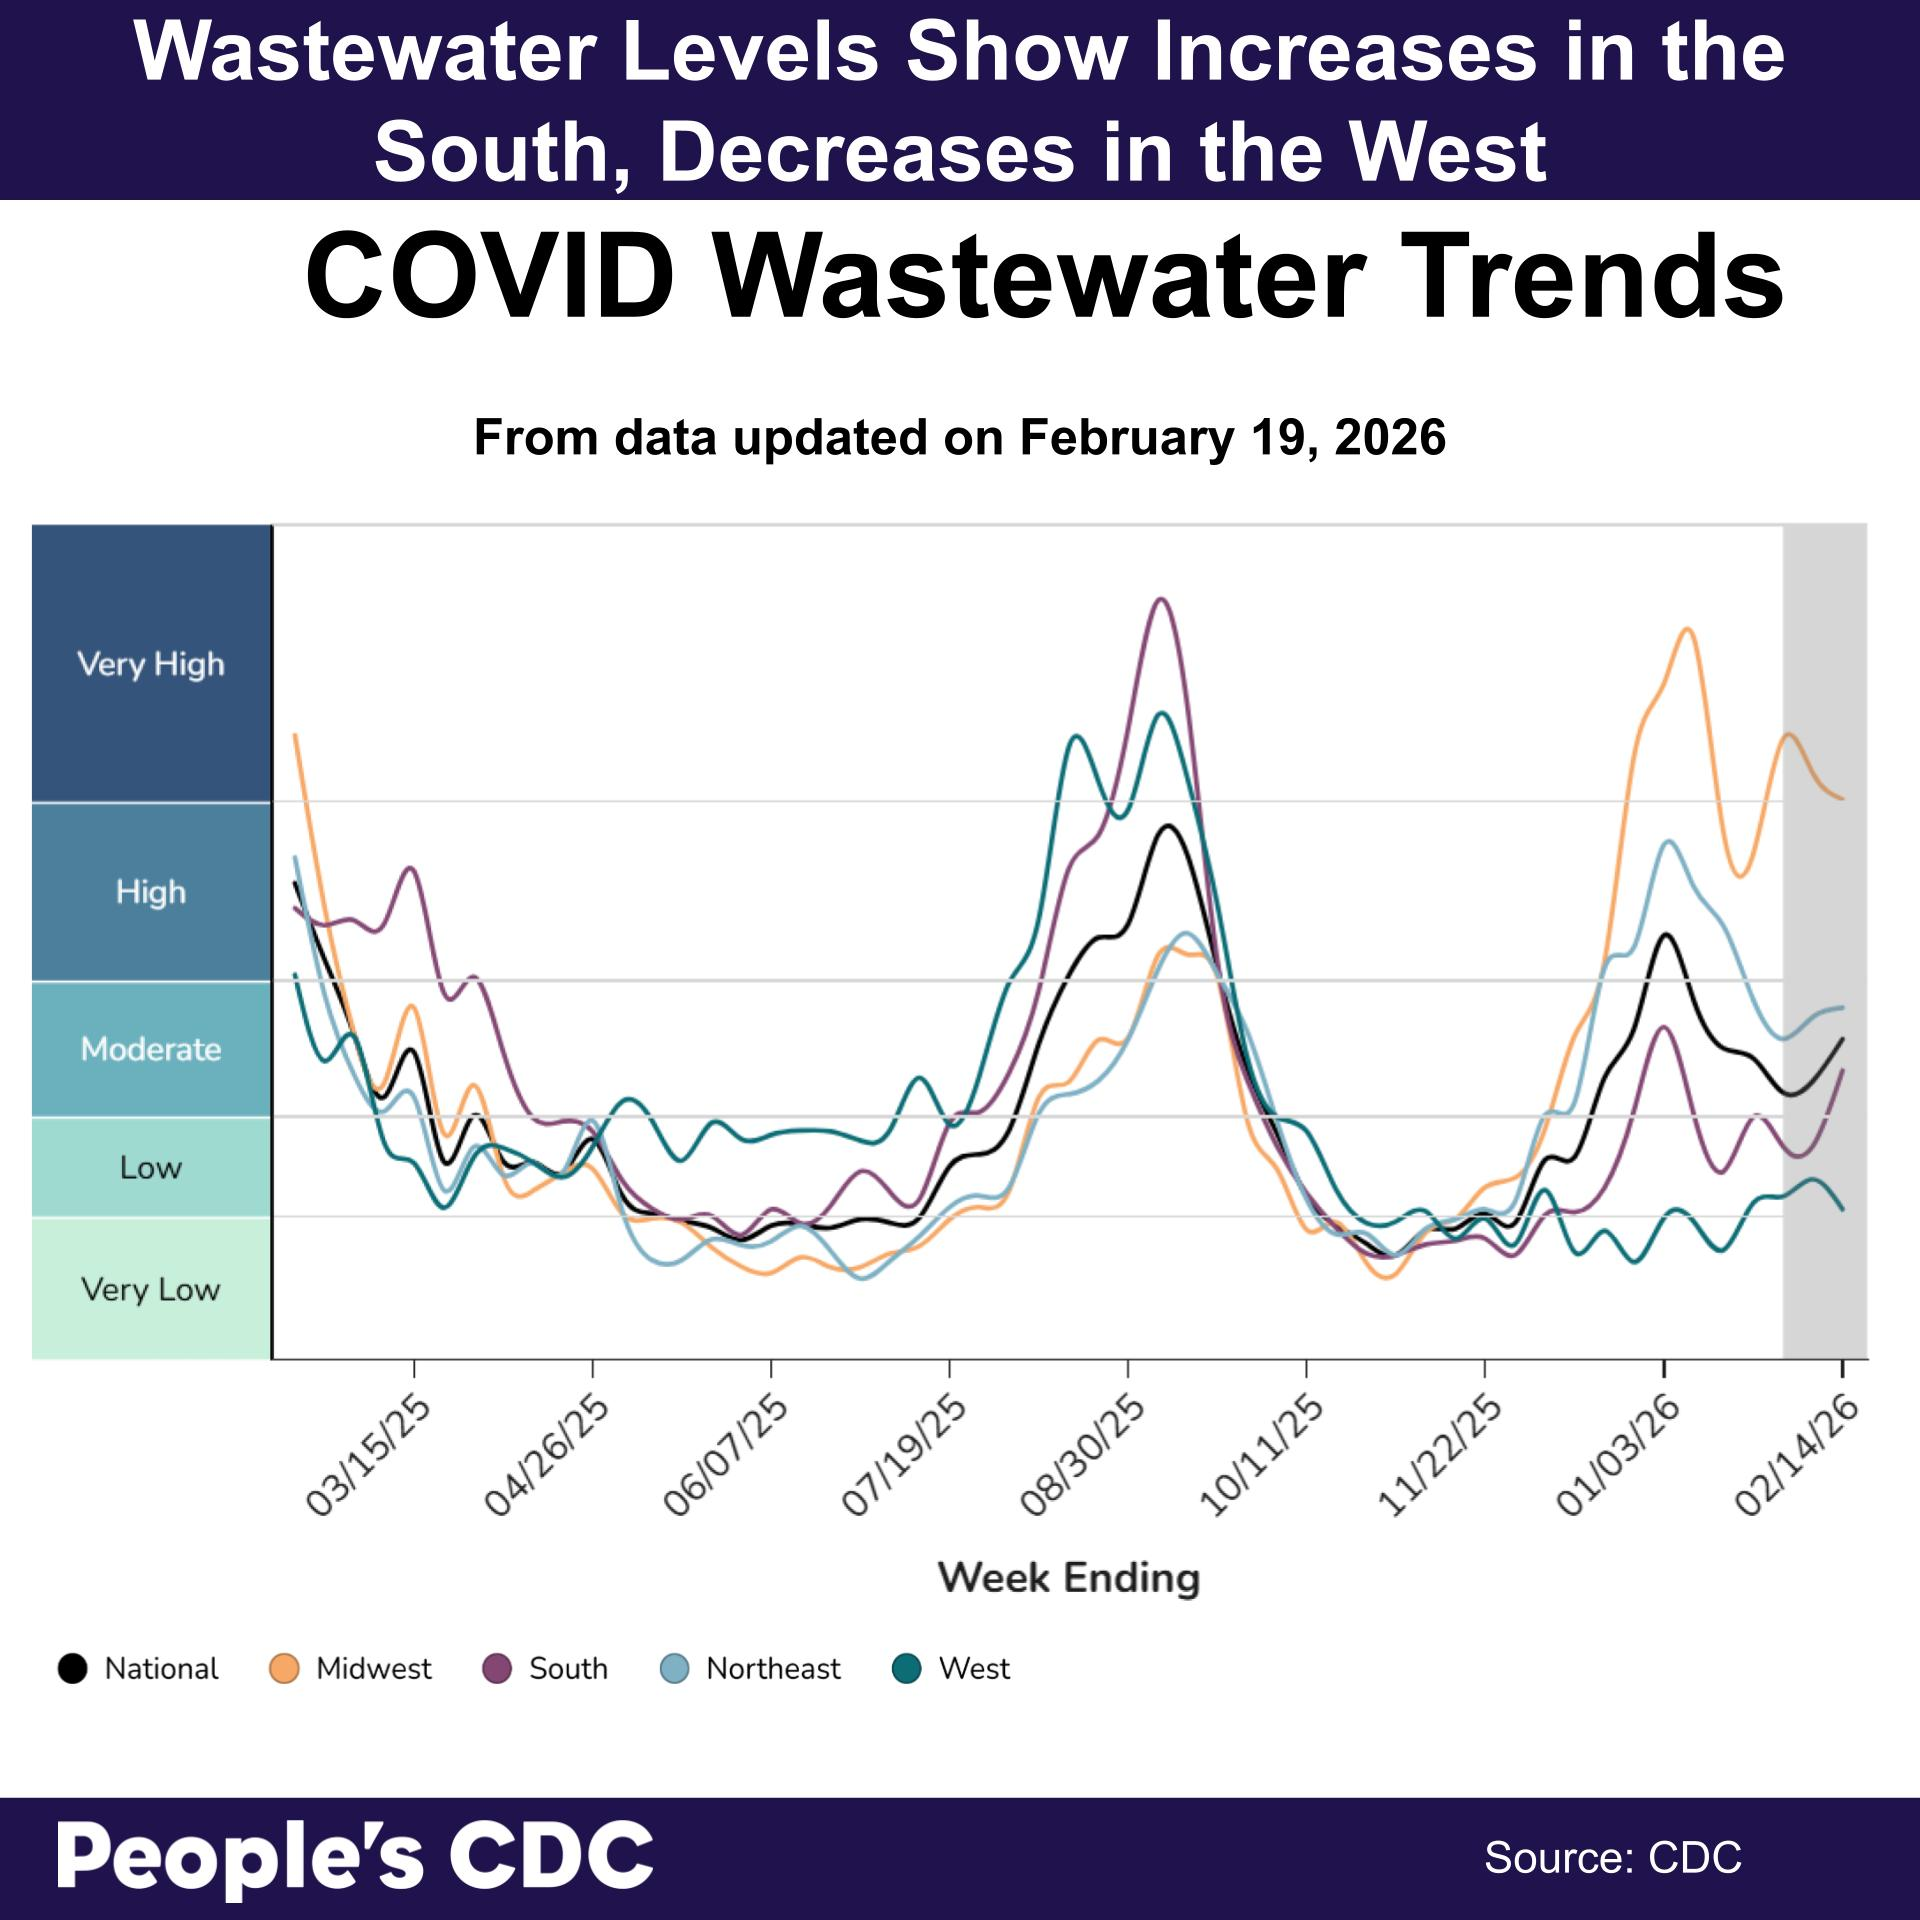
Regional trends show an increase in the South and a decrease in the West. Overall, national trends are upward. Though this winter wave peaked at lower levels than previous years, increases have persisted for nearly 3 months. It is important to continue taking precautions, including wearing N95/KN95/KF94 masks in public spaces, staying up to date with vaccinations, and using air cleaners (air “purifiers”) or opening windows whenever possible.
To make your next gathering as safe as possible, check out our Safer Gatherings Guide.
Other respiratory viruses
The CDC indicates wastewater levels for flu are “low” nationally, though again, growing in the south. RSV levels are moderate and rising across all regions. Please remember that it is more important than ever to mask up, especially when you are sick. RSV has already caused an estimated 4-12,000 deaths in the US this season alone. Having a runny nose and sniffles may be mild for you, but devastating for someone else. Missed days of school or work and the consequences of missed instruction or missed income; clinic visits leading to medical debt; hospitalizations triggering deterioration of baseline health for our elderly neighbors; preventable death, and the rippling effects these losses have on families and communities. Many layers of protection, including masking, cleaning the air, and staying home when sick, help reduce the risk of spreading influenza, RSV, and SARS-CoV-2, the virus that causes COVID-19.
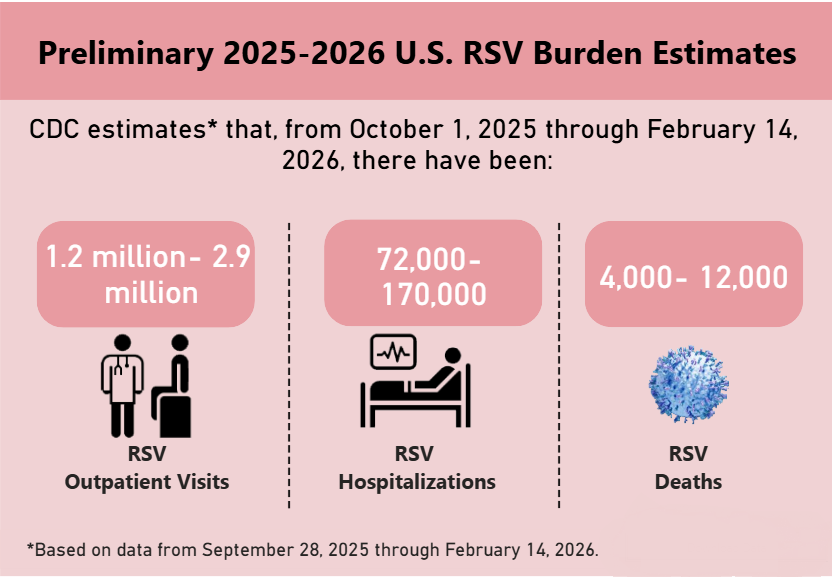
Graphic Source: CDC
Measles
Measles continues to spread in the US, with cases in South Carolina increasing to 973 since October. Last year, this country saw nearly 2,300 measles cases. Already in 2026, we’re at 982 cases. At this pace, we would surpass 2025 totals by this May.
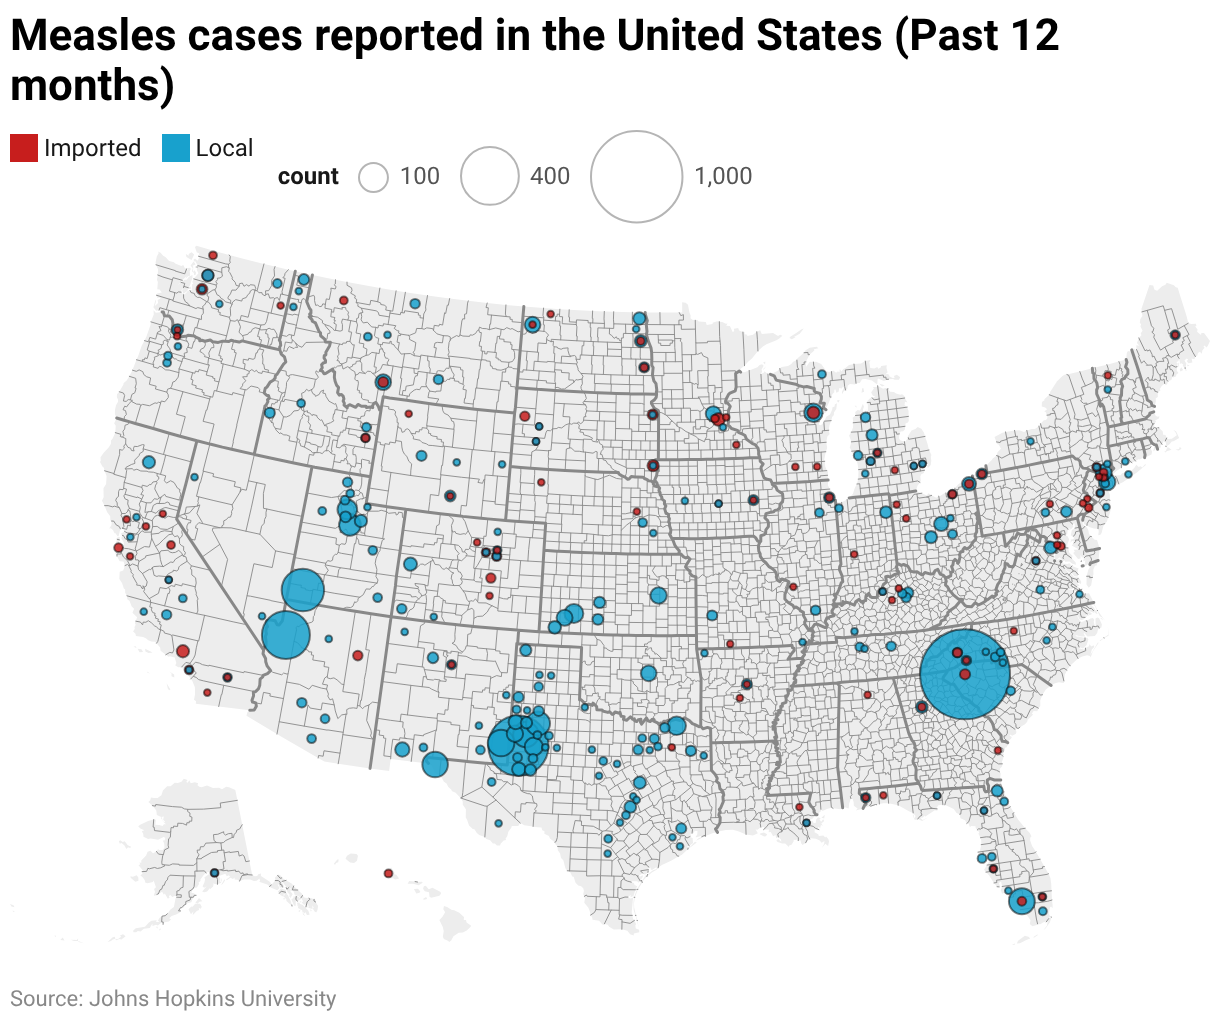
Source: International Vaccine Access Center
ACIP Update
The CDC’s Advisory Committee on Immunization Practices was supposed to meet this week, but the meeting has been delayed. The American Academy of Pediatrics filed a lawsuit to reverse the CDC’s decision to disrupt the previous childhood vaccination schedule and an injunction to prevent this month’s meeting. The CDC has not announced when the meeting will be held, reflecting the lack of accountability and transparency we’ve come to expect from this administration.
Take Action
Oppose Casey Means for Surgeon General, who is uniquely unqualified for the job. Means has questioned the childhood vaccine schedule. She also has a major financial conflict of interest through her company, which sells so-called “natural” products with the intent to oppose conventional medicine and to profit personally. Although she plans to resign from her company if confirmed as the next Surgeon General, her conspiratorial and unscientific beliefs around autism, raw milk, and birth control could cause grave harm to the public, especially as her platform and reach would expand exponentially if nominated.
Oppose ICE: A call to action for healthcare workers! Sign a national open letter to end funding for ICE violence and defend healthcare at https://tinyurl.com/HCWStopICEViolence. As healthcare workers in Minnesota face ICE brutality, call your senator to end funding for ICE violence at https://indivisible.org/actions/ice-out-senate.
Read this piece in Crimethinc to understand how Minneapolis organized against ICE and join up with ICE opposition movements in your area. If you can, find or build networks of community members engaged in rapid-response community defense, delivering groceries to folks who cannot safely leave their homes, or opposing new and existing ICE detention facilities. Please remember that each region and each network will have its own strategies. Check out our COVID Safety for Protests toolkit.
Remove RFK Jr. petition: A recent report from Protect Our Care named RFK Jr. “Public Health Enemy No 1.” We continue to call for the removal of RFK Jr., and Stand Up For Science has created its own petition to remove RFK Jr. as Secretary of Health and Human Services. We encourage you to read it and sign on.
Don’t forget to check out this week’s People’s Health Briefing with Dr. Noha Aboelata, MD, and the Roots Community Health Center team. This week’s update discusses respiratory virus updates, an overview of wastewater infrastructure, the Public Health terms “incidence” and “prevalence,” Black HIV/AIDS Awareness Day, and highlights the work of the Black medical pioneer, Nurse Ophelia Long, who helped to found Roots Community Health Center.
Notes: 1) The numbers in this report were current as of 2/22/2026. 2) Check out the links throughout & see our website for more at https://peoplescdc.org. 3) Subscribe to our newsletter: People’s CDC | Substack.
If you’re donating to us through Substack, consider getting the Substack for free (it’s not paywalled!) and donating to us directly. That way, there are fewer fees for everyone.