The Weather
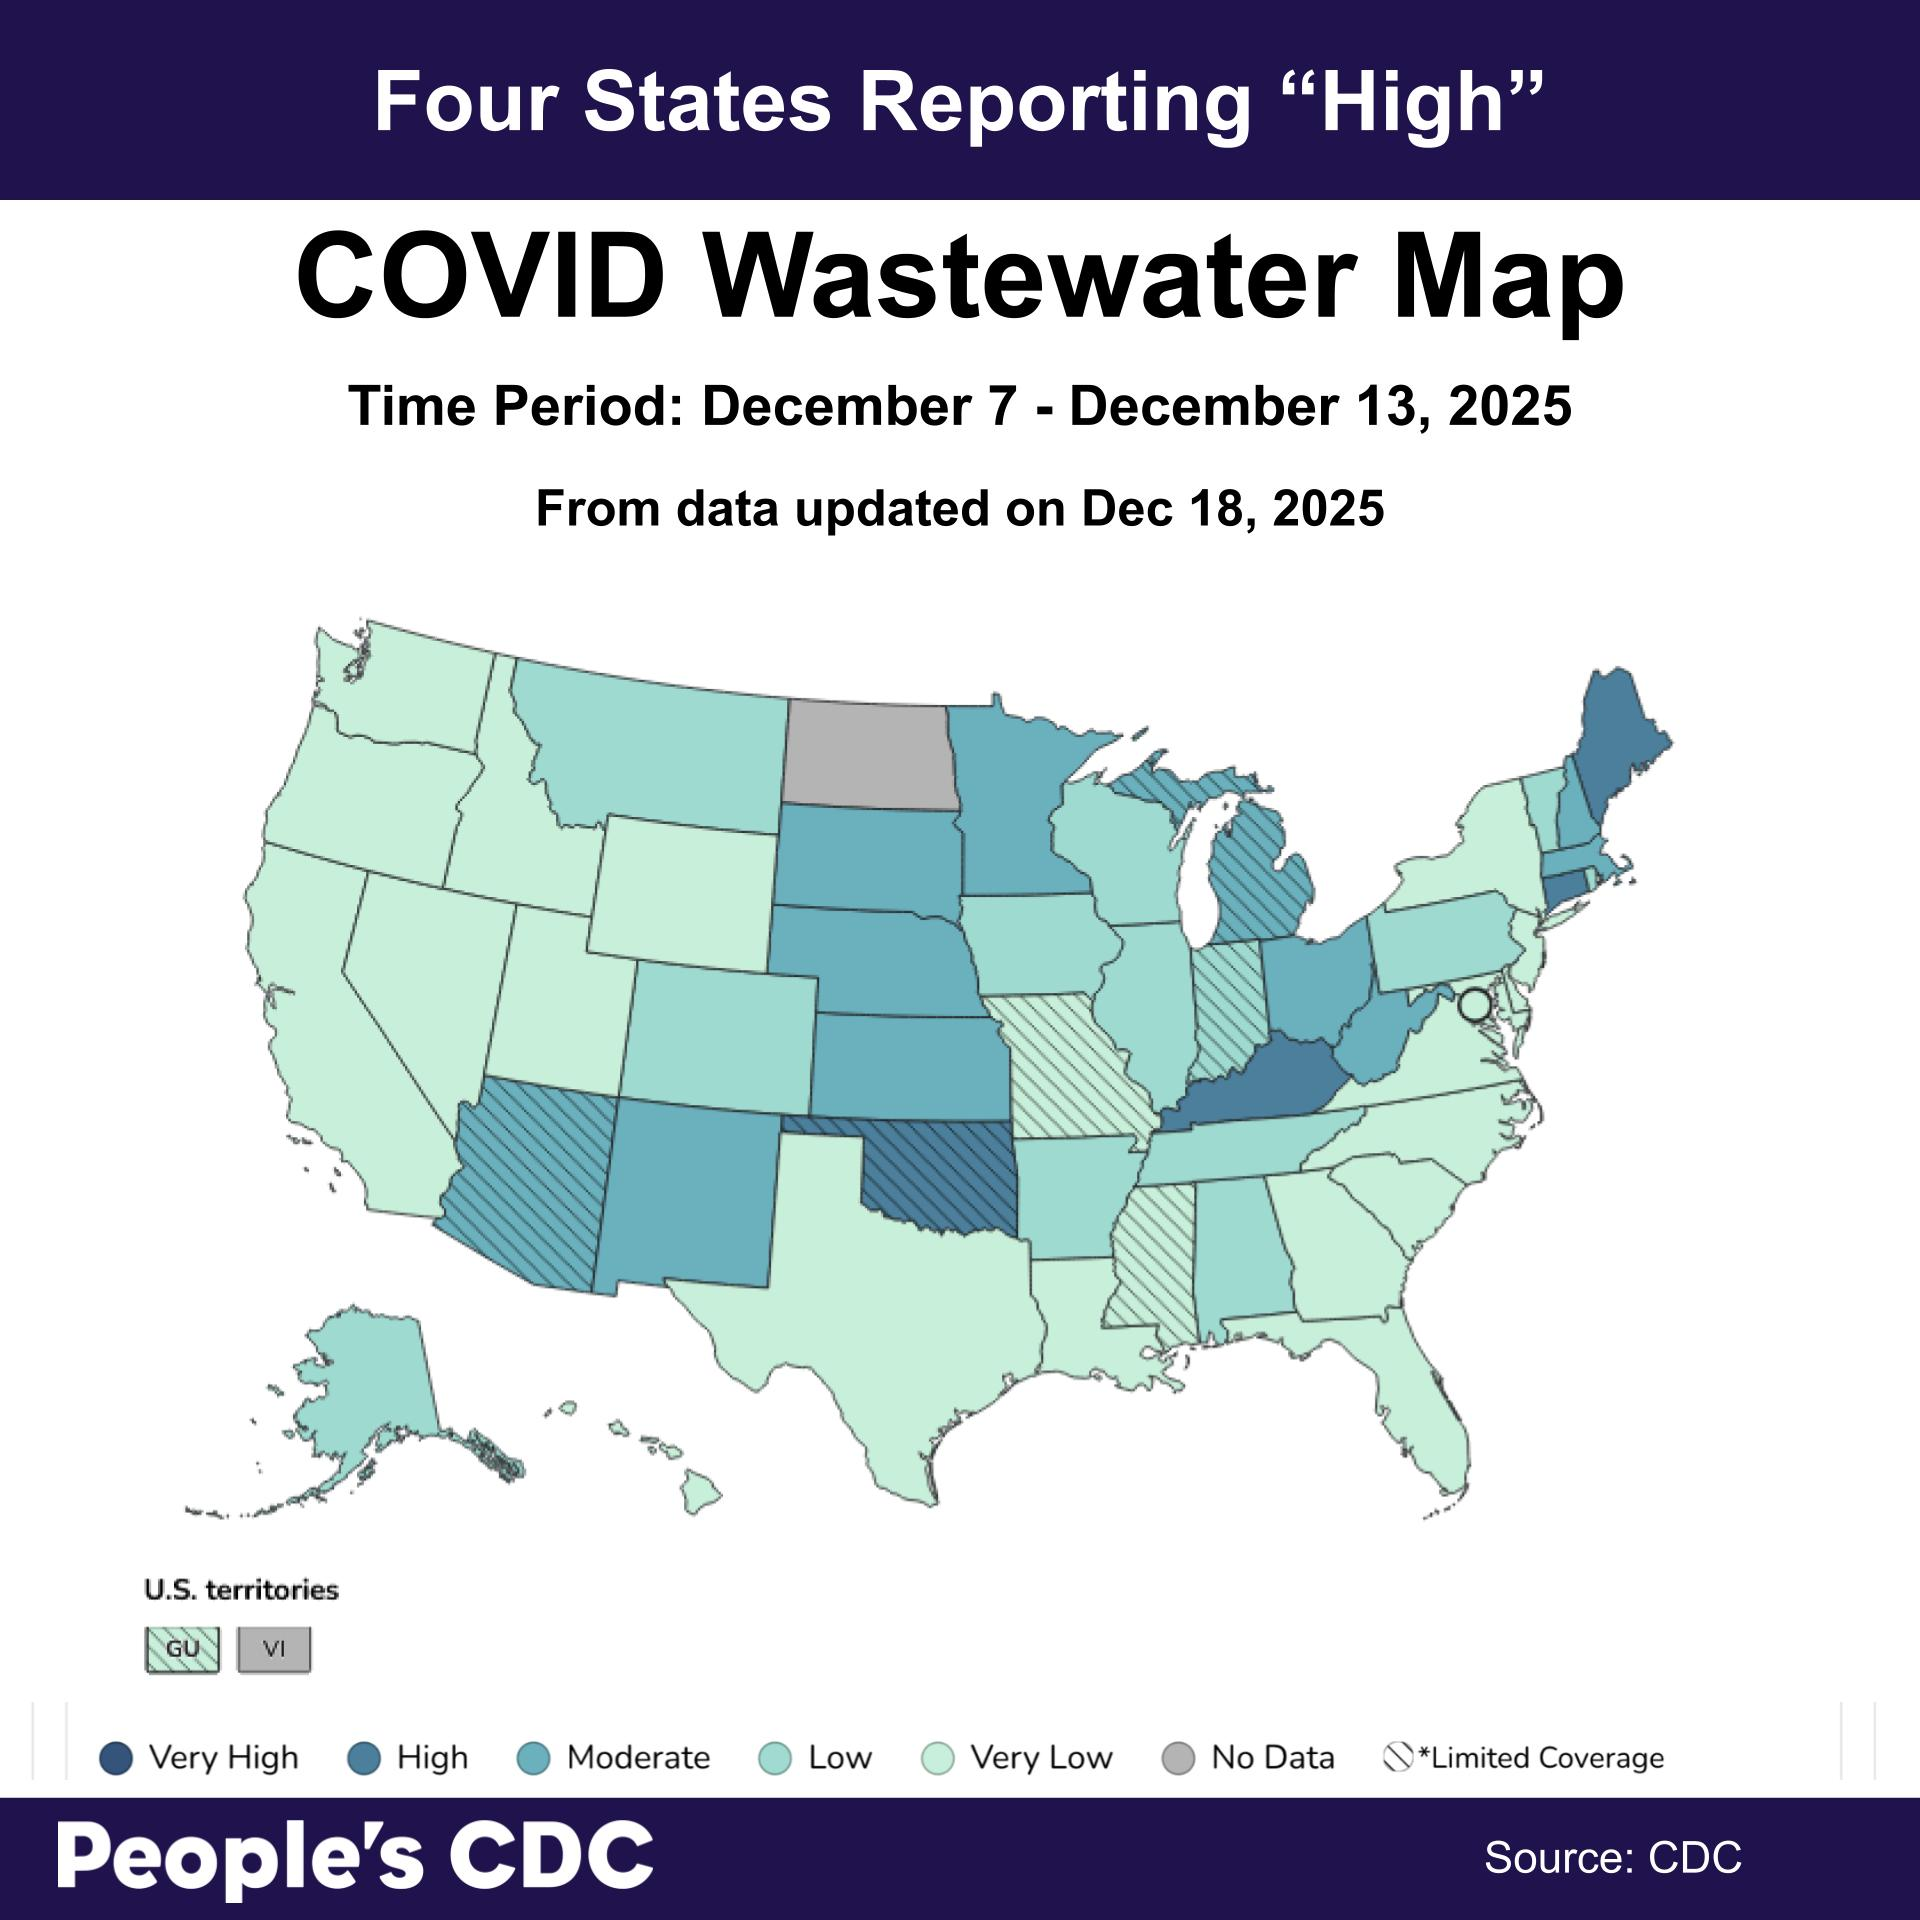
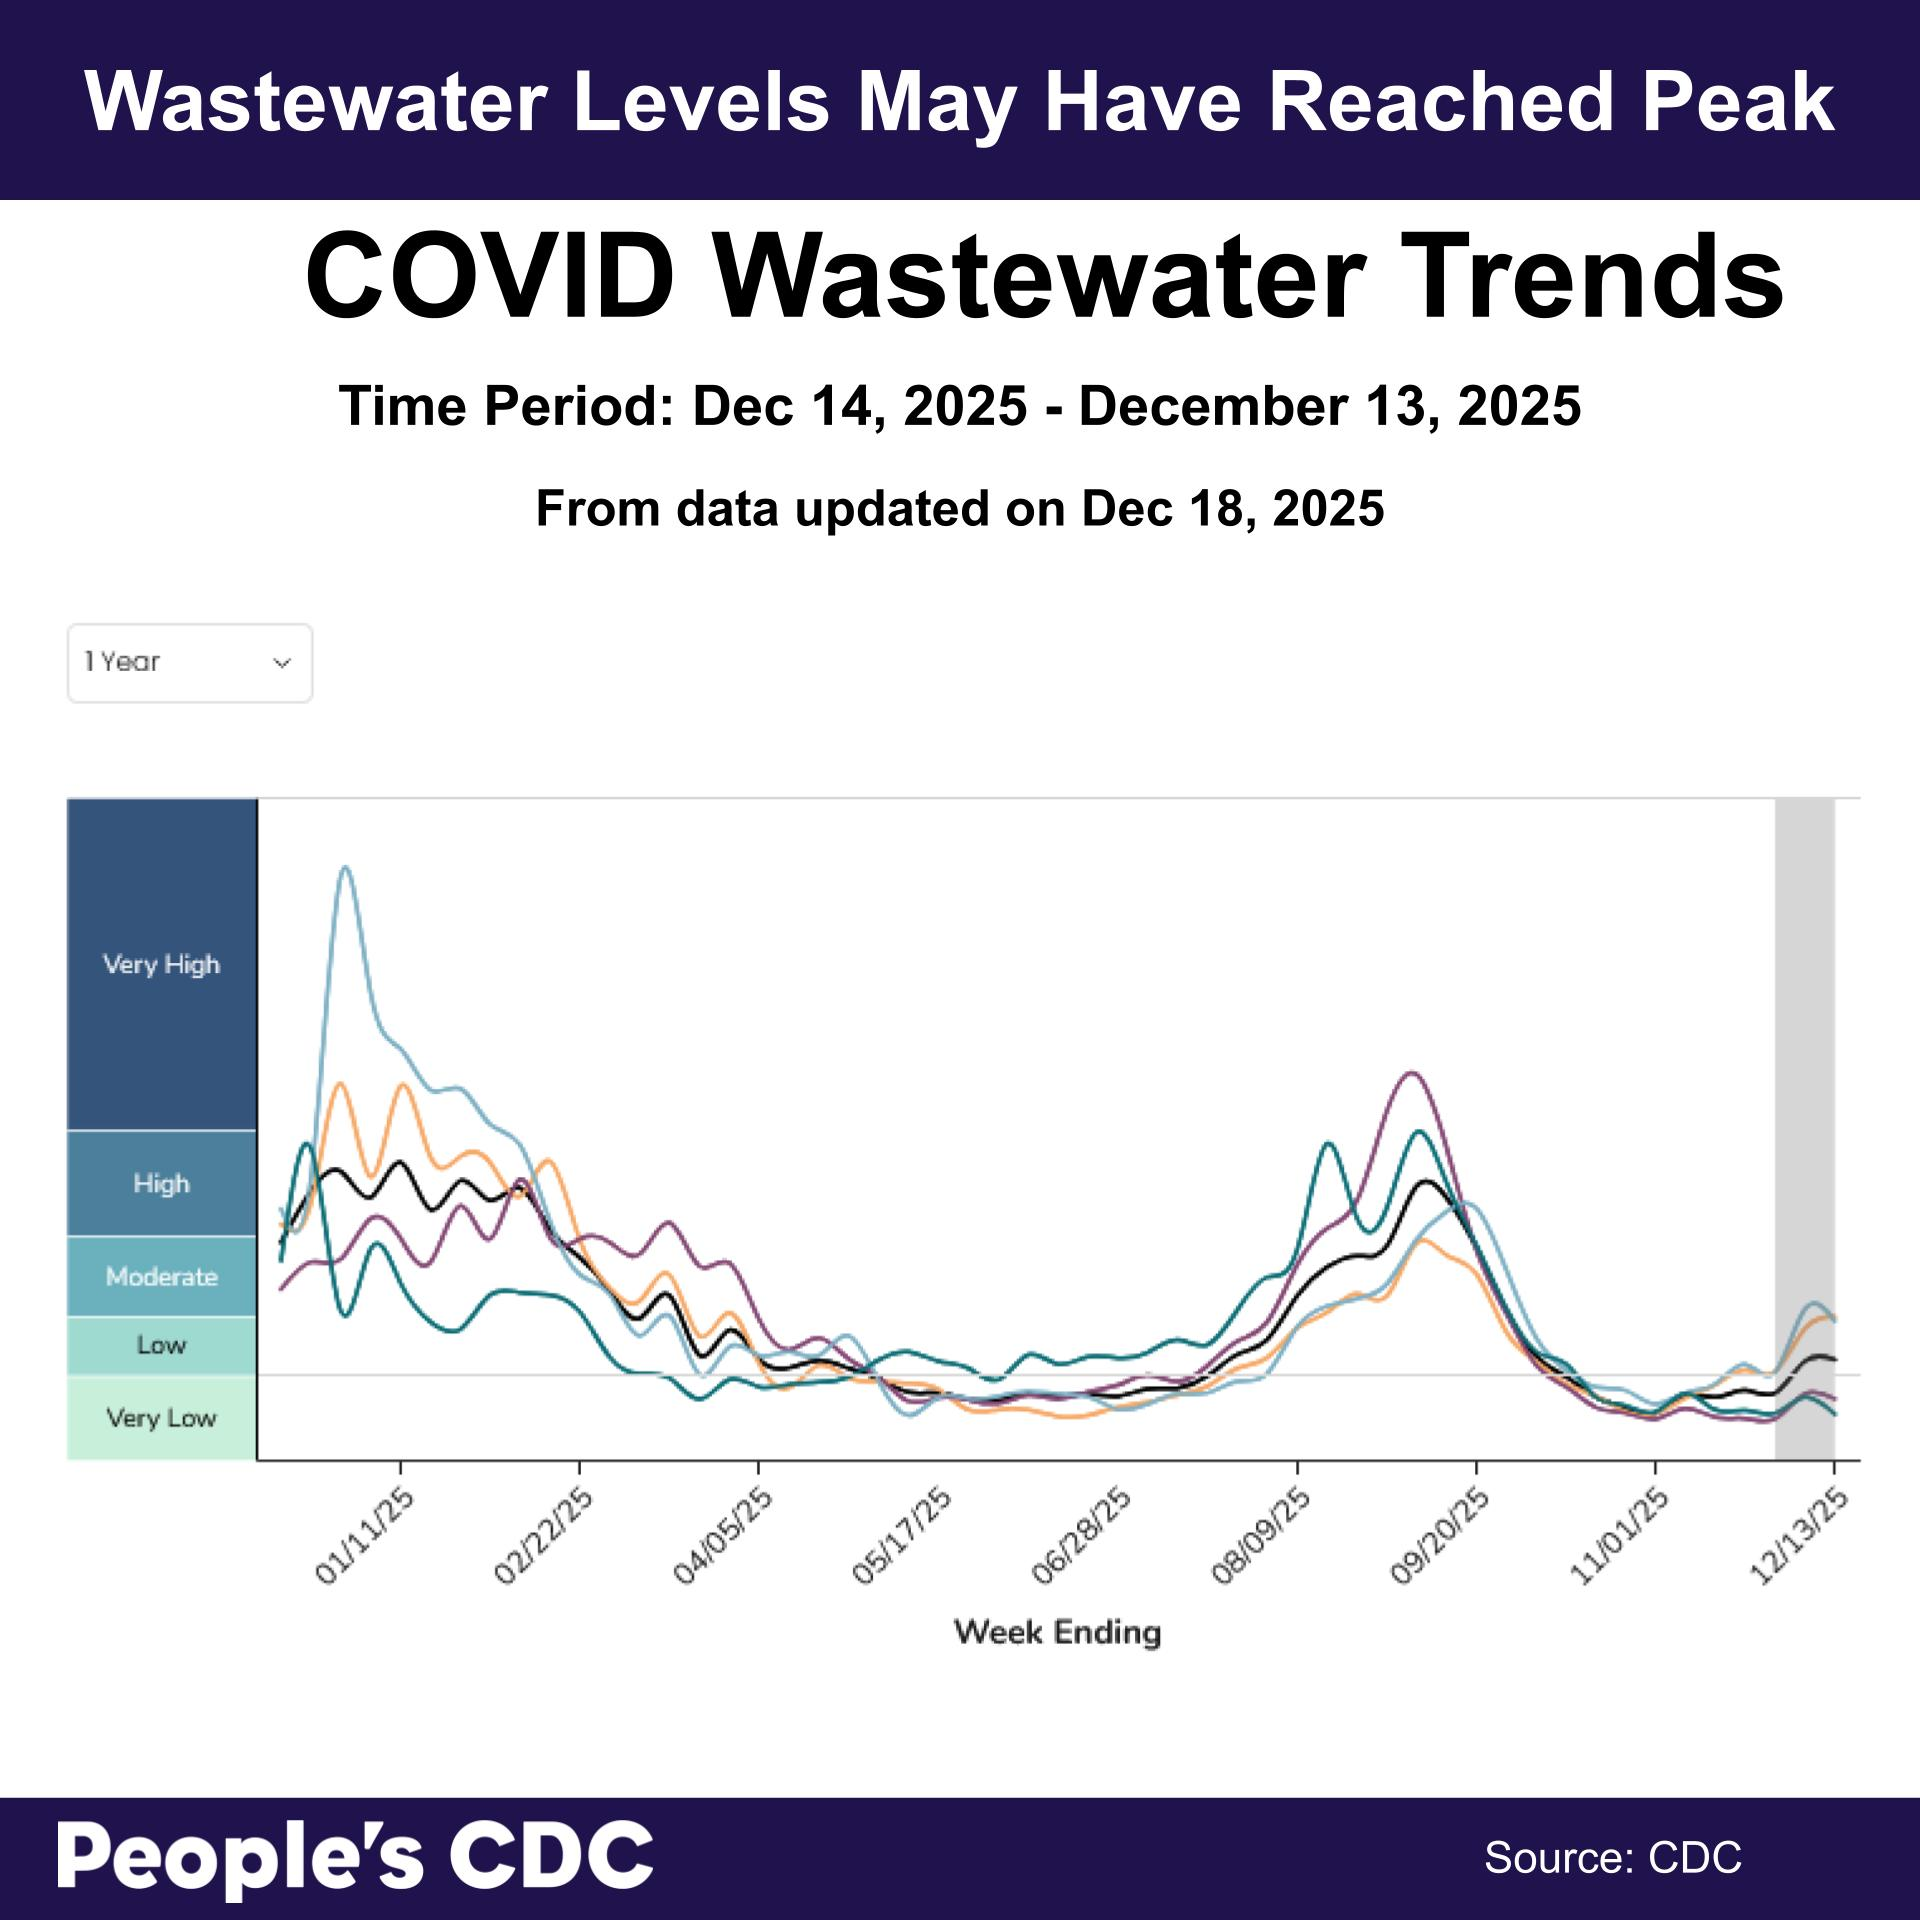
The CDC-based wastewater map was updated on December 18th, and it shows “high” levels in four states (Connecticut, Kentucky, Maine, and Oklahoma), “moderate” levels in 11 states, “low” levels in 13 states, and “very low” levels in 23 states and territories. Seven states report limited coverage: only some of the state’s wastewater centers are reporting, so the data are based on less than 5% of the population, and they may not be accurate for the entire state. There is no data for North Dakota and the Virgin Islands. Regional data indicate that all regions are seeing SARS-CoV-2 detection in wastewater reaching a potential peak and slightly dropping, except the Midwest, where it has plateaued. The Northeast, West, and South are slightly decreasing, with the Northeast and Midwest remaining at moderate levels.
Note: Our warm-tones wastewater map is currently under construction, but look for its return in the coming year.
So far during the COVID-19 pandemic, we have observed two surges in viral activity per year, one in the summer and one in the winter, typically driven by the holiday season. As temperatures in the Northern Hemisphere begin to drop and people spend more time indoors, the virus spreads more easily. Recently, we have seen an increase in viral spread.
Remember that using multiple layers of protection is the most effective way to avoid the virus. For example, at your office holiday party, you could combine ventilation, vaccination requirements, and the required use of N95/KN95/KF94 masks. Vaccination with the most updated booster is essential because it helps reduce the chances of death and hospitalization. Despite this, vaccination alone will not help avoid infection altogether. COVID is a vascular disease, and even non-severe and asymptomatic cases increase the risk for complications such as Long COVID down the line. Layers of protection are essential to protect you and the ones you love from developing chronic illness and disability.
We have created a new set of videos on Safer Holiday Gatherings that you may share with your family, friends, colleagues, or neighbors. You may find them on our Safer Gatherings Guide page. You will also find a complete list of the layers of protection available to us, along with more information on creating an accessibility policy for your next gathering.
Emergency Room Use
Another sign of the profound impact of COVID is the percentage of emergency room visits involving a new COVID diagnosis. According to the CDC, the proportion of Emergency Room visits involving a COVID diagnosis is at 0.4% as of December 9th.
Epidemiologic Trends

Variants
As of December 20, 2025, The CDC’s wastewater variant tracking shows that variant XFG, as known as “Stratus,” still makes up a majority of infections, predicted to account for over 61% down from 69% of all infections. The variant XFG is decreasing from its peak in dominance earlier this fall where it contributed to 71-74% of all US cases. XFG.14.1 is starting to gain traction and is estimated to make up 15% up from 10% of all cases. WHO has noted that current vaccines should continue to offer protection from XFG variants.
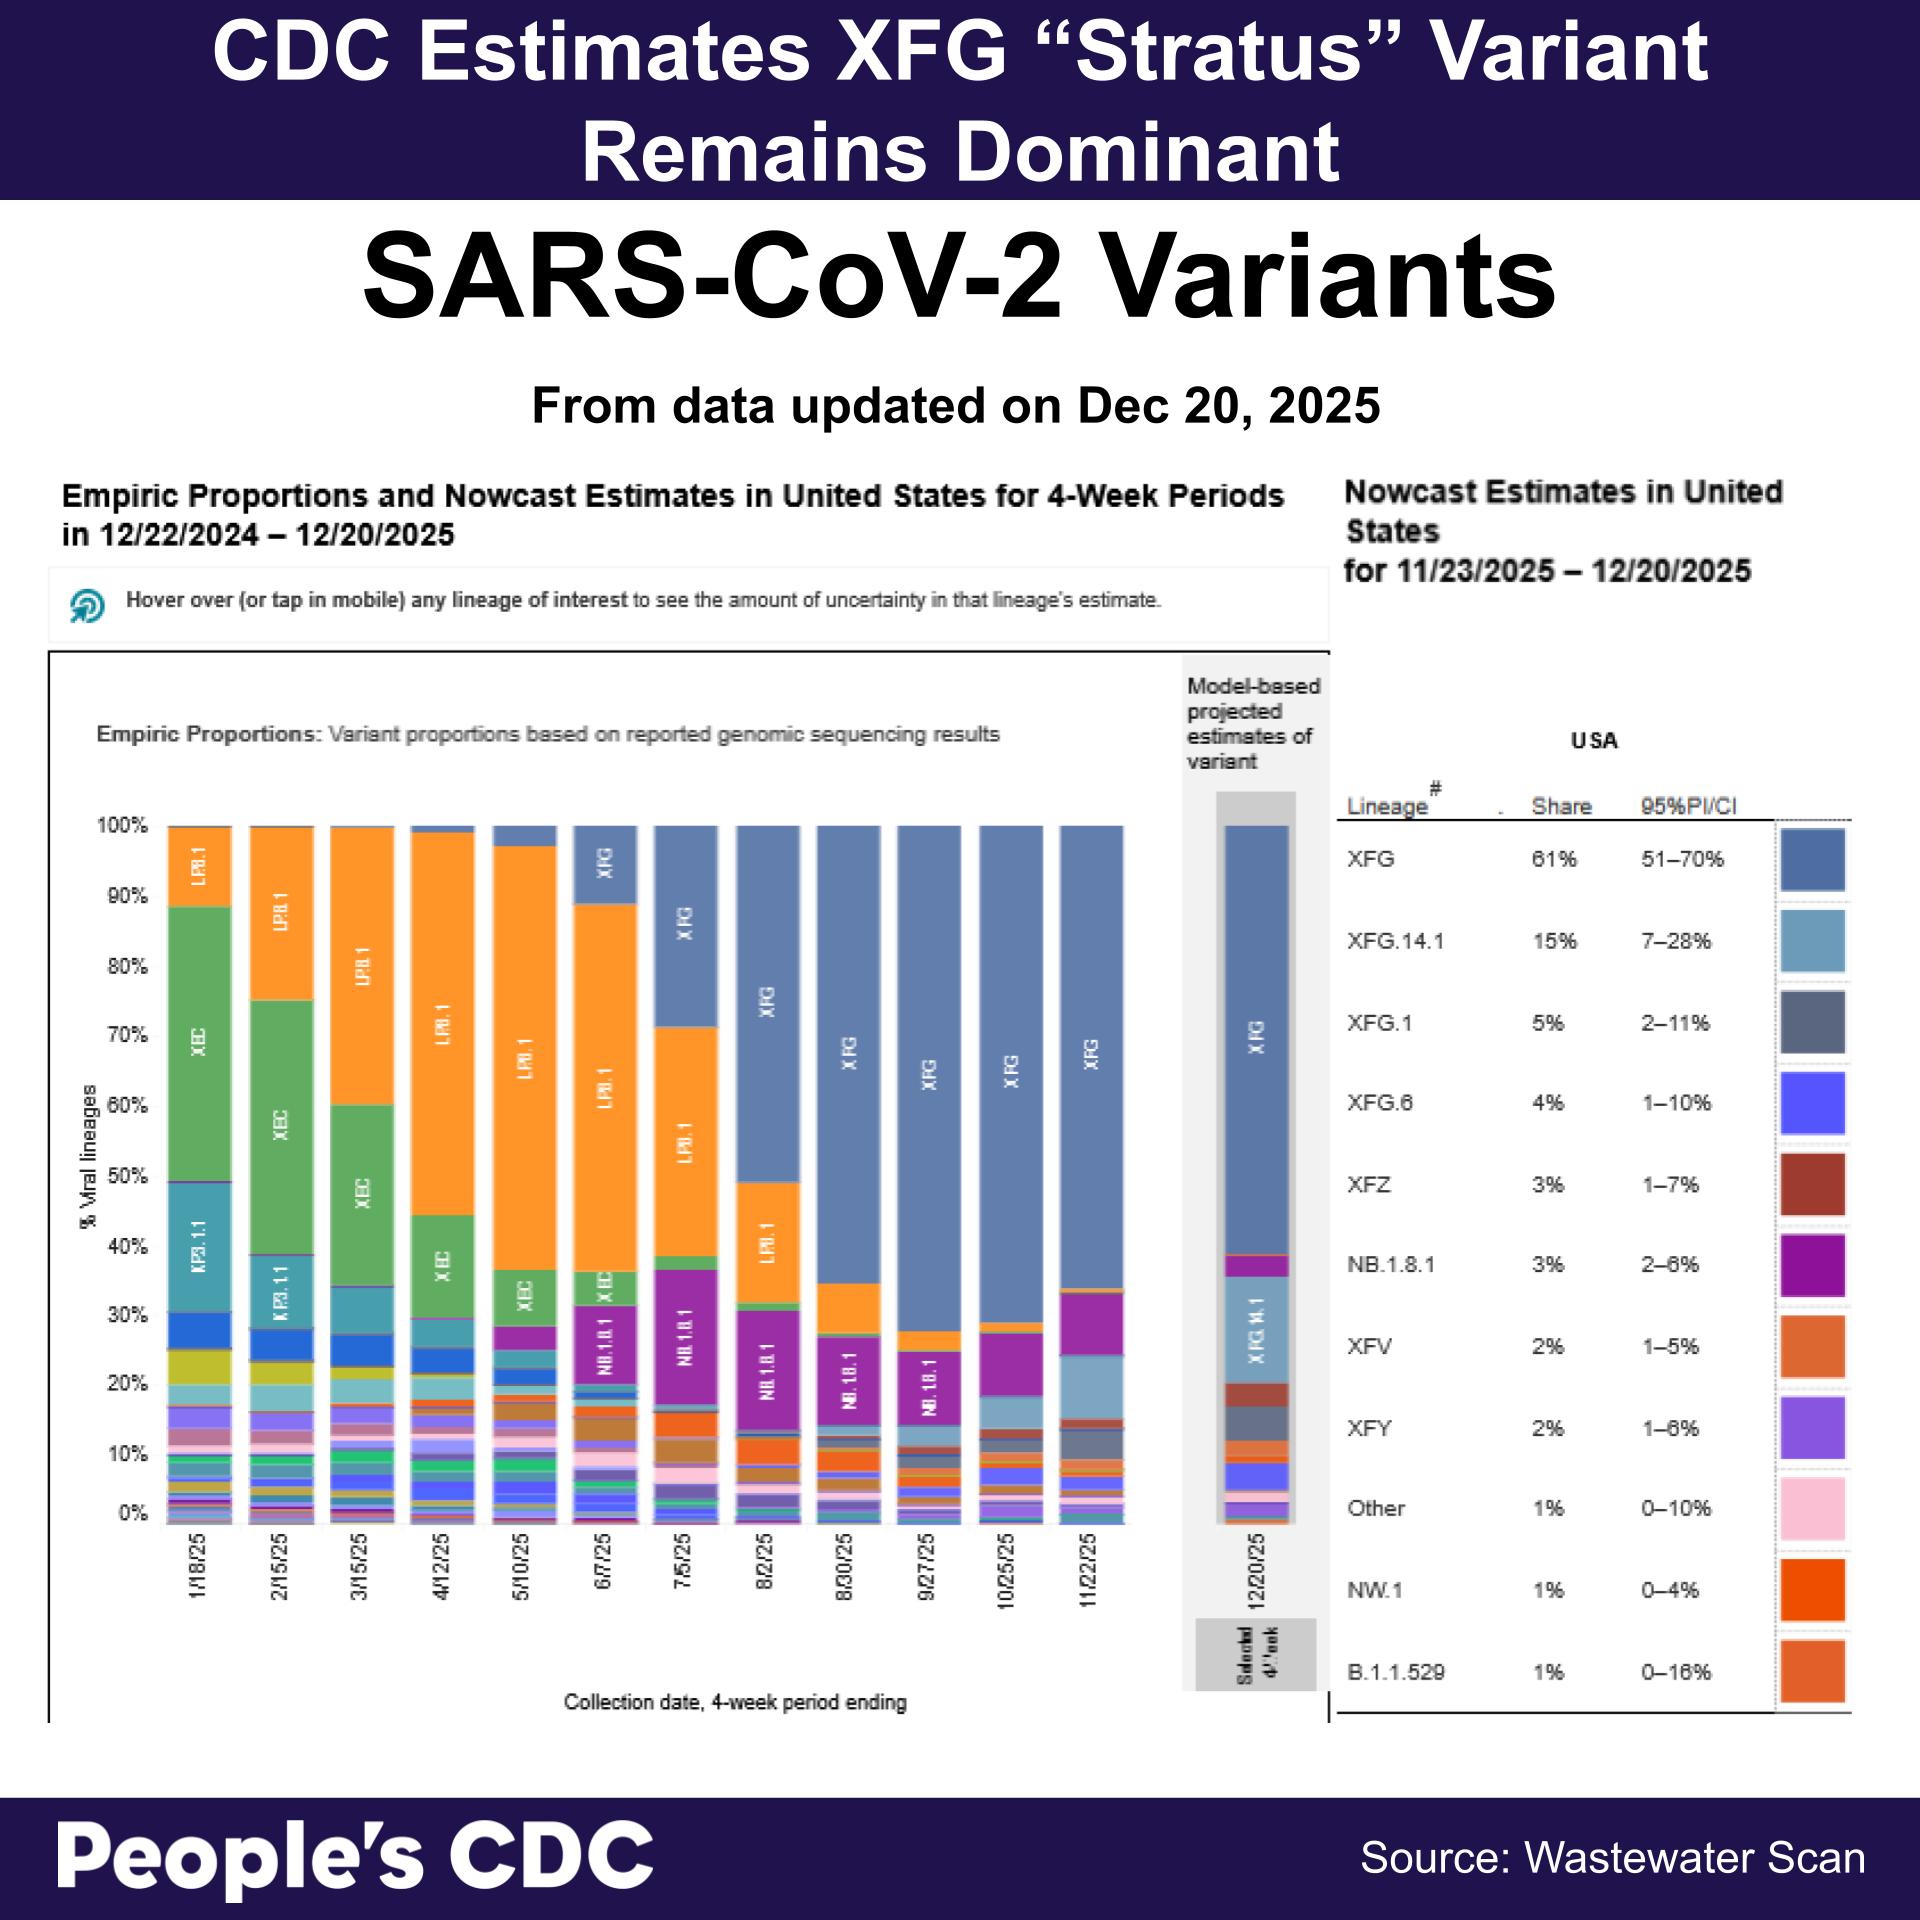
Graphic source: CDC Wastewater Variant Tracker
Vaccines
Vaccination with the most updated boosters of COVID, flu, and RSV remains safe and effective at decreasing one’s risk for death and hospitalization from these diseases. Especially during pregnancy, the medical research journal JAMA reported that COVID vaccination was associated with a lower risk of hospitalization and preterm birth. It is essential that we all stay up to date with the latest available vaccination. The CDC’s free vaccine finder tool, vaccines.gov, is broken, but many pharmacies and local health departments offer these vaccines. When you arrive at your appointment, ask the pharmacist to confirm whether your insurance will cover the full cost. If you don’t have insurance, or your insurance doesn’t cover the full cost of the updated COVID, flu, and RSV vaccinations, contact your local health department or a federally qualified health center.
Additionally, last week, the CDC’s Advisory Committee on Immunization Practices (ACIP) met and rescinded recommendations for universal Hepatitis B vaccination for newborns. We strongly condemn this decision made by numerous new members of ACIP who came into the role with preexisting anti-vax ideology. We echo the ongoing support for the original recommendations on Hepatitis B vaccination, which remains endorsed by many healthcare groups.
The CDC continues to disseminate false information on vaccines, including a recent statement on “vaccines and autism,” claiming that studies have not disproven that vaccinations among infants cause autism. In contrast, groups continue to dispute vaccines as a cause of autism, including groups such as the Autism Science Foundation who state, “no environmental factor has been better studied as a potential cause of autism than vaccines.” Learn more at the Autism Science Foundation, which shares a long list of scientific articles disproving the link between vaccines and autism.
Measles
Measles is also on the rise. Right now, we’re seeing the highest rates in the US since Measles was considered eliminated. Check out this Johns Hopkins dashboard to track ongoing outbreaks.
Take Action
Oppose the current nominee for Surgeon General! Casey Means, who holds a medical degree but did not complete medical residency, is the current nominee for surgeon general. Her nomination hearing was recently delayed. She is a health influencer on social media and has focused solely on practices dedicated to so-called “natural” products and “natural immunity,” promoting health products through her business. Follow our instructions to send a letter in opposition to her nomination by Dec 24, 2025.
Remove RFK Jr. petition: Stand Up For Science has created its own petition calling for the removal of RFK Jr. as Secretary of Health and Human Services. We encourage you to read and sign on.
With the spread of COVID, flu, RSV, and measles in the US, we need to keep ourselves and our communities safe using KF94/KN95/N95 masking and as many layers of protection as possible. Our Safer Gathering Guide provides recommendations for safer meetings and gatherings. Please continue to share it!
Notes: 1) The numbers in this report were current as of 12/20/2025. 2) Check out the links throughout & see our website for more at https://peoplescdc.org. 3) Subscribe to our newsletter: People’s CDC | Substack. If you’re donating to us through Substack, consider getting the Substack for free (it’s not paywalled!) and donating to us directly. That way, there are fewer fees for everyone.