The Weather
This has been another dangerous week for public health.
The COVID.gov and COVIDtest.gov websites have been replaced with a new government website that features misinformation, propaganda, and a bizarre headline with a picture of Trump – more fitting for a Marvel villain than a US president.
Several important CDC data sets remain intact, updated, and accessible, including data from the National Wastewater Surveillance System, COVID-NET hospitalizations, and others. But U.S. health data is still at risk or unavailable. For example, although the Behavioral Risk Factor Surveillance System website is live, some data has been removed, altered, and some has been restored, with a new label: “The CDC’s website is being modified to comply with President Trump’s Executive Orders.”
The delayed public meeting of the Advisory Committee on Immunization Practices (ACIP) was held in mid-April. This was ACIP’s first meeting with Robert F. Kennedy Jr. in charge of the Department of Health and Human Services. COVID experts discussed further reducing access to COVID-19 vaccines.
We will continue to stay alert to this administration’s misinterpretation of scientific data. We are also concerned about potential data manipulations or omissions that have previously guided disease prevention efforts.
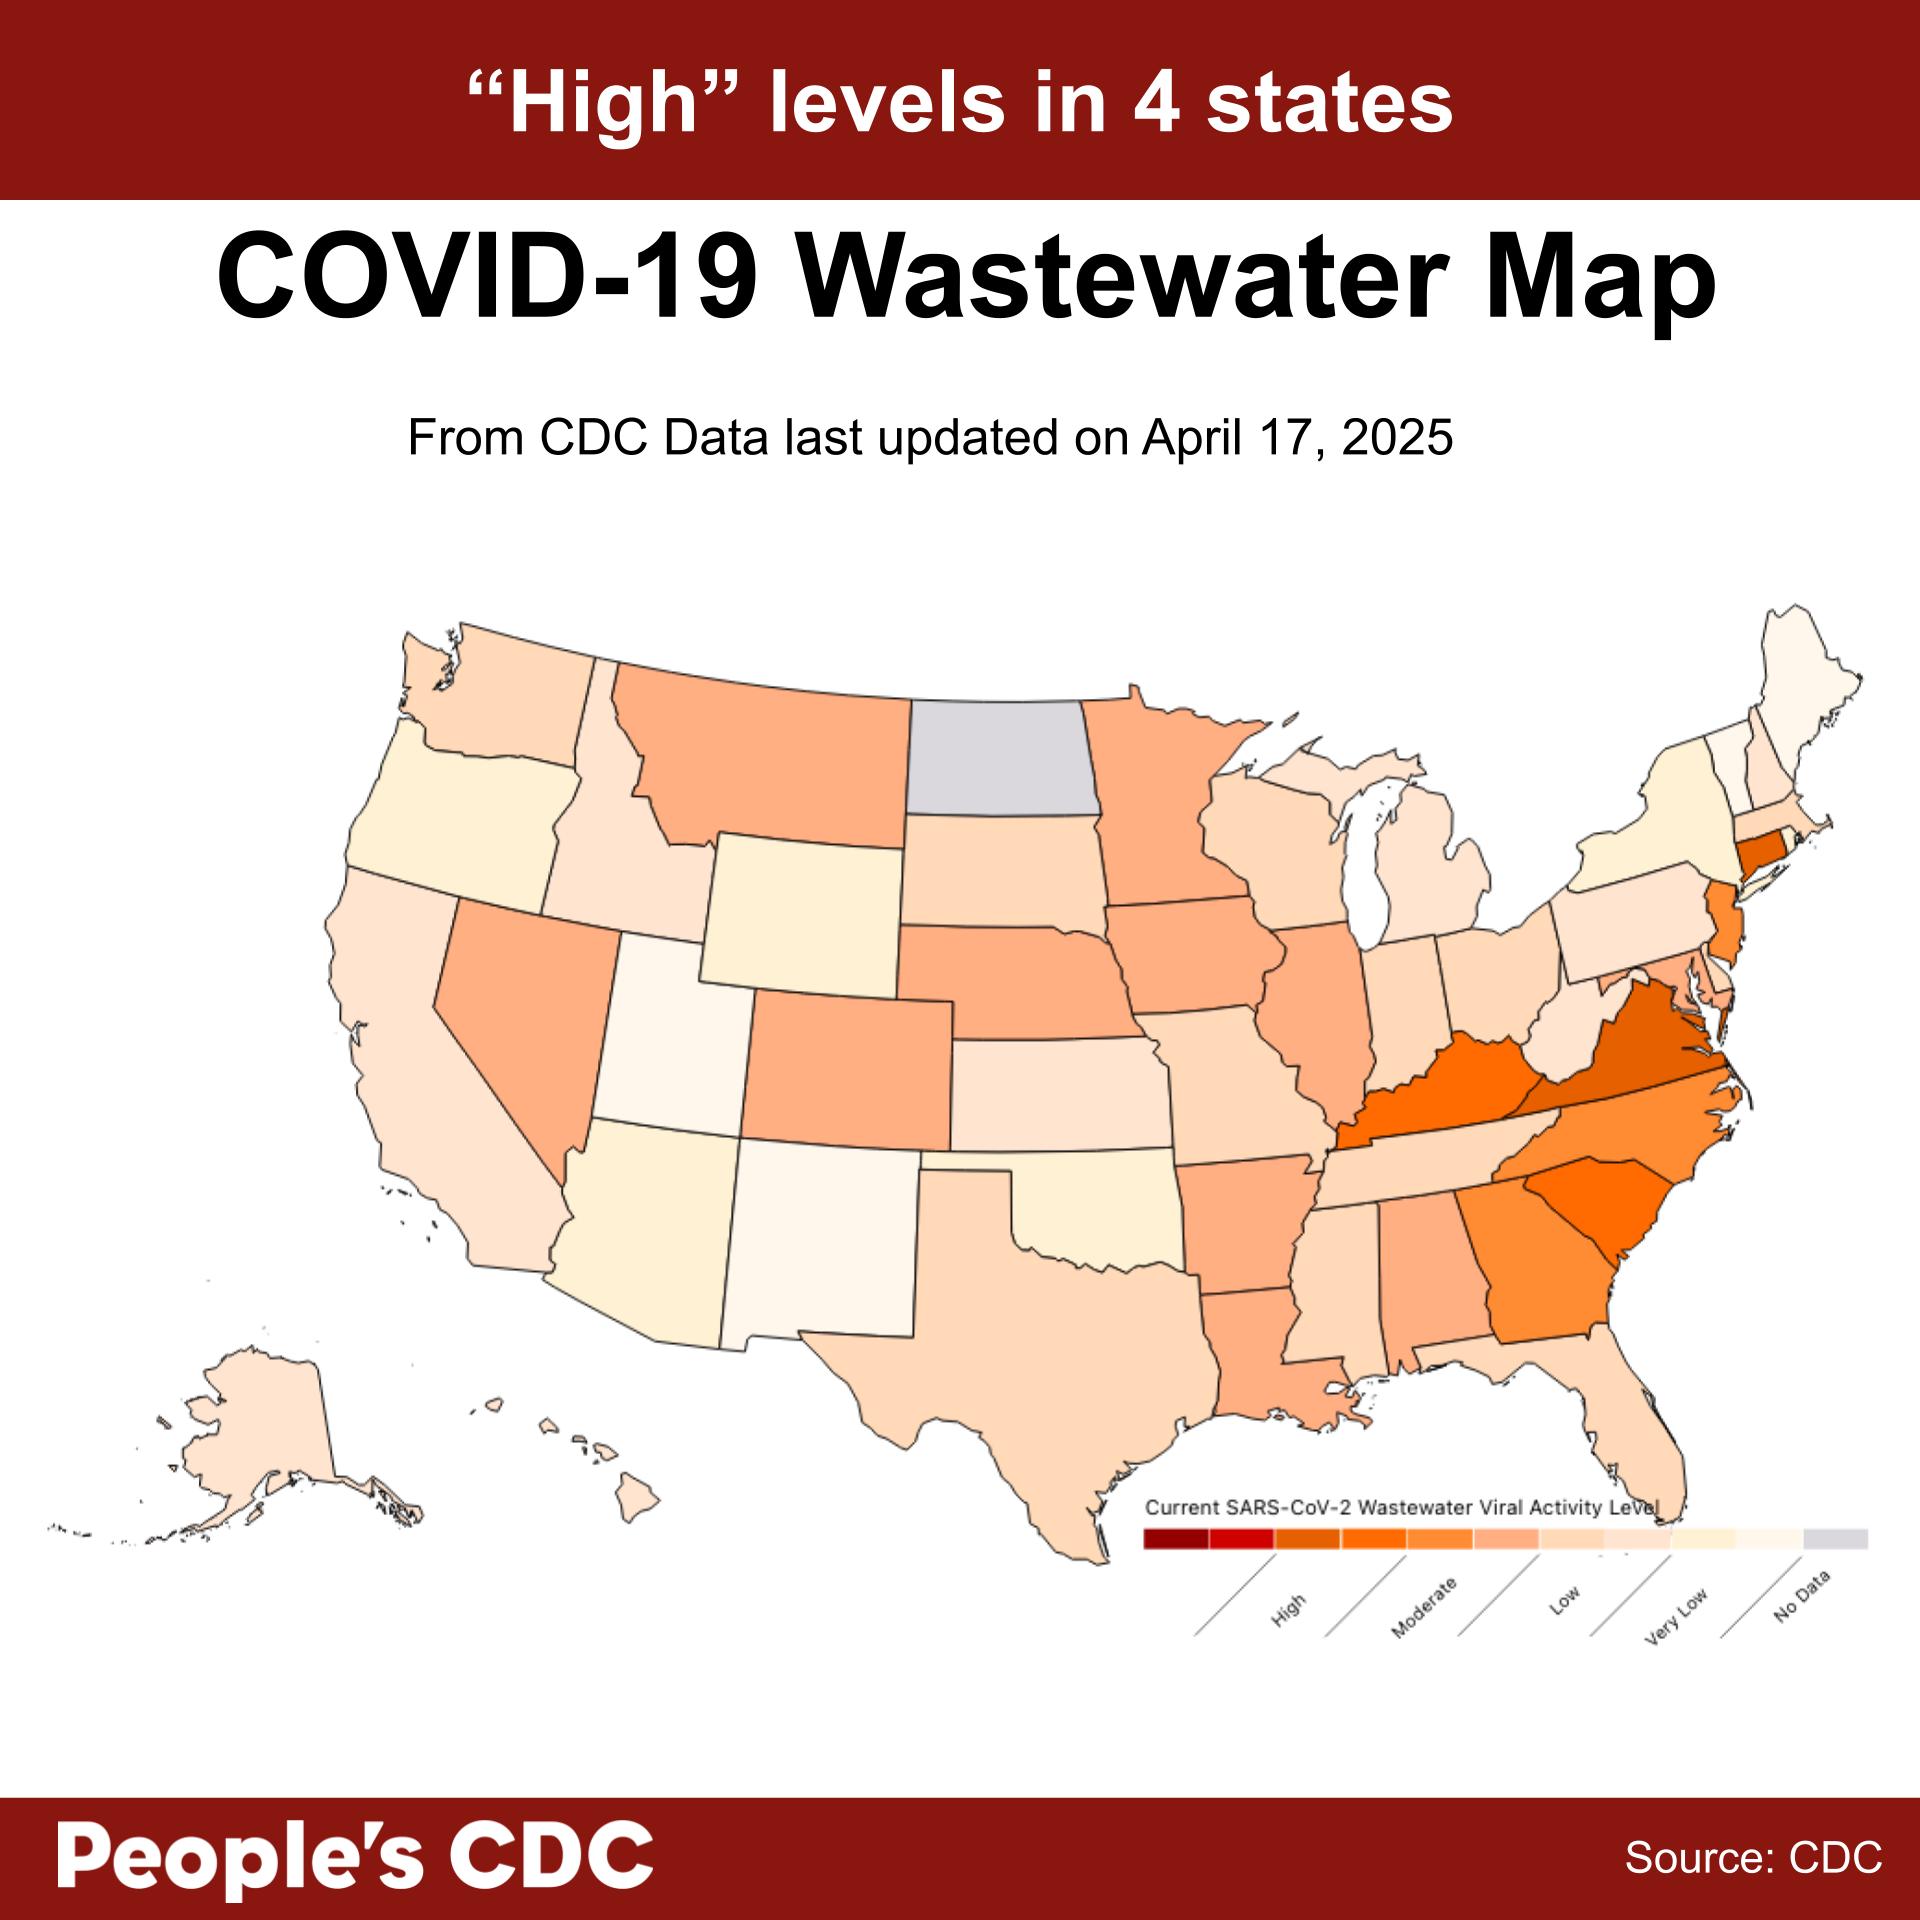
The most recent CDC national wastewater map, last updated on April 17, 2025, shows data from March 30 to April 5 of this year. Using the People’s CDC’s warm-toned version of the map, we can see that states like Connecticut, Kentucky, and South Carolina have high levels of COVID detected in wastewater. The state of Virginia also shows high levels, but these data are based on only six wastewater sites. Another four states have limited data, meaning that data from those states is based on less than 5% of the population. There is no data for North Dakota and the US Virgin Islands. The CDC has determined that national levels are “low,” with southern states still having the highest levels.
Wastewater trends indicate that nationally, the US is seeing improvement in wastewater levels. All regions in the US are seeing decreasing levels after reaching a peak in early January of 2025. We expect levels to rise again as the summer season approaches. And with CDC’s Current Epidemic Trends (Based on Rt) for States | CFA: Modeling and Forecasting | CDC, we see that COVID is likely increasing in Minnesota and Hawaii.
Note, this modeling is with data from emergency department visits to estimate COVID transmission’s Rt , Rt is an estimate of the average number of new infections caused by each infectious person. An Rt greater than 1.0 indicates that infections are growing, while an Rt less than 1.0 indicates that they’re declining.
Wastewater COVID-19 National and Regional Trends
National Wastewater Levels are Slightly Declining
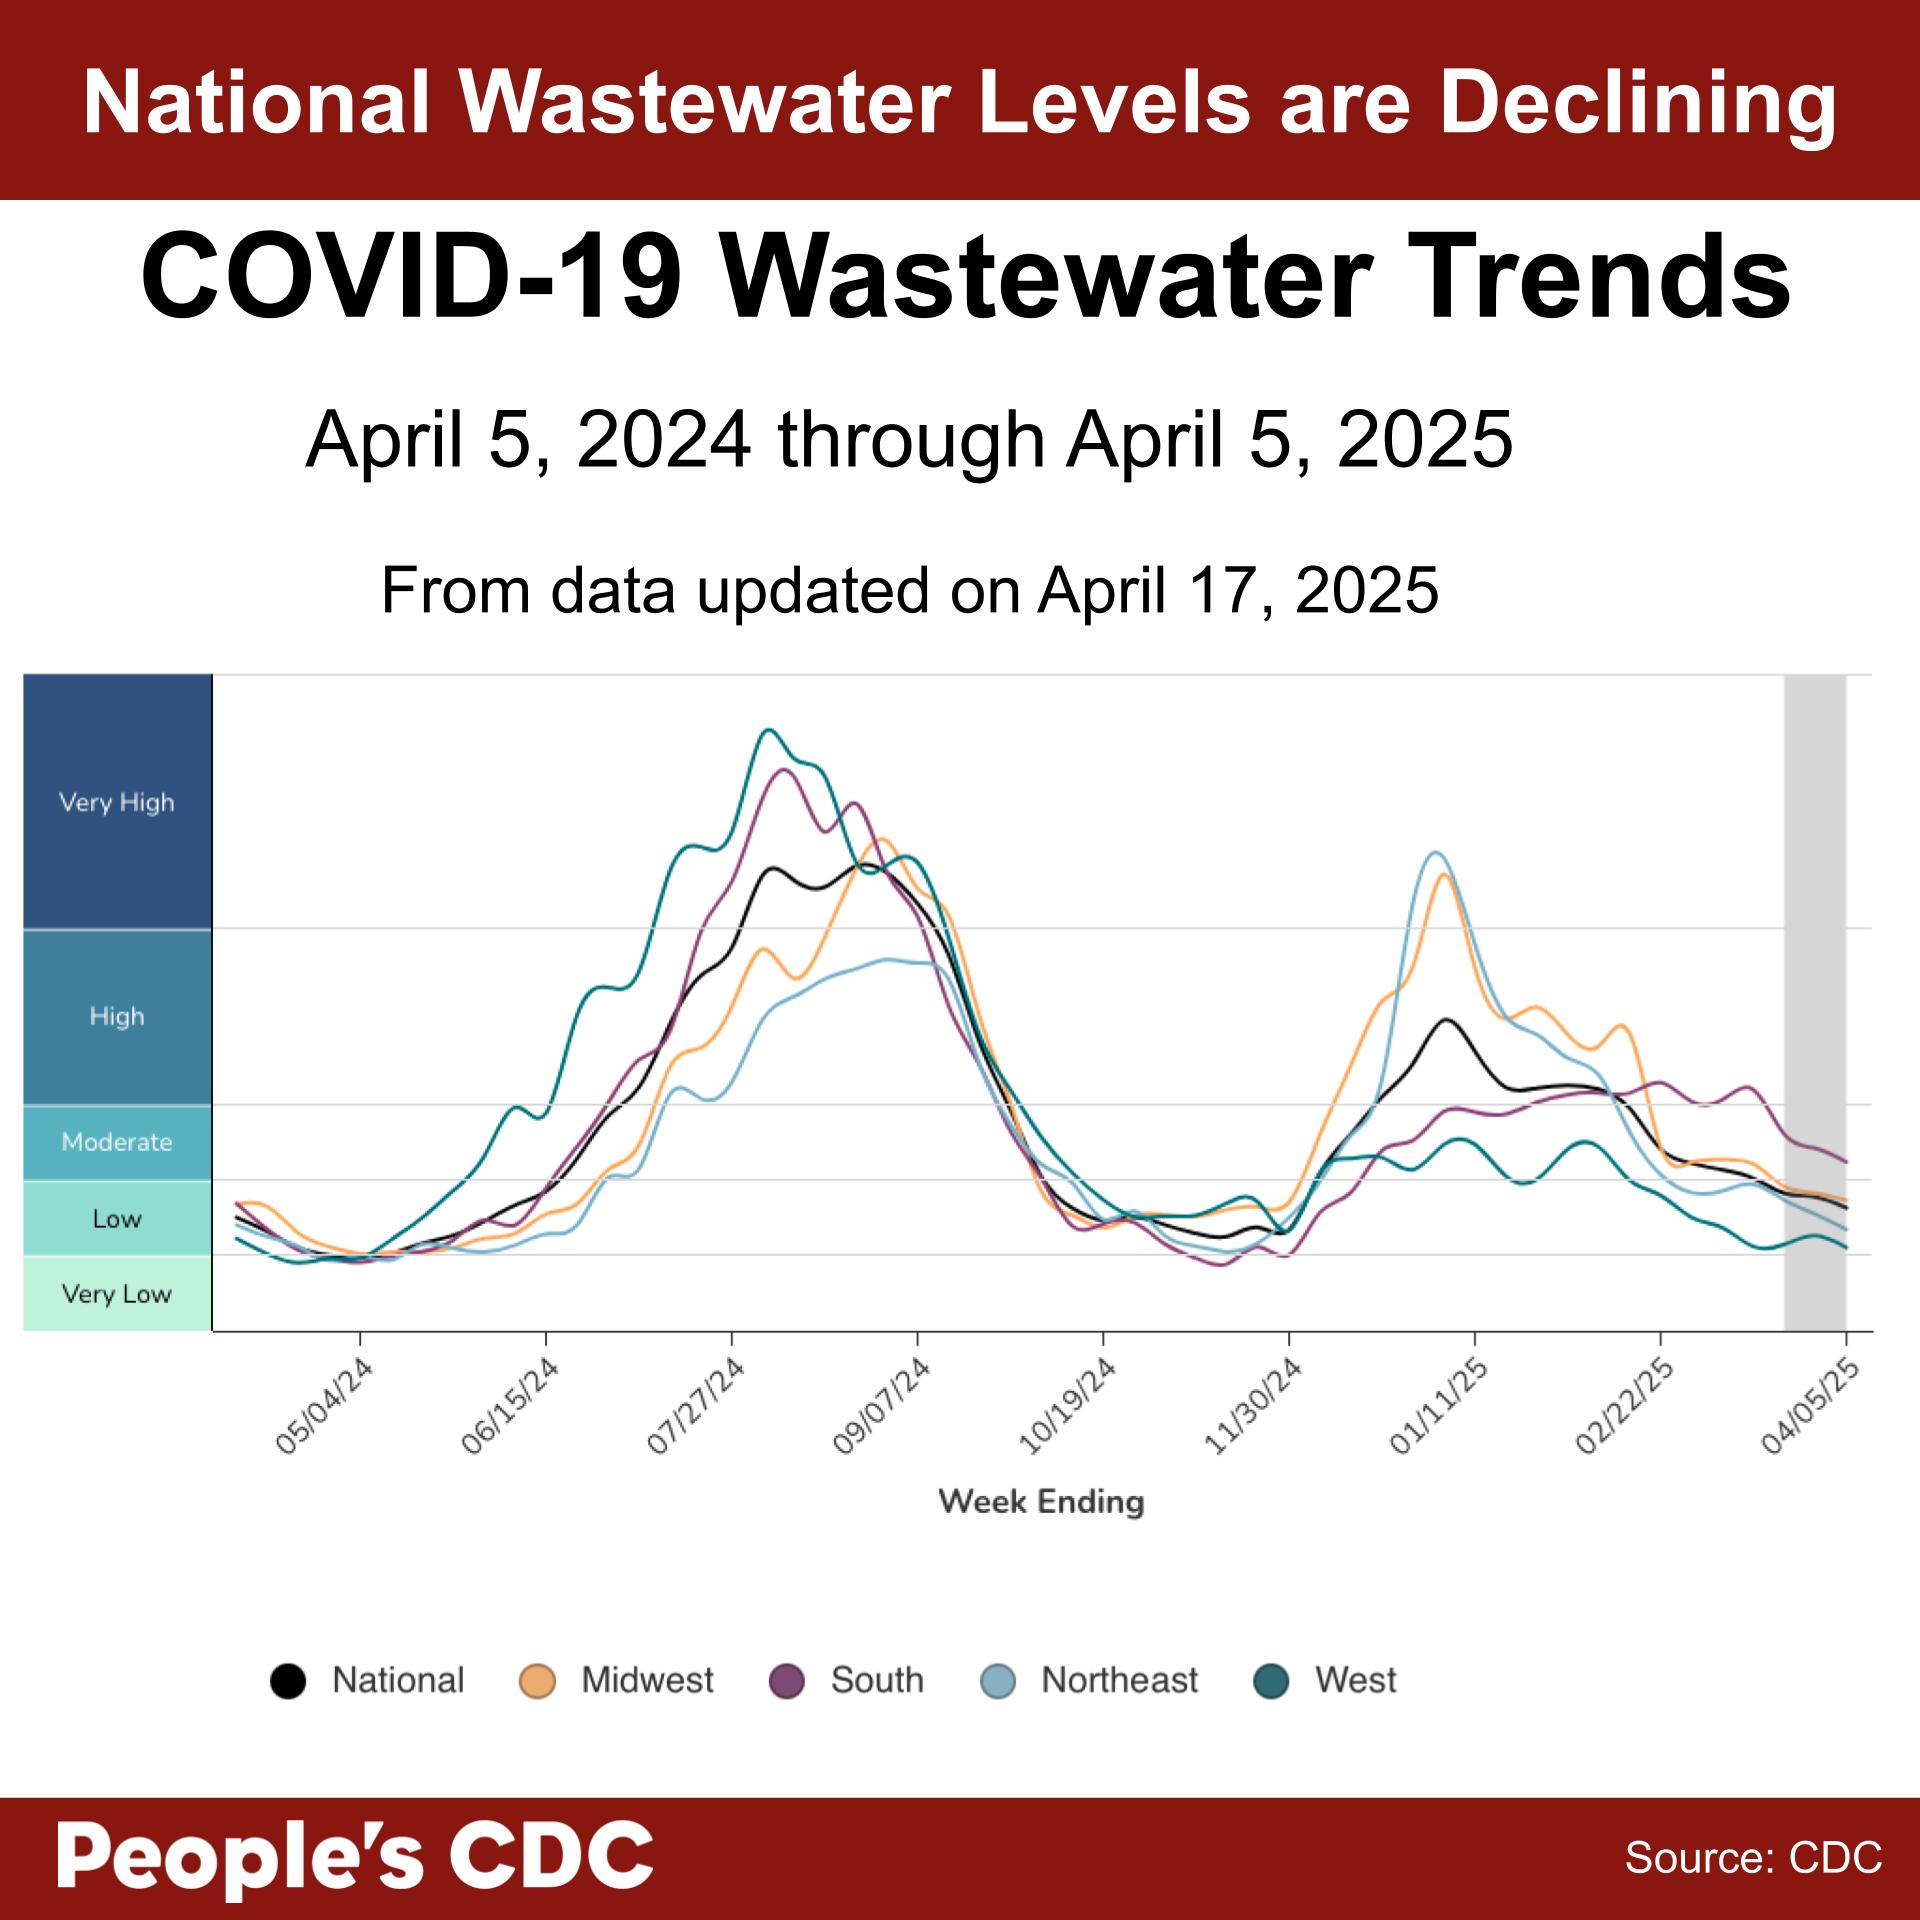
As always, remember that the determination of the categories of “Very High,” “High,” “Moderate,” “Low,” and “Very Low” is independent of any relationship to community transmission. In other words, these categories do not necessarily reflect one’s risk of getting sick within each region at any given time. Wastewater data is best suited to reveal whether levels in your area are increasing or decreasing, or how levels in your area compare with other times throughout the pandemic.
Wastewater monitoring is one of our most essential tools for monitoring communities’ health risks. We are concerned that funding may be vulnerable. While the need is high for even more wastewater monitoring, our current systems are threatened with funding cuts. We are closely watching California’s Wastewater Surveillance legislation, which could be a model for other states to better coordinate and protect this essential activity. It’s important to note that some wastewater sites have high and very high levels of activity. Please check the viral activity levels for your region by selecting your state here.
If county-level wastewater data is not available in your area, call your governor, state senators, and assembly to ask for it! The website ROADMAP for seeking government funding for enhancements related to wastewater surveillance has a list of government funding options for State, local, tribal, territorial governments, and non-profit organizations.
Hospitalizations
Hospitalization data were also reviewed during the ACIP meeting. The data source, COVID-NET, is the CDC’s surveillance system for laboratory-confirmed COVID-19 hospitalizations. The current network covers approximately 34 million people or 10% of the U.S. population.
The data show hospitalizations continue to peak in both winter and summer months, and there were fewer COVID hospitalizations this year compared to the 2023-2024 season. Yet for adults aged 65 years and older, hospitalizations for COVID were higher than hospitalizations for flu.
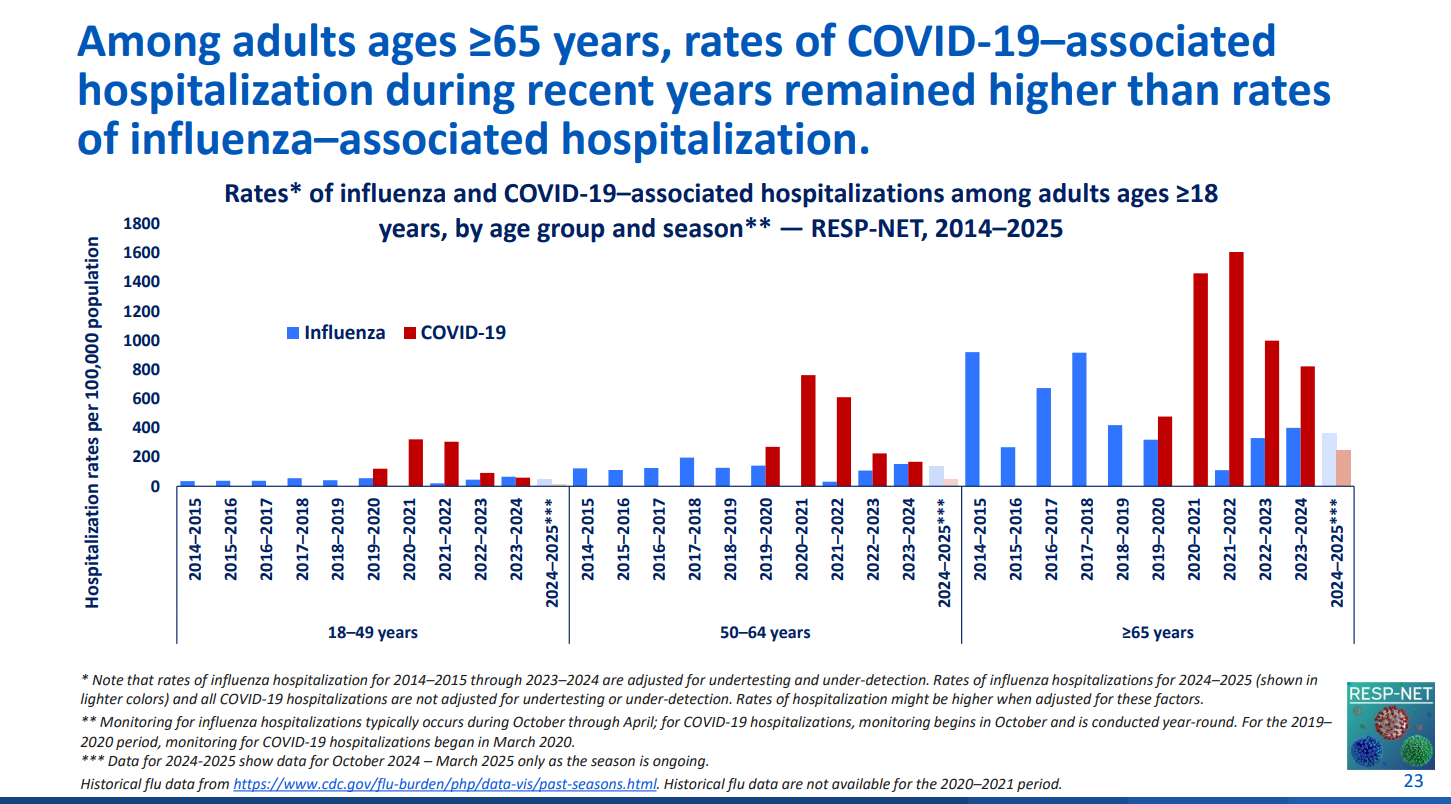 Graphic source: CDC’s ACIP presentation slides
Below, we give a brief summary of important takeaways from the slides from the CDC’s ACIP presentation about hospitalizations for COVID:
- Most adults hospitalized for COVID last year had not been vaccinated since 2022. – Slide #26
- Most (nearly 75%) of adults at least 65 years of age who were hospitalized with COVID had not received the recommended COVID vaccine before they were hospitalized. – Slide #28:
- Only 30% of nursing home residents had received a COVID vaccine that year. – Slide #27
The People’s CDC believes these data show a high need to do better in protecting our elders with vaccine access, rather than reducing access to vaccines for others, as discussed at the ACIP meeting.
Data are limited to hospitalizations where COVID-19 is a likely primary reason for admission.
Vaccines
People’s CDC supports the need for continuing universal, meaning easy and free, access to COVID vaccines. This summer, ACIP will vote on recommendations, and if vaccine access in the fall is reduced further, to vaccines only for those in the highest risk categories.
For now, here are a few resources for parents from the People’s CDC:
- The Vaccines for Children program continues to cover vaccines free of charge for eligible children up to age 18.
- A collection of resources parents can access to help kids of various ages with vaccine acceptance: Vaccine Resources for Kids and Teens and Elmo Gets the COVID-19 Vaccine – Sesame Workshop/ y Elmo se vacuna contra el COVID
- A short history of school vaccine mandates in zine format.
For everyone, especially seniors, you can still get COVID vaccines from pharmacies and clinics. Enter your zip code on the Vaccines.gov website to find out where.
Wins
Universities that are threatened with withdrawal of federal funding unless they comply with the Trump administration’s demands that interfere with free speech and scientific research should follow Harvard’s example and refuse to concede to those demands: “The university will not surrender its independence or relinquish its constitutional rights.”
After three years of talks, a historic pandemic response treaty was drafted among member states of the World Health Organization (WHO). This was accomplished without US participation as Trump withdrew the US from the WHO. The treaty ensures better sharing of information, supplies, pharmaceuticals, and technology to ensure a fair and equitable distribution worldwide.
With the backdrop of Governor Hochul’s mask ban proposal, New York City is using social media to promote mask-wearing.
Take Action
Inaction is not an option while public health is under attack with the dismantling of health and medical research workforce, defunding of HHS grants and programs (including over 17,000 HIV and AIDS and 400 COVID related CDC grants), potential disastrous cuts to Medicaid, threats to universities’ federal funding affecting clinical care and research, threats to civil and constitutional rights, erasing basic human rights and dignity and loss of more safety nets.
For healthcare workers, hospital workers, and researchers:
- Sign the “Code Blue for Democracy” open letter from a growing national coalition of healthcare providers and researchers to urge hospitals and universities to defend science and democracy! Science, healthcare, and academic freedom are under attack by the Trump administration and its proxies.
- This op ed, co-authored by one of People’s CDC volunteers, has clear steps that hospitals and workers can take to create sanctuary hospitals.
- These slides from the California Collaborative for Immigrant Justice outline what to do if ICE shows up at a medical facility. Help prepare everyone in your clinic or hospital to protect the constitutional rights of your patients.
For public health workers and physicians, stay connected with these advocacy tools:
- American College of Physicians’ Legislative Action Center webpage
- American Public Health Association’s Public Health Action Alerts
For faculty:
- Create your own “Mutual Academic Defense Compact” to make sure your university is protected. For more information: Big Ten schools creating a ‘mutual defense compact’ against Trump actions
For everyone:
Continue your local and federal legislative advocacy – that and lawsuits are effective for making our voices heard.
- A reminder that although funding for telehealth services through the Centers for Medicare and Medicaid was extended through the end of September 2025, we may still lose access to telehealth services. Demand that telehealth be funded indefinitely by submitting a letter to your members of Congress (both the House and the Senate) via our Action Network or contact members of Congress using their contact information and our letter and editing it as you wish.
- Keep writing to your representatives to “prioritize public health funding in fiscal year 2026” using the American Public Health Association’s form.
- Use this toolkit from COVID Advocacy NY to oppose the proposed mask ban in New York
And, as always:
- Support your friends, neighbors, and community, especially those most at risk or marginalized, with COVID prevention and support, deportation defense and rapid response networks, LGBTQ+ resources and safe spaces, mutual aid, and keep building secure and resilient networks.
- Take care of your mental health. We love this slide deck from Decolonizing Health as an important reminder of how not to be overwhelmed, not give in to inaction, and how to maintain your agency.
On Thursday, April 24th from 11:30 am to 12:30 pm ET, join us for an important panel discussion about protecting patients from infectious disease and deportation through mask and vaccine advocacy, and collective action to get ICE out of our hospitals. Save this date and time on your calendar and register via zoom.
Other Viruses and Health Risks
Measles
The measles outbreak continues. From the CDC’s summary, there were 800 confirmed cases in 2025 as of April 18, 2025, This is nearly 200 more cases (over 30% increase) since our last Weather Report two weeks ago. The Measles Mumps and Rubella (MMR) vaccination status from these patients were: Unvaccinated or Unknown: 96%; One MMR dose: 1%; Two MMR doses: 2%.
To protect communities from measles, at least 95% of the population needs to have received the MMR vaccine. For the school year 2023 – 2024, fewer than 95% of kindergartners received an MMR vaccine.
The MMR vaccine is safe and effective, and is our most effective prevention tool. A recent Health Alert Network advisory recommends that travelers, regardless of their destination, stay up to date with the MMR vaccine. This advisory also includes additional vaccination guidance for people in outbreak areas and what to do if you suspect you have measles.
Bird Flu
Bird flu (H5N1) continues to spread among wild birds, chickens, and cows, with 31 new cases in dairy cows detected this month. There are now at least 70 known cases of humans infected with H5N1 in the U.S. There is still no known person-to-person transmission. Wastewater monitoring is crucial for understanding where bird flu is spreading. Although the FDA has increased some funding for this, it was at the expense of other fresh food access safety nets.
People’s CDC appreciates our readers! We updated our website with more subscription and donation options,
If you’re donating to us through Substack, consider getting the Substack for free (it’s not paywalled!) and donating to us directly. You can choose a one-time or recurring donation. That way, there are fewer fees between your bank account and ours!
Notes: 1) The numbers in this report were current as of 4/17/2025. 2) Check out the links throughout & see our website for more at https://peoplescdc.org. 3) Subscribe to our newsletter: People’s CDC | Substack.