Implementation of Medicaid Work Requirements
The notifications are going out as states prepare to implement changes to Medicaid coverage on January 1, 2027 in compliance with the 2025 reconciliation law or “One Big Beautiful Bill.” In response to the bill, Medicaid recipients in 44 states ages 19-64 will now be required to work a minimum of 80 hours per month at minimum wage (equivalent to an income of $580 per month) or lose access to Medicaid. There are some exemptions such as for those who are in school at least half time, seasonal workers whose average monthly income meets the minimum, those who are hospitalized or reside in a county with unemployment rate above 8%, the Indigenous American population, those released from prison in the past three months, those who aged out of foster care and are under 26 years old, disabled veterans, or those who are “medically frail.” Those who complete 80 hours per month of work or community service may also qualify. There are concerns that some people who are working but who are also facing work instability due to losing their jobs or mental health causes will face worse outcomes as their situations will not qualify for exemption and they will lose coverage. Losing healthcare will only exacerbate the conditions which make it difficult for them to find stable work, creating the effect of kicking people when they are already down or experiencing hardship.
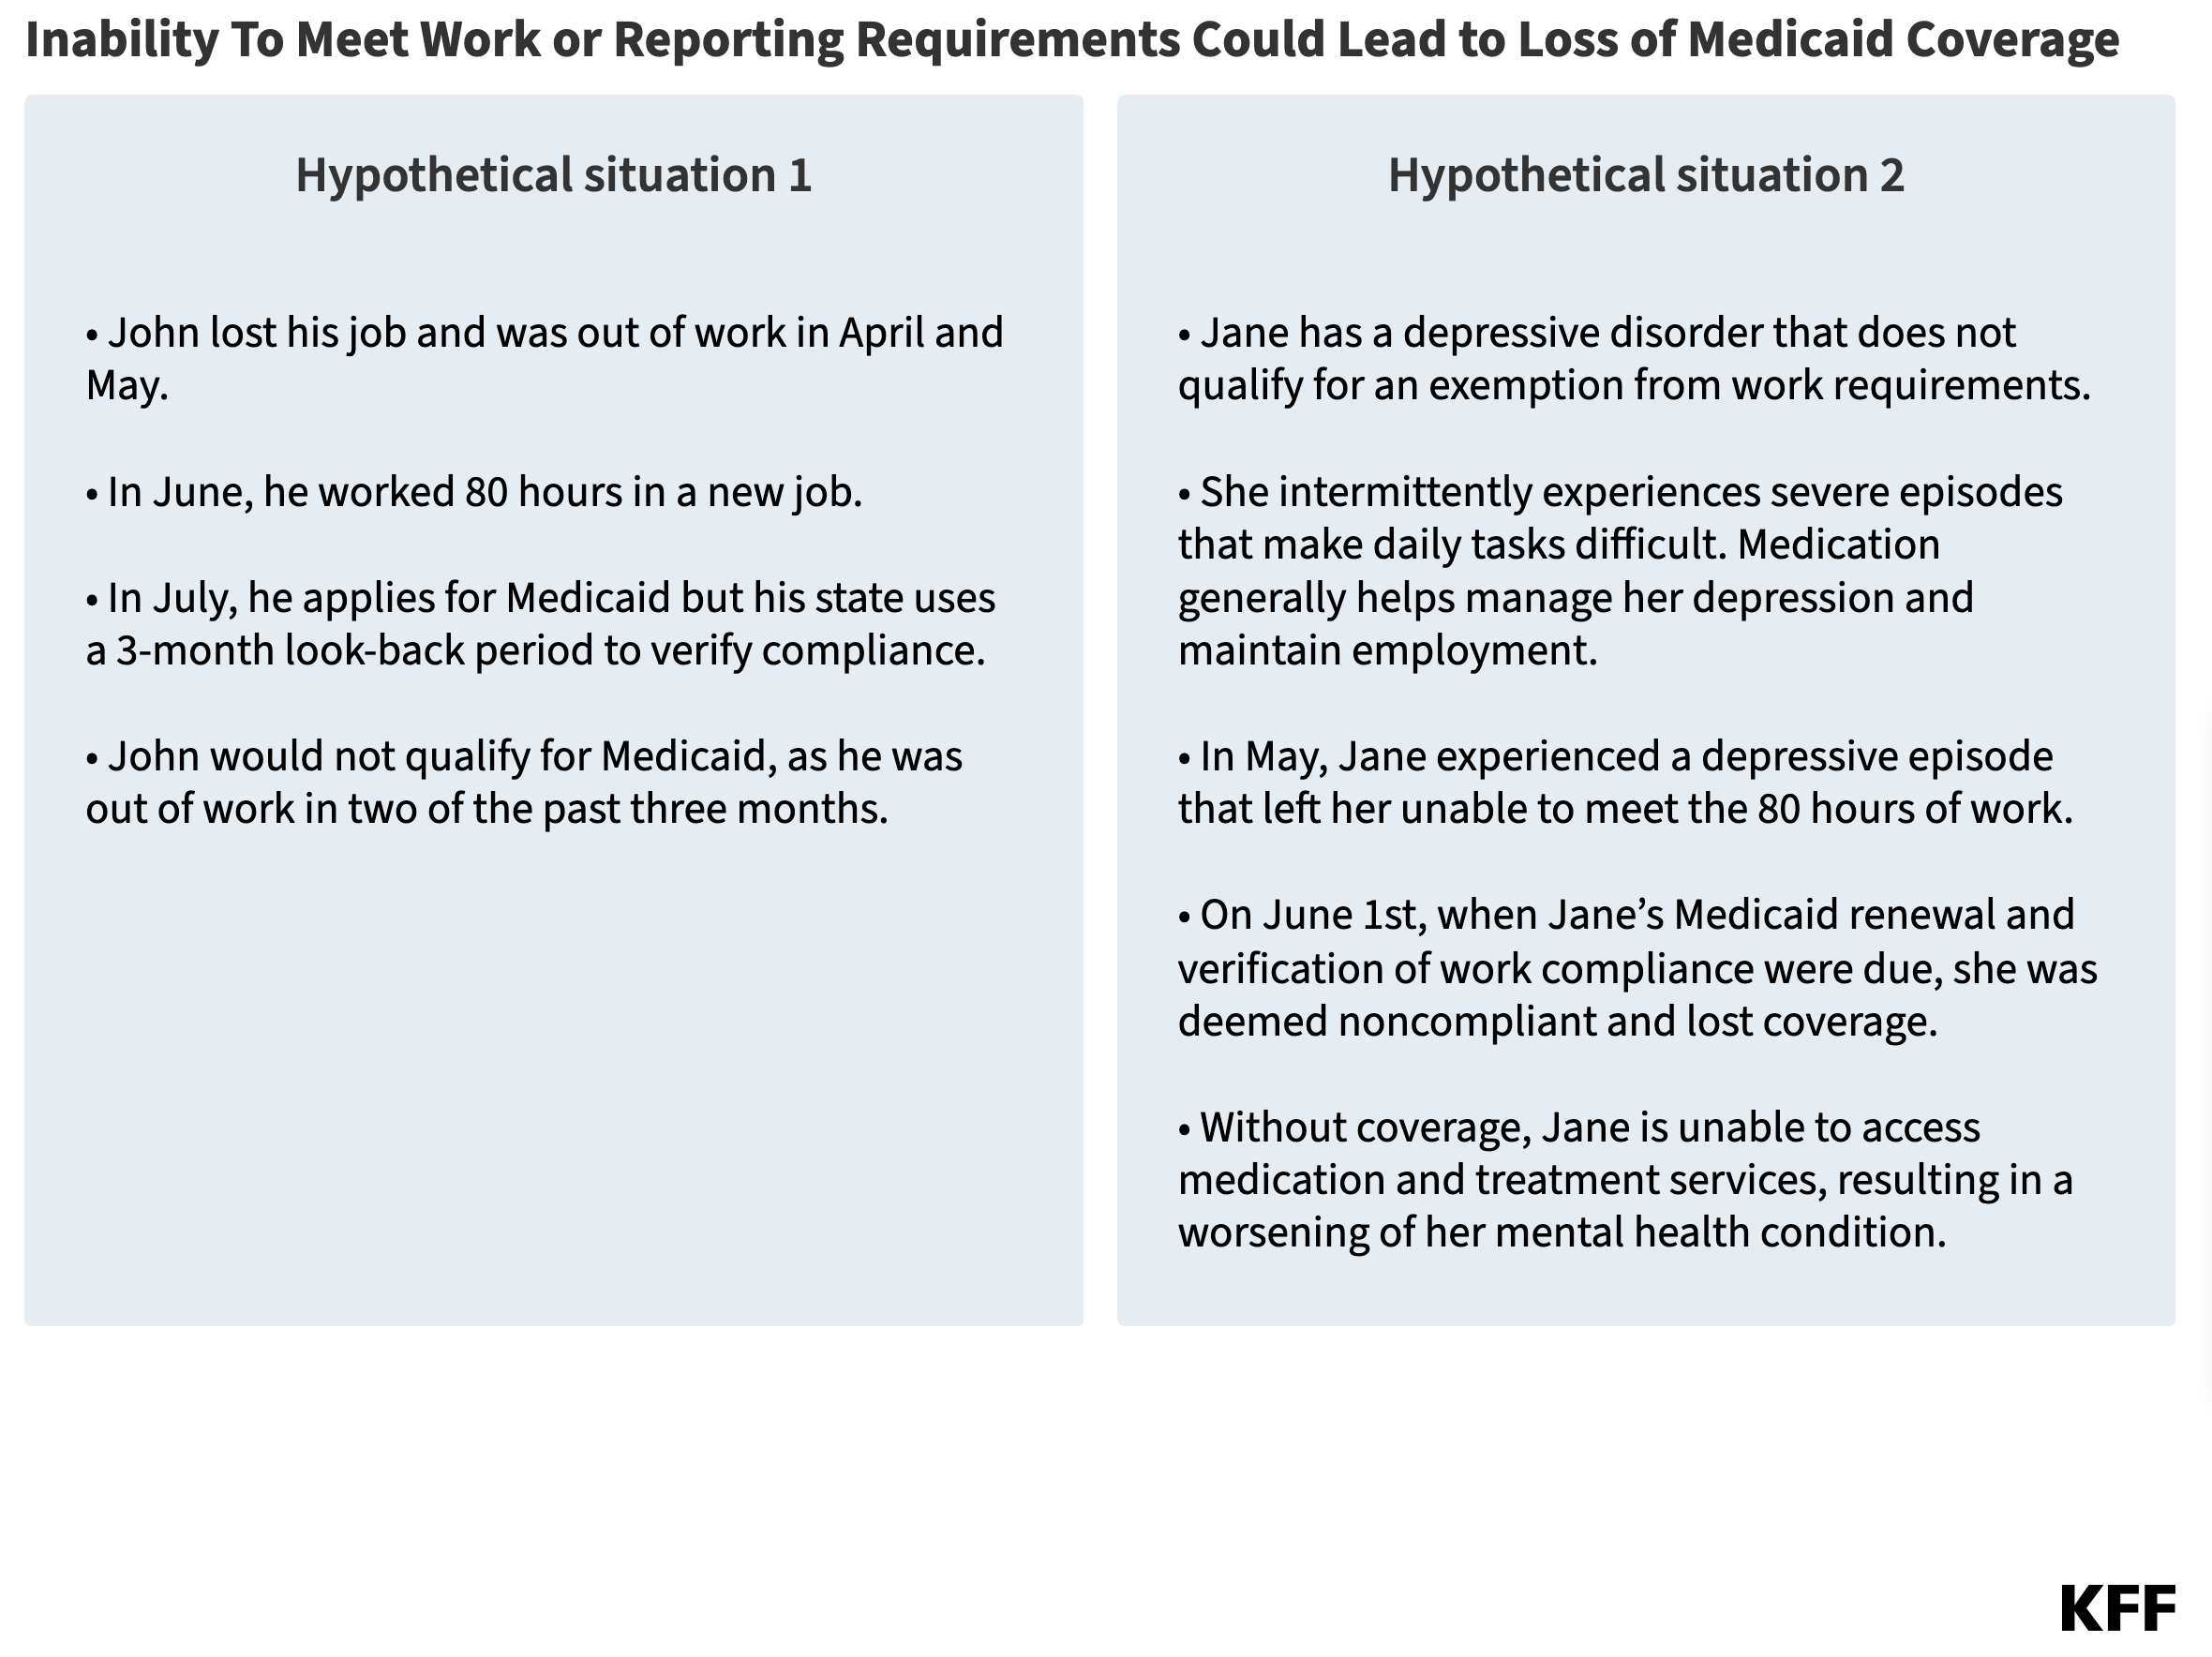
Source: KFF (The Kaiser Family Foundation)
These work requirements are estimated to reduce federal medical spending by $326 billion over 10 years by increasing the number of people who are uninsured in 2034 by 10 million. Alternatively, a new study from researchers at Yale and the University of Maryland has found that implementing Medicare for All would save 114k lives annually and $1 Trillion in costs.
The Kaiser Family Foundation has compiled a page that tracks how each state is planning to implement the bill in their local jurisdiction. Contact your local and state health departments for further guidance on how and when these laws could go into effect for you. In some areas changes could take effect before January 1.
A coalition of attorneys general from 25 states, plus the District of Columbia, are currently suing the Trump administration over the proposed implementation of these work requirements. Rhode Island Attorney General Peter Neronha says that “this eleventh-hour attempt to further narrow protections for medically frail Medicaid recipients seeks to punish those who cannot fend for themselves.” The states claim the mechanisms used to enforce the work requirements violate federal law by creating unnecessary red tape, which causes enrollees who should qualify to lose their insurance due to formalities in the exemption process.
We must write to encourage attorneys general who are a part of this lawsuit to keep up the pressure and to take steps to dismantle One Big Beautiful Bill entirely. Those residing in states who are not currently participating in the lawsuit can write their attorneys general to encourage them to join. Visit the “Take Action!” section at the bottom of the page for more information.
The Weather
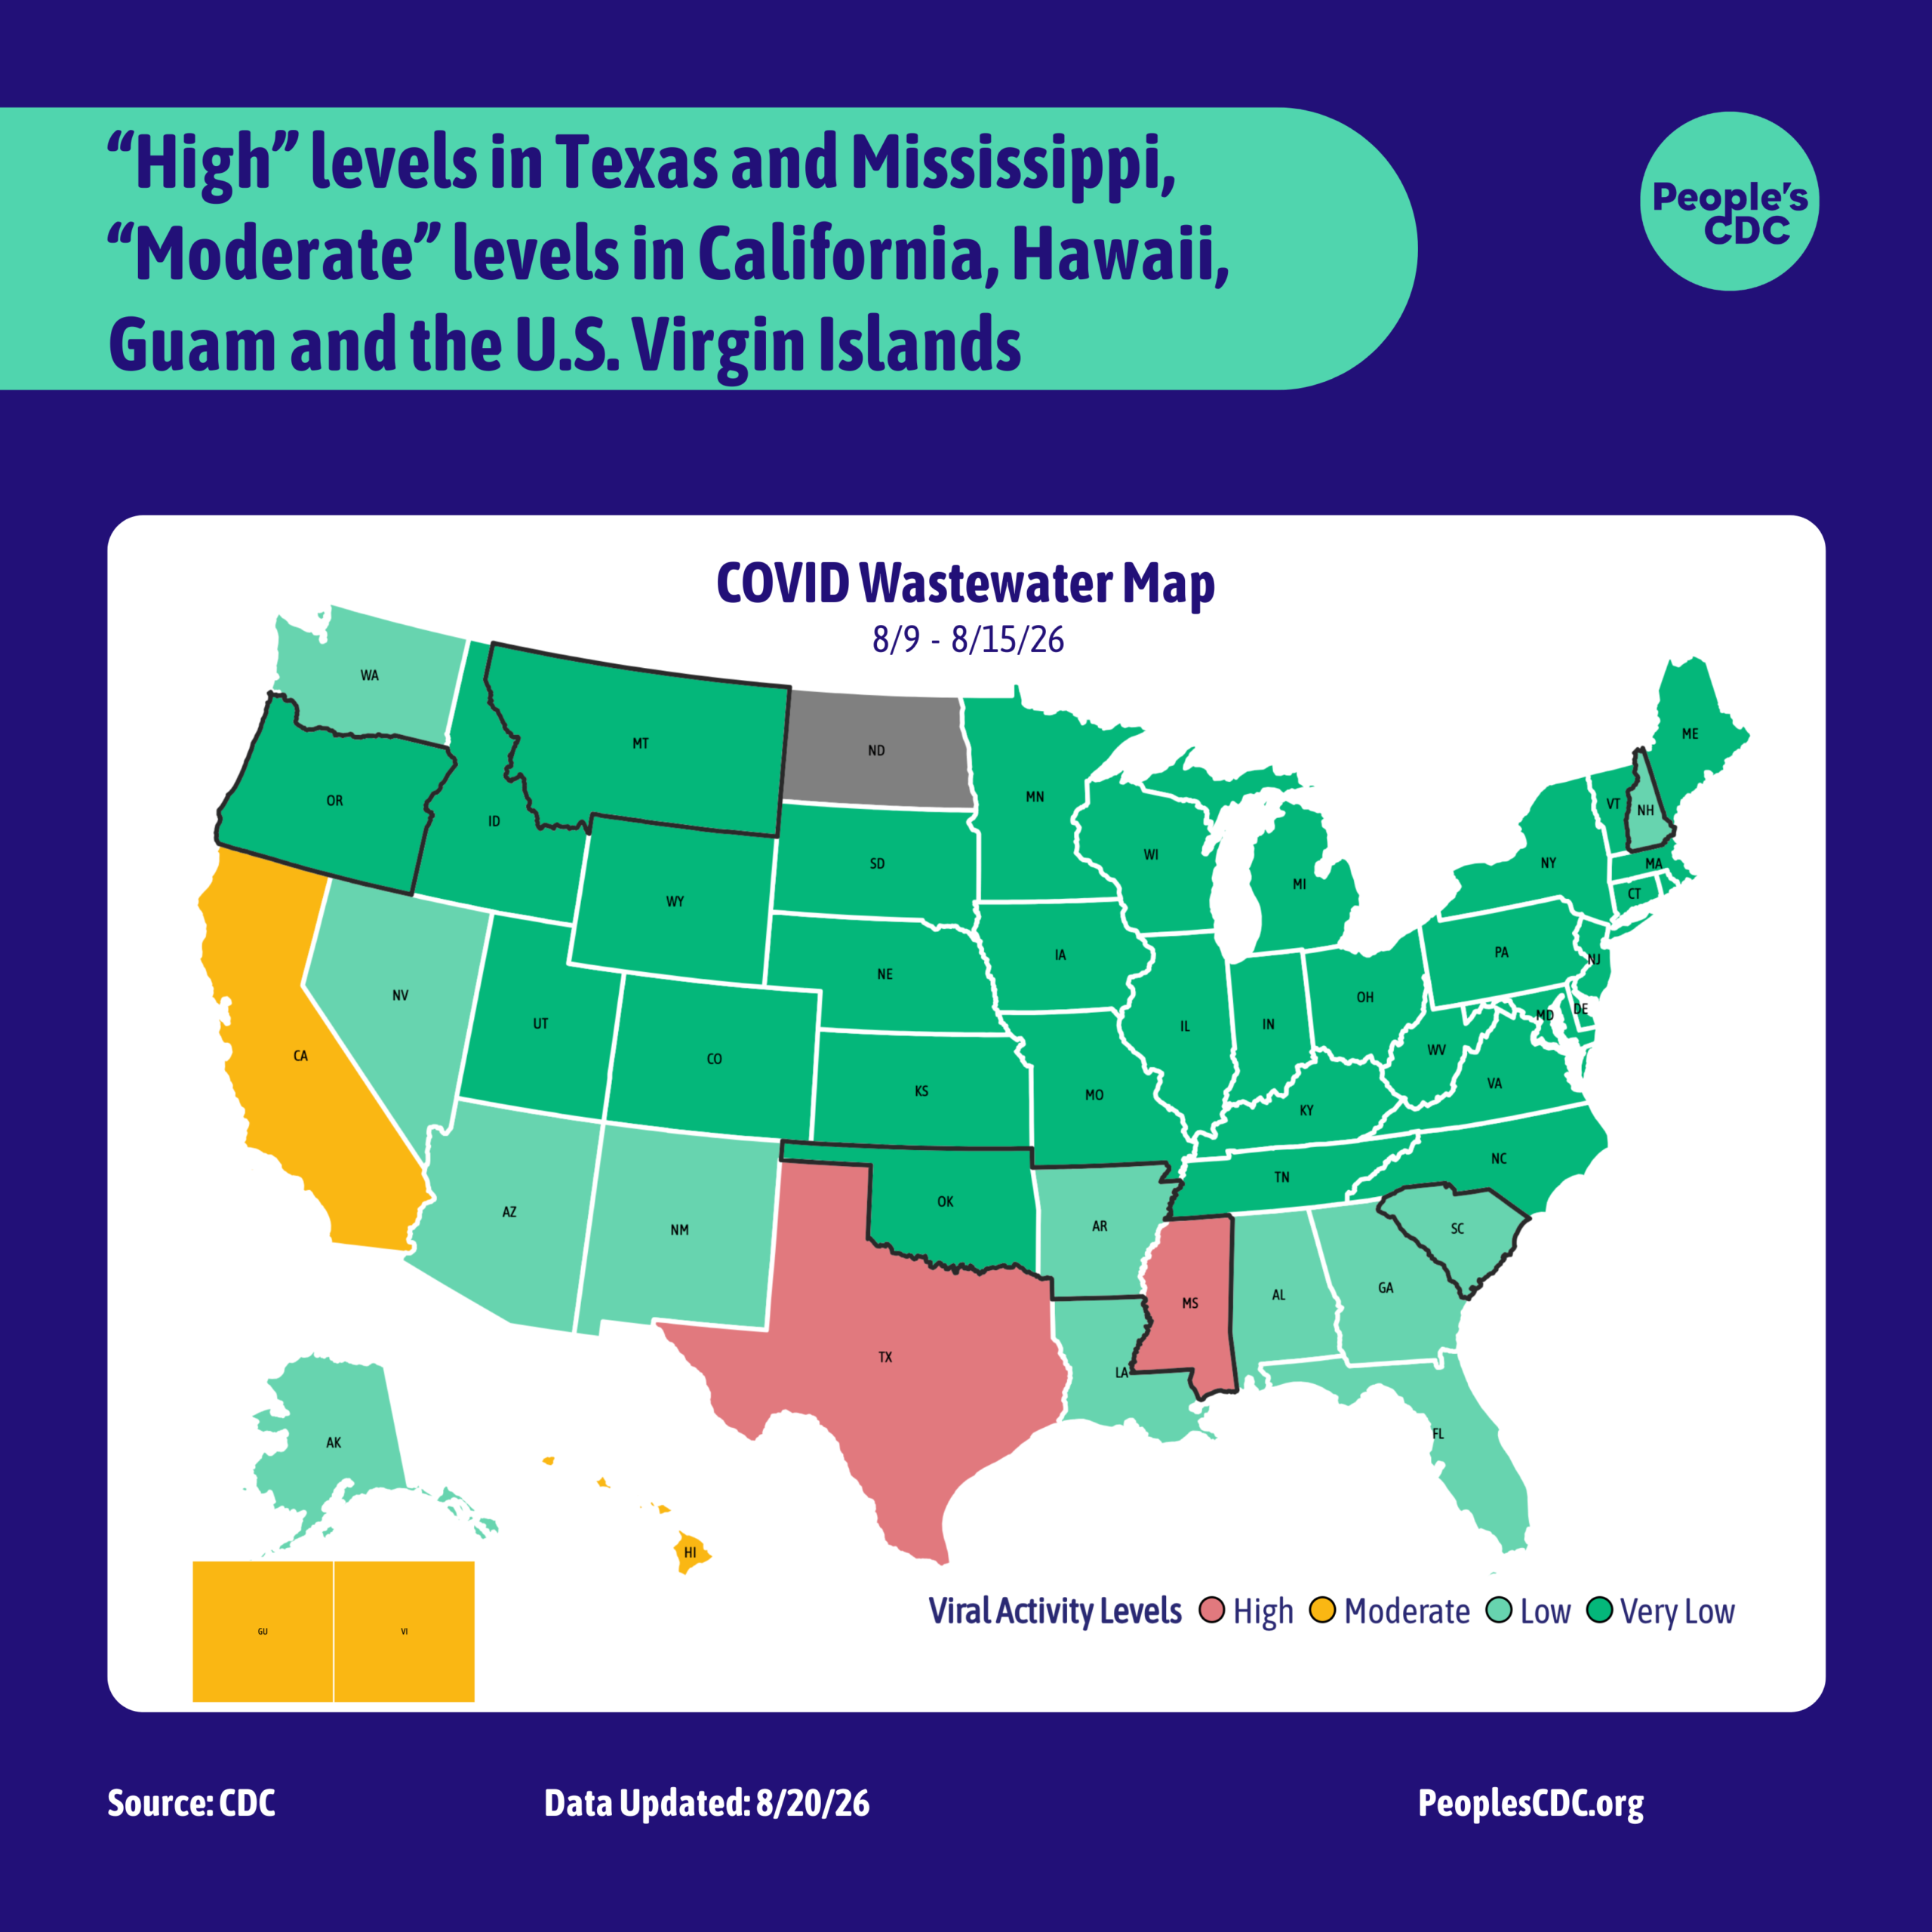
The CDC-based wastewater map was updated on August 20 and depicts wastewater levels for the period from August 9 through August 15.
According to the CDC’s COVID Wastewater Viral Activity map, two states are experiencing “High” levels, four states and territories are experiencing “Moderate” levels, 12 states are “Low” and 34 states are experiencing “Very Low” levels.
Oregon, Montana, Oklahoma, Arkansas, Mississippi, South Carolina and New Hampshire are reporting “Limited Coverage,” meaning that the data is based on less than 5% of the population and may not be accurate for the entire state. North Dakota is reporting “Limited/No Data.”
Regional trend data indicate the West has risen from “Very Low” to “Low” with the Southern trends also showing a sharp increase and National trends showing a slight increase.
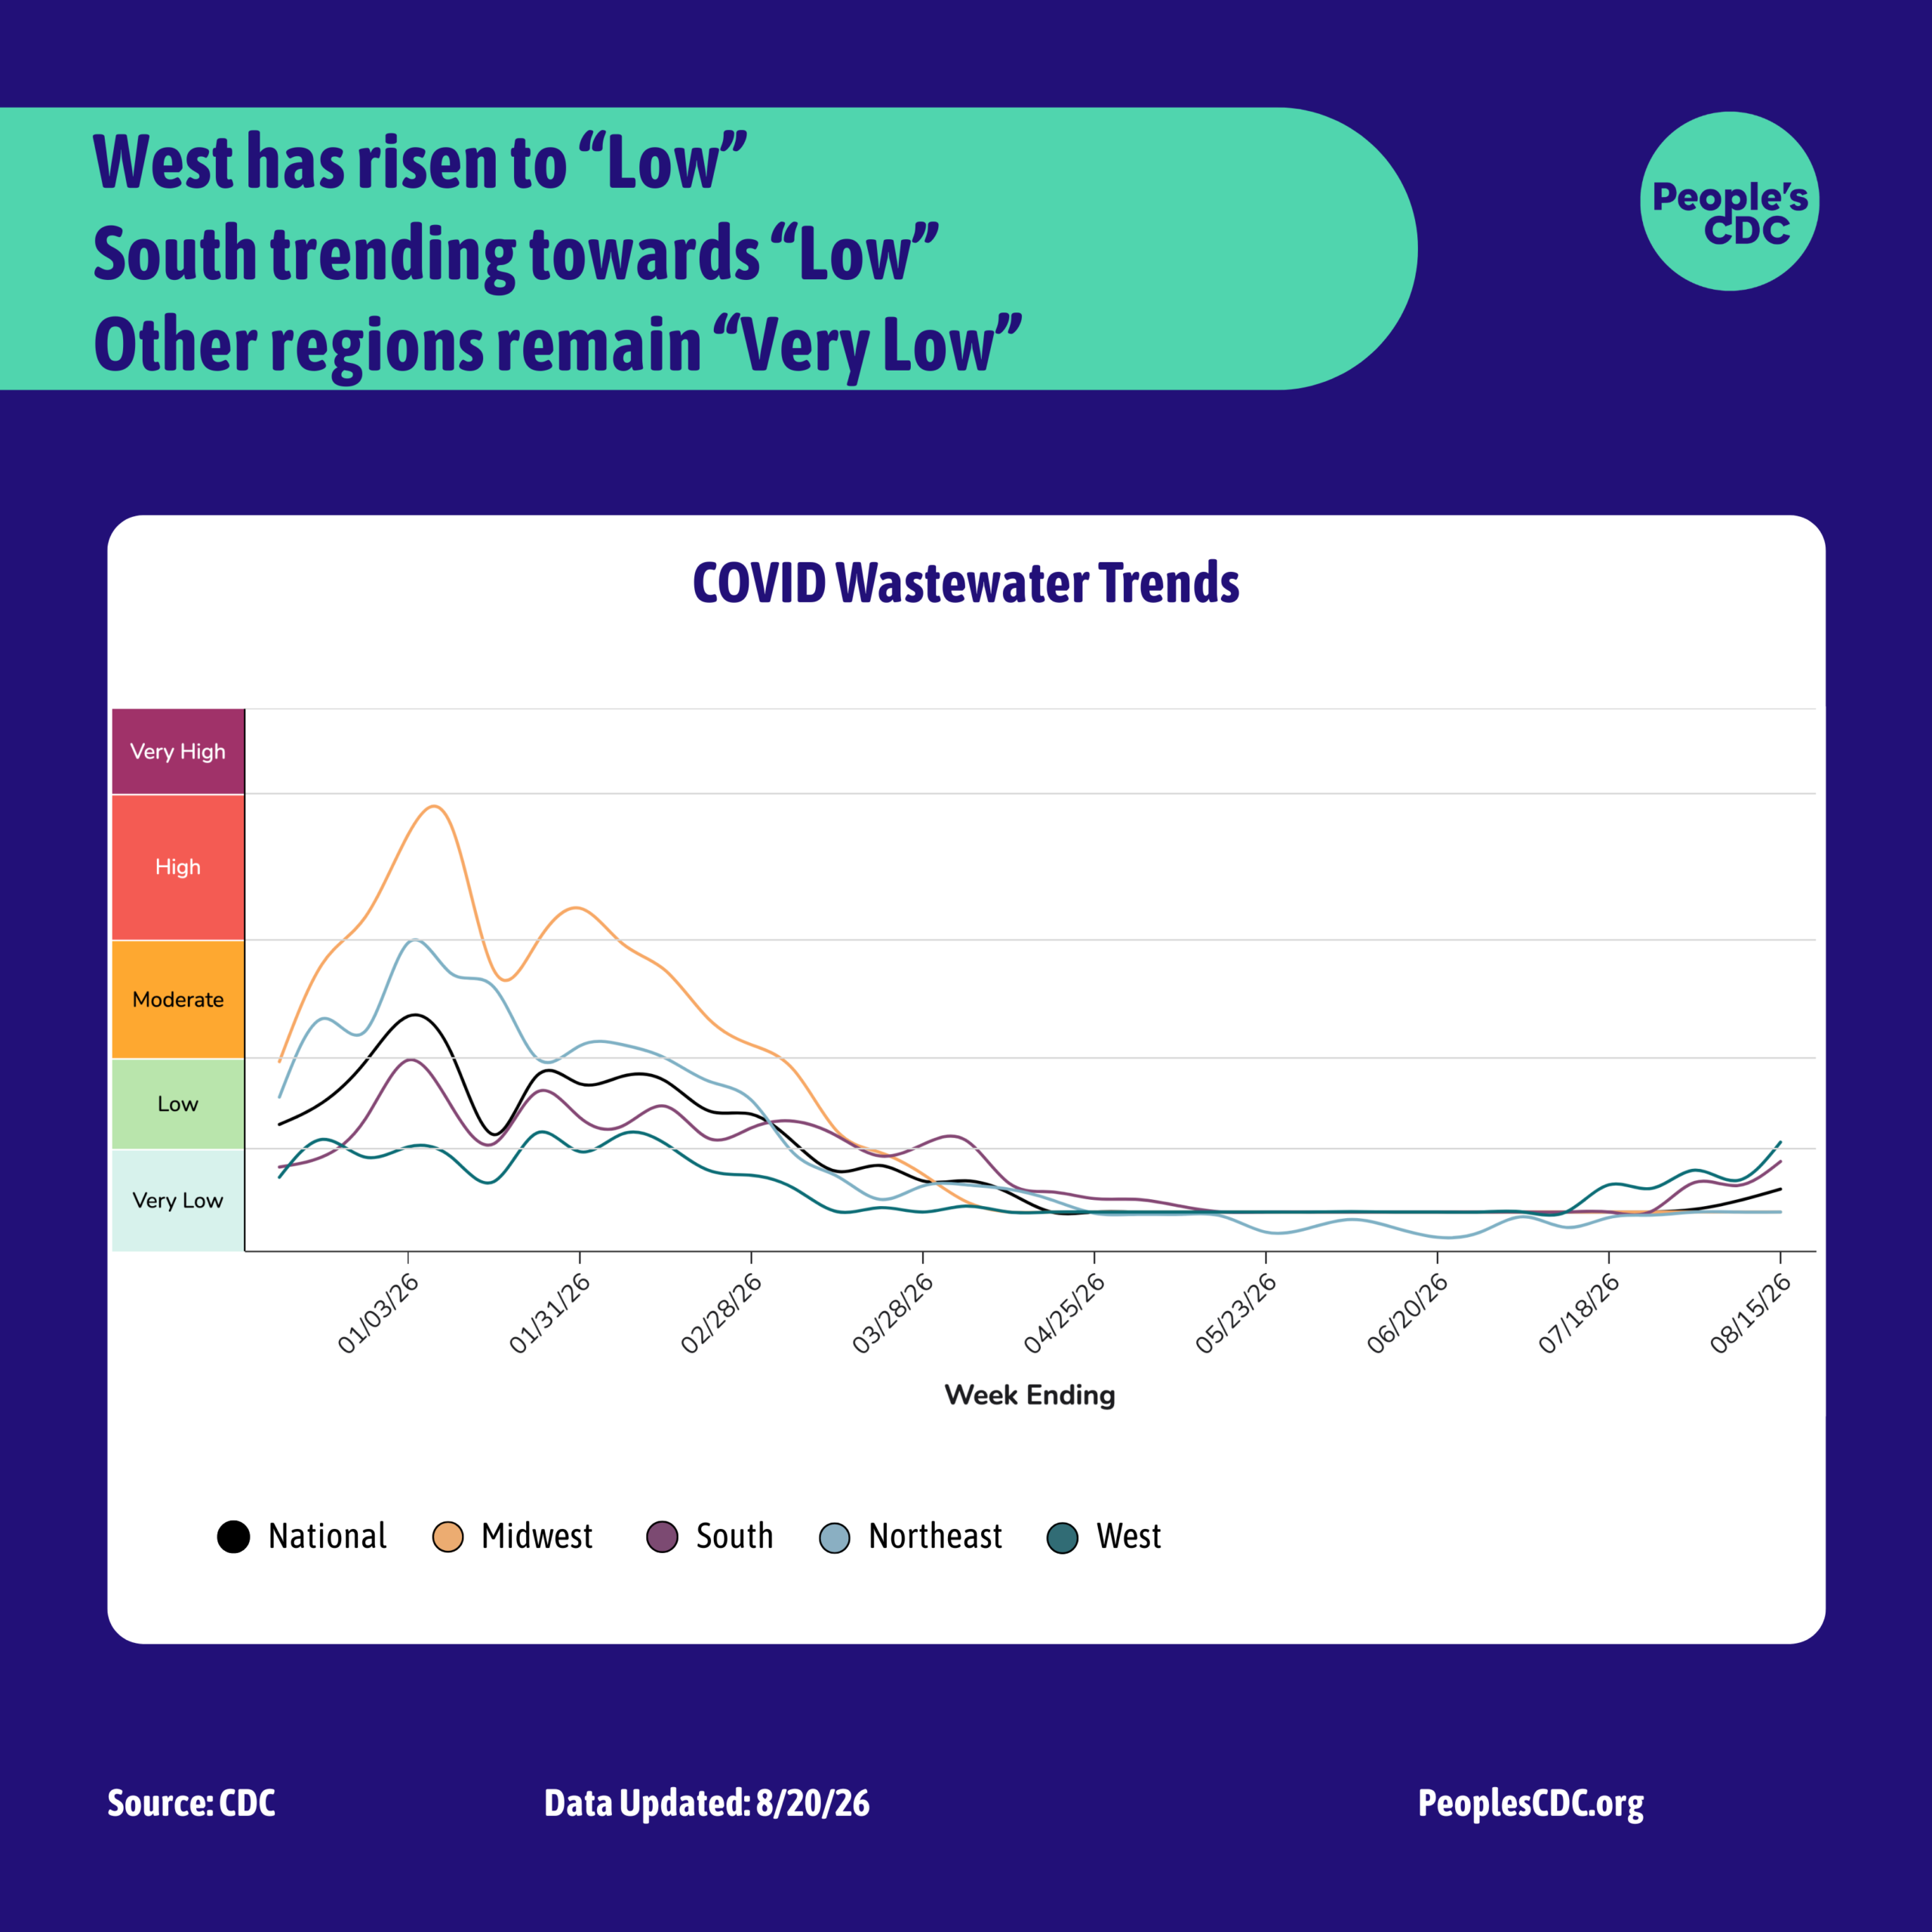
Some have noted that the CDC seems to have changed their values, creating a higher threshold to what is considered “Very Low” from week to week. The CDC notes that they make regular adjustments to these levels which you can read about here. The CDC indicates these adjustments are meant to occur in April and October each year. Since it’s neither April nor October, we’re uncertain about why the thresholds seem to have changed between last report and this one. We have reached out to the CDC to inquire.
As a reminder about the meaningless of these values, we indicate all CDC level markers in quotations. These categories of “Very Low,” “Low,” “Moderate,” “High,” and “Very High,” are not neutral or objective, they are reflections of the degree of responsibility that the CDC is willing to take; the categories are informed by how disposable they think we are.
This is also a good reminder to do your best to look for data coming from your most local wastewater facility. The levels reported by the CDC are statewide, and levels can vary widely across a state. Remember that “Very Low” levels do not guarantee that you will not be exposed to SARS-CoV-2 or contract COVID in your area.
Wastewater trends should be used as guidelines for when to increase precautions, with strategies such as cancelling events, avoiding large groups, or rescheduling certain postponable doctors’ appointments. Wearing a properly fitted N95/KN95/KF94 mask indoors and in crowded outdoor spaces, regular testing, and year-round masking policies at hospitals and nursing homes are baseline precautions that minimize viral transmission for everyone, and should be implemented at all levels of wastewater spread.
Notably, the data from WastewaterSCAN tells a very different story. It shows “High” levels throughout most of the country and “Medium” levels in the Midwest.
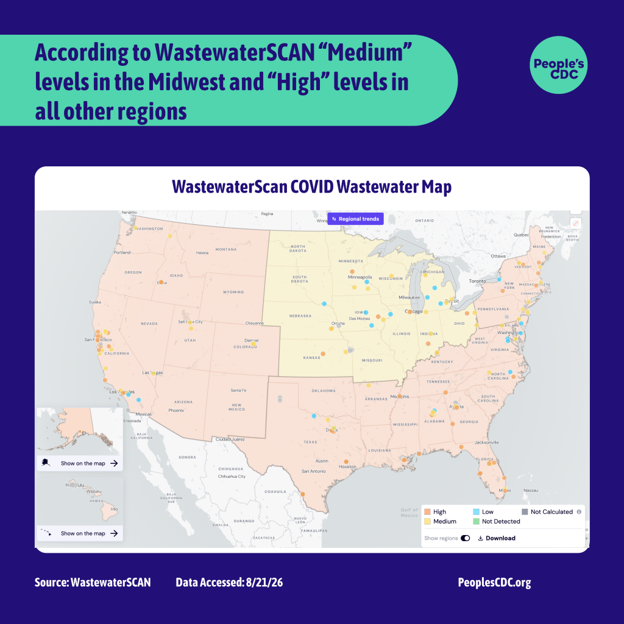 Graphic source: WastewaterSCAN
Despite discrepancies between the CDC’s values and WastewaterSCAN’s, both the rise in wastewater elevation that we are seeing in Southern and Southwestern states in the CDC’s map and the “High” to “Moderate” levels in all regions in the WastewaterSCAN map seem as though they could indicate the beginnings of a late-summer wave. While COVID trends aren’t exactly the same each year, we can expect cases will continue to increase as the fall school term starts this month and next.
CDC Epidemic Trends
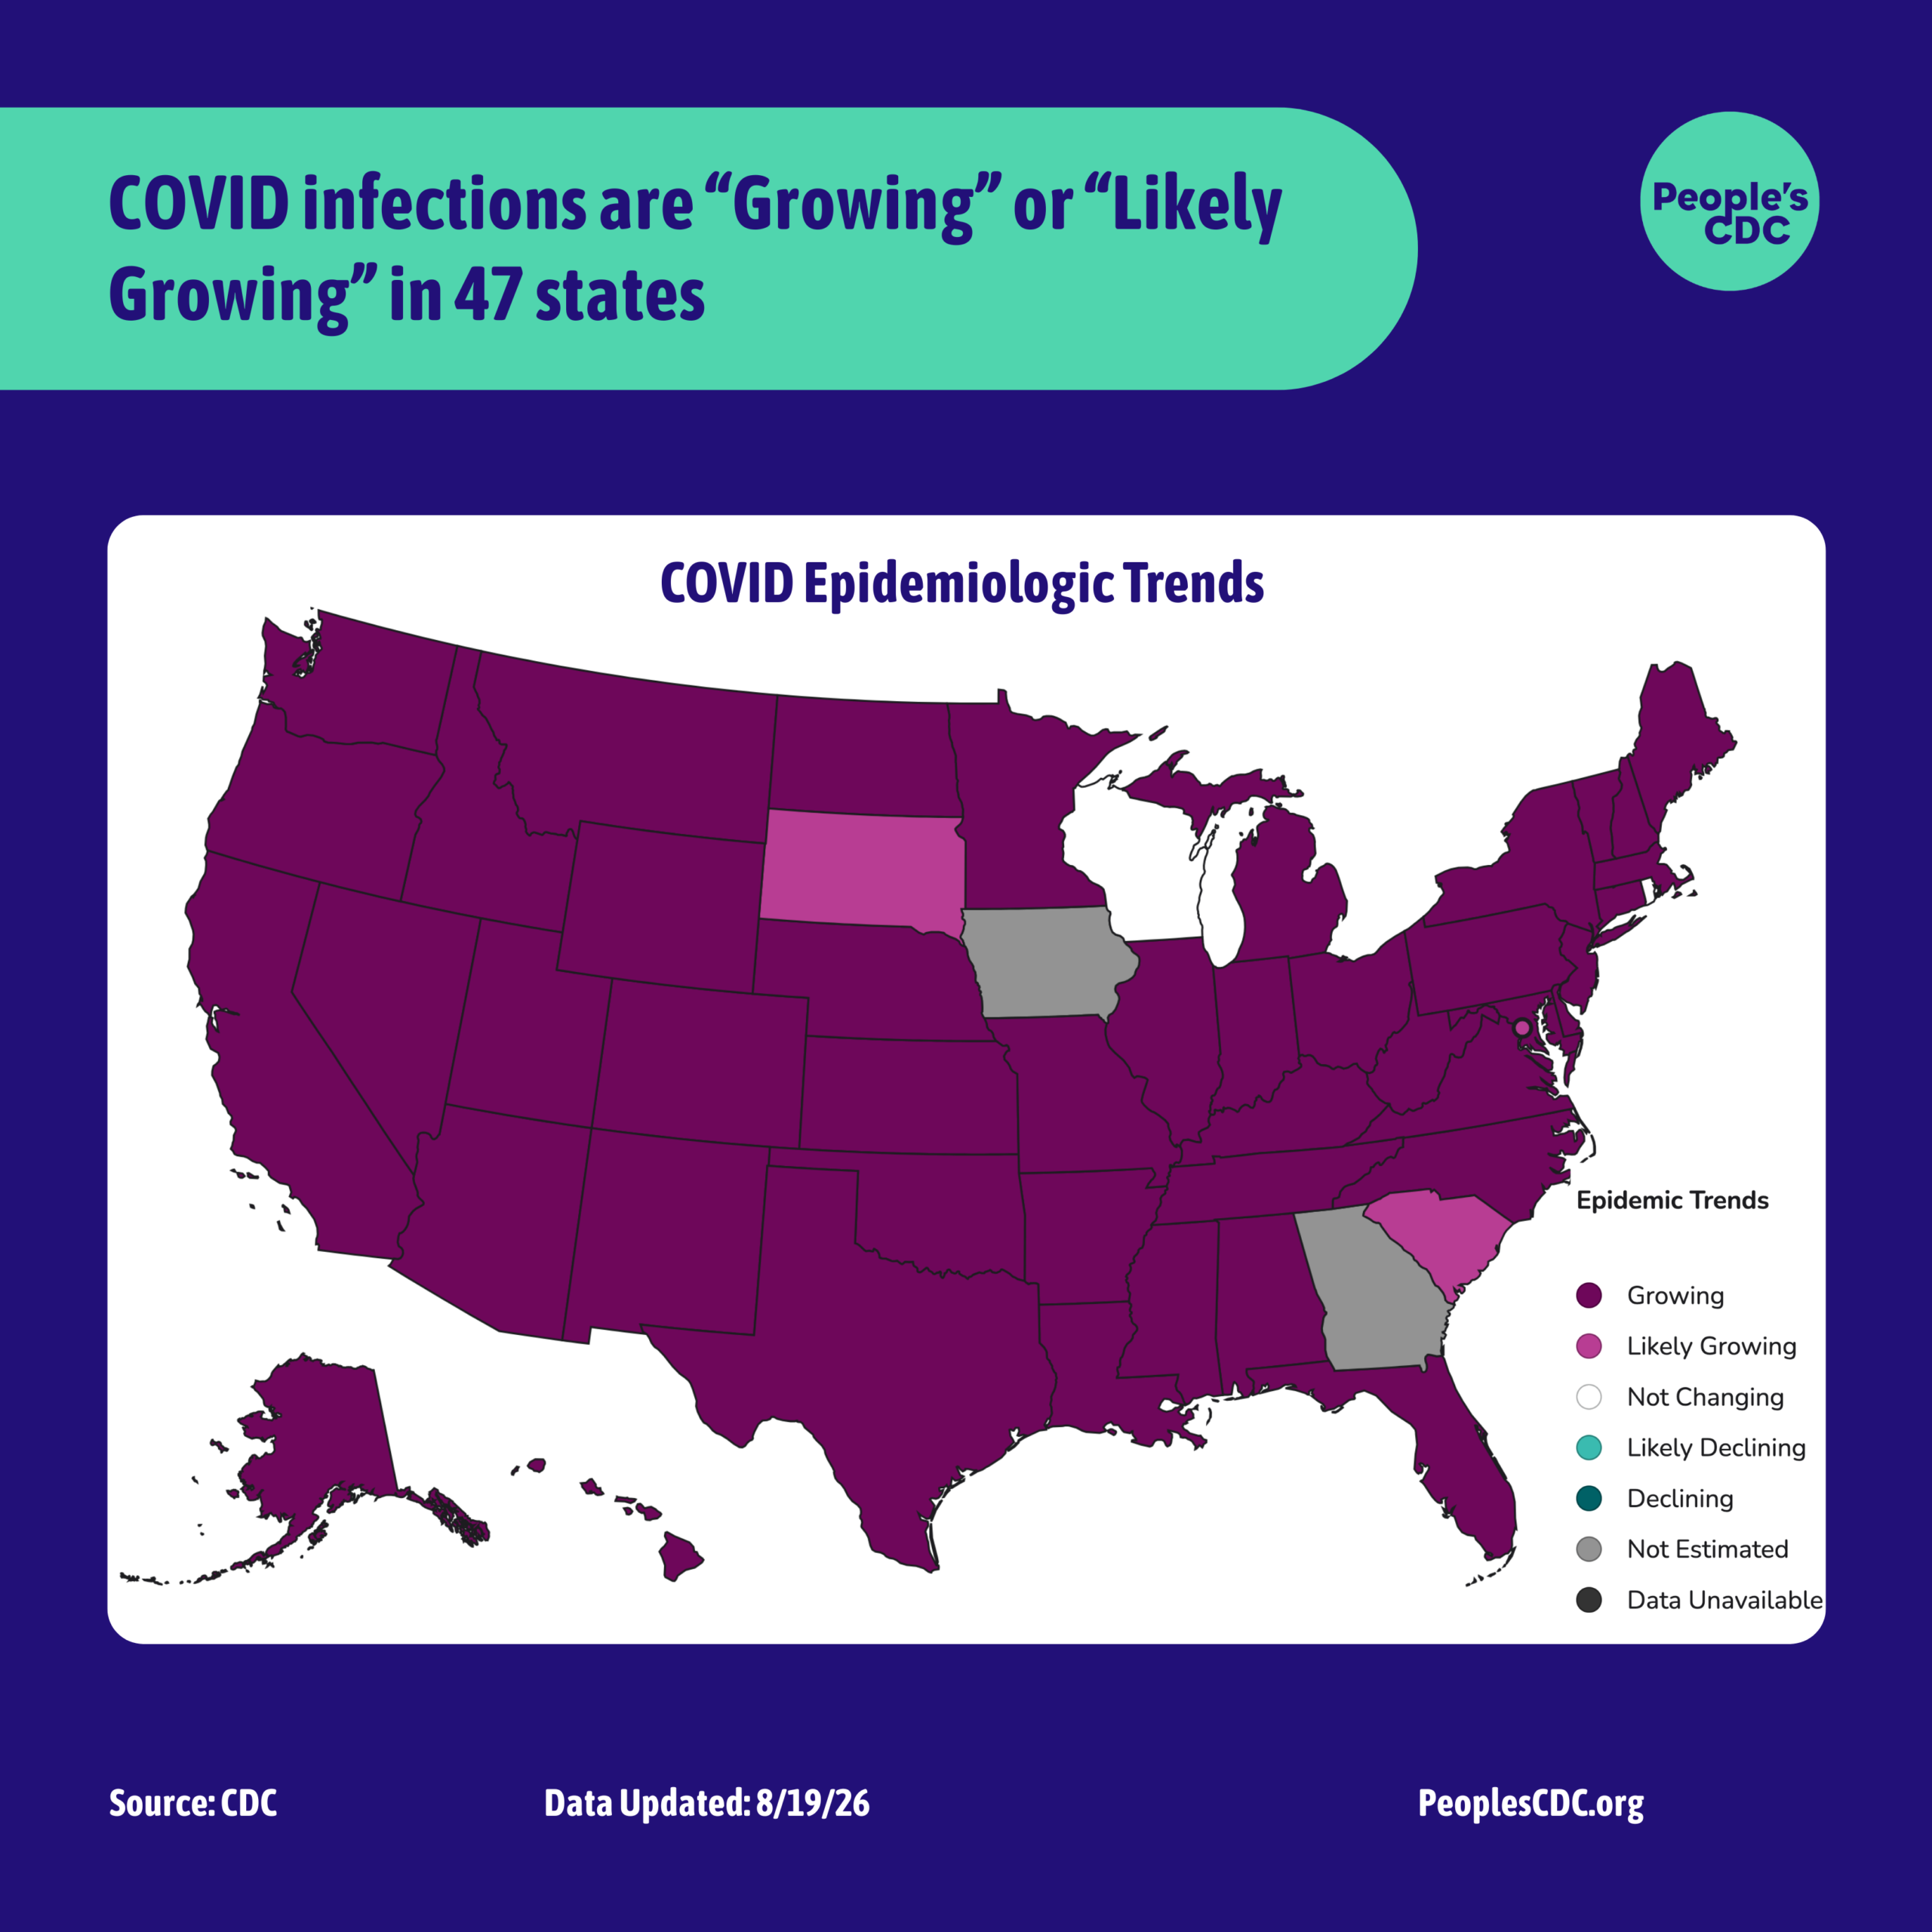
According to CDC Epidemic Trend data, there is a probability that the number of infections is “Growing” nationwide, with the exception of South Dakota, South Carolina and Washington D.C. where the trend is classified as “Likely Growing,” in Wisconsin and Rhode Island where it is “Not Changing,” and in Georgia and Iowa where it is “Not Estimated.”
These values are estimations based on a formula rather than measured data. It is estimated from daily incident emergency department visits reported through the National Syndromic Surveillance Program. It can tell us whether a current epidemic trend is growing, declining, or not changing, and is an additional tool to help public health practitioners prepare and respond. It cannot tell us about the underlying burden of disease, just the trend in infections. An Rt < 1 does not mean that transmission is low, just that infections are declining. They could be declining from a high level to another slightly lower high level.
Wastewater Surveillance at Risk
While wastewater surveillance continues to prove useful at mitigating disease spread, CDC wastewater monitoring efforts are set to be scaled back. Current programming has been cut from $125 million annually to $25 million annually, and the contract with Verily Life Sciences has been briefly extended to a new expiration date of September 14. The pressure that we are putting on Congress to continue these contracts is working. Now more than ever, it is important to ramp up both emails and calls. See more on how to do this in our “Take Action!” section.
Take Action!
Reject Medicaid Work Requirements and One Big Beautiful Bill
If you live in Arizona, California, Colorado, Connecticut, Delaware, the District of Columbia, Hawaii, Illinois, Maine, Maryland, Massachusetts, Michigan, Minnesota, Nevada, New Jersey, New Mexico, New York, Washington, Wisconsin, Kentucky or Pennsylvania, call and email your attorney general to voice your approval over their participation in Case No. 26-12962, the lawsuit against the implementation of Medicaid work requirements. If you reside outside of these states, call and email your attorney general to encourage them to join the lawsuit. Additionally, residents of all states should call and email their governors asking them to be liberal in their interpretation and enforcement of Medicaid work requirements and in their process of determining who is exempt and who qualifies as “medically fragile.” Tell your governor and your attorney general to support Medicaid for All which would save both 114,000 lives per year and $1 trillion, and to reject work requirements for healthcare and One Big Beautiful Bill wholesale.
Demand Continued Wastewater Surveillance!
Ask your congressional leaders to renew $125 million dollars of annual funding to the CDC National Wastewater Surveillance System to prevent it from going dark as soon as September 30, 2026. In addition to the above Action Network campaign, consider giving both your representatives and congresspeople a phone call to record your dissent. This program remains one of the most valuable public health tools for detecting increased spread of infectious diseases such as COVID, measles, polio, mpox, RSV, influenza, and avian flu.
Notes: 1) The numbers in this report were current as of 08/21/2026. 2) Check out the links throughout & see our website for more at https://peoplescdc.org. 3) Subscribe to our newsletter: People’s CDC | Substack.
If you’re donating to us through Substack, consider getting the Substack for free (it’s not paywalled!) and donating to us directly. That way, there are fewer fees for everyone.