
El clima
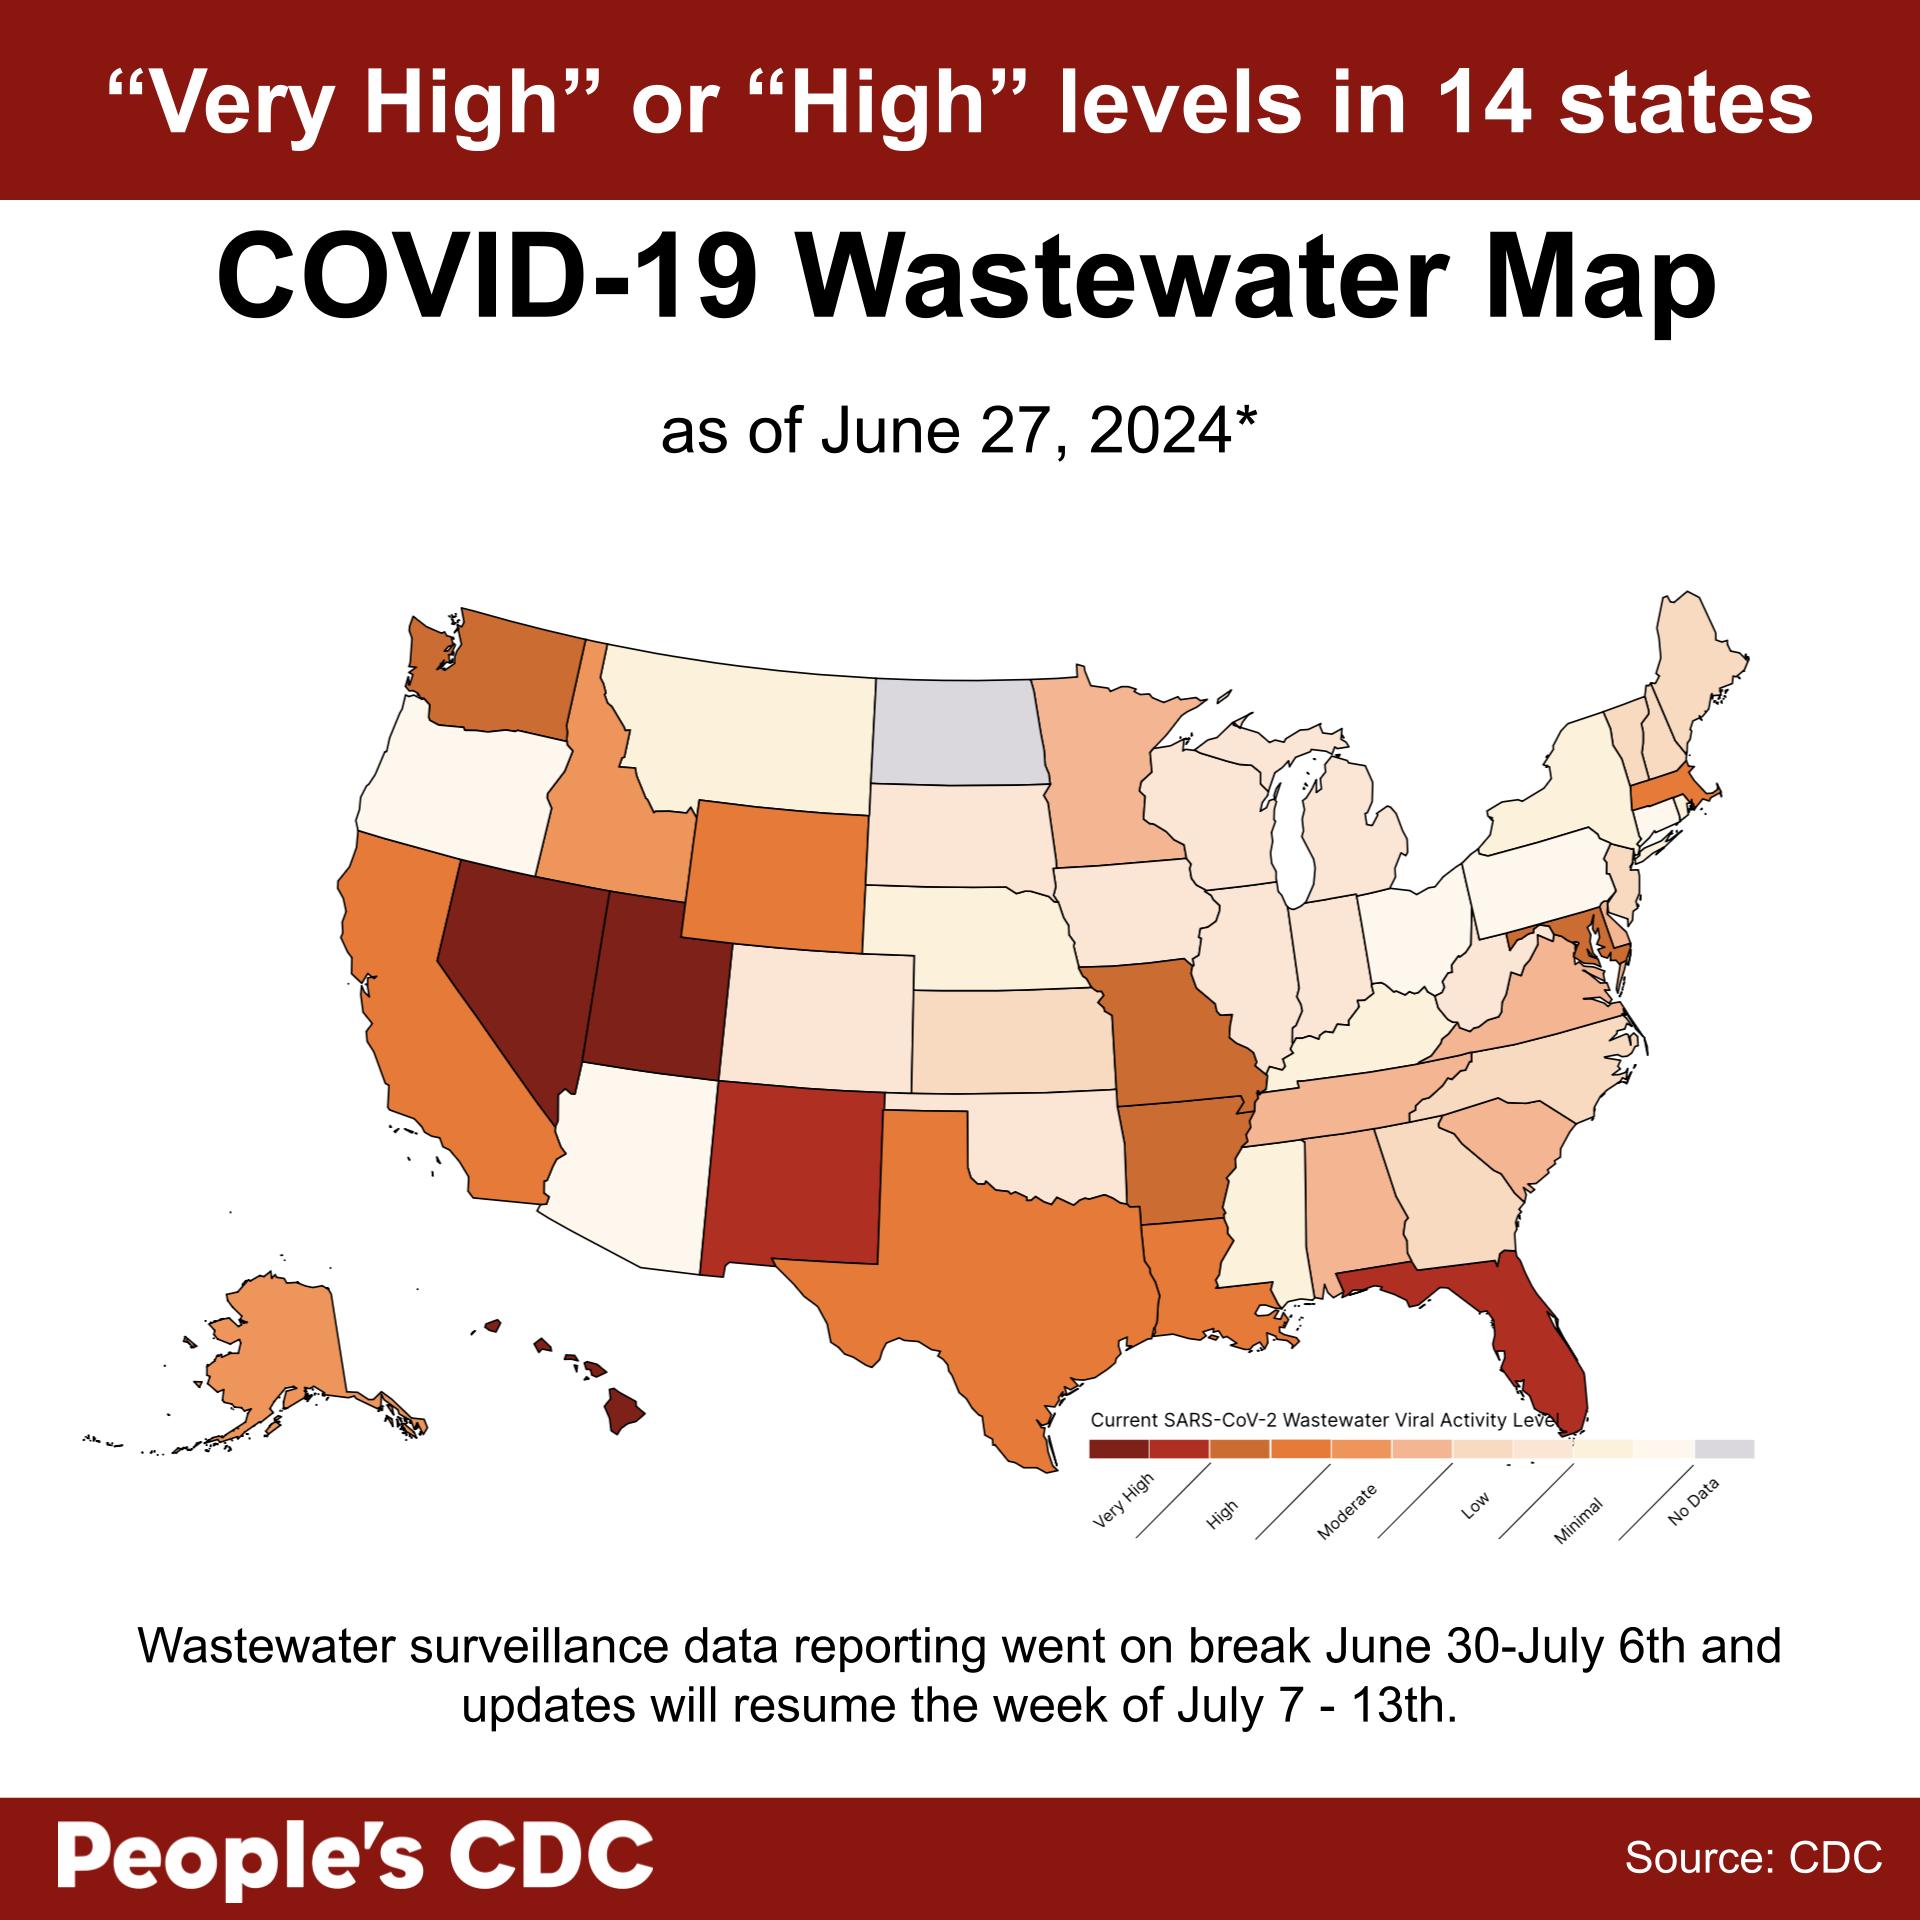
The CDC’s National Wastewater Surveillance System (NWSS) dashboard took a break in reporting updated data during the week of June 30 – July 6th, and is scheduled to resume updates during the week of July 7 – 13th. As a result, the weather roundup below is a reflection of national COVID spread as of June 27th, 2024.
According to the CDC’s National Wastewater Surveillance System (NWSS) dashboard, viral activity is “Very High” in Nevada, Utah, New Mexico, Hawaii, and Florida. Levels are “High” in Washington, California, Arkansas, Texas, Missouri, Wyoming, Maryland, Massachusetts, and Louisiana.
Minnesota, Delaware, Alaska, Virginia, Alabama, Tennessee, Idaho, and South Carolina are reporting “Moderate” levels.
No data is available for North Dakota, Puerto Rico, the U.S. Virgin Islands, the District Of Columbia, and Guam.
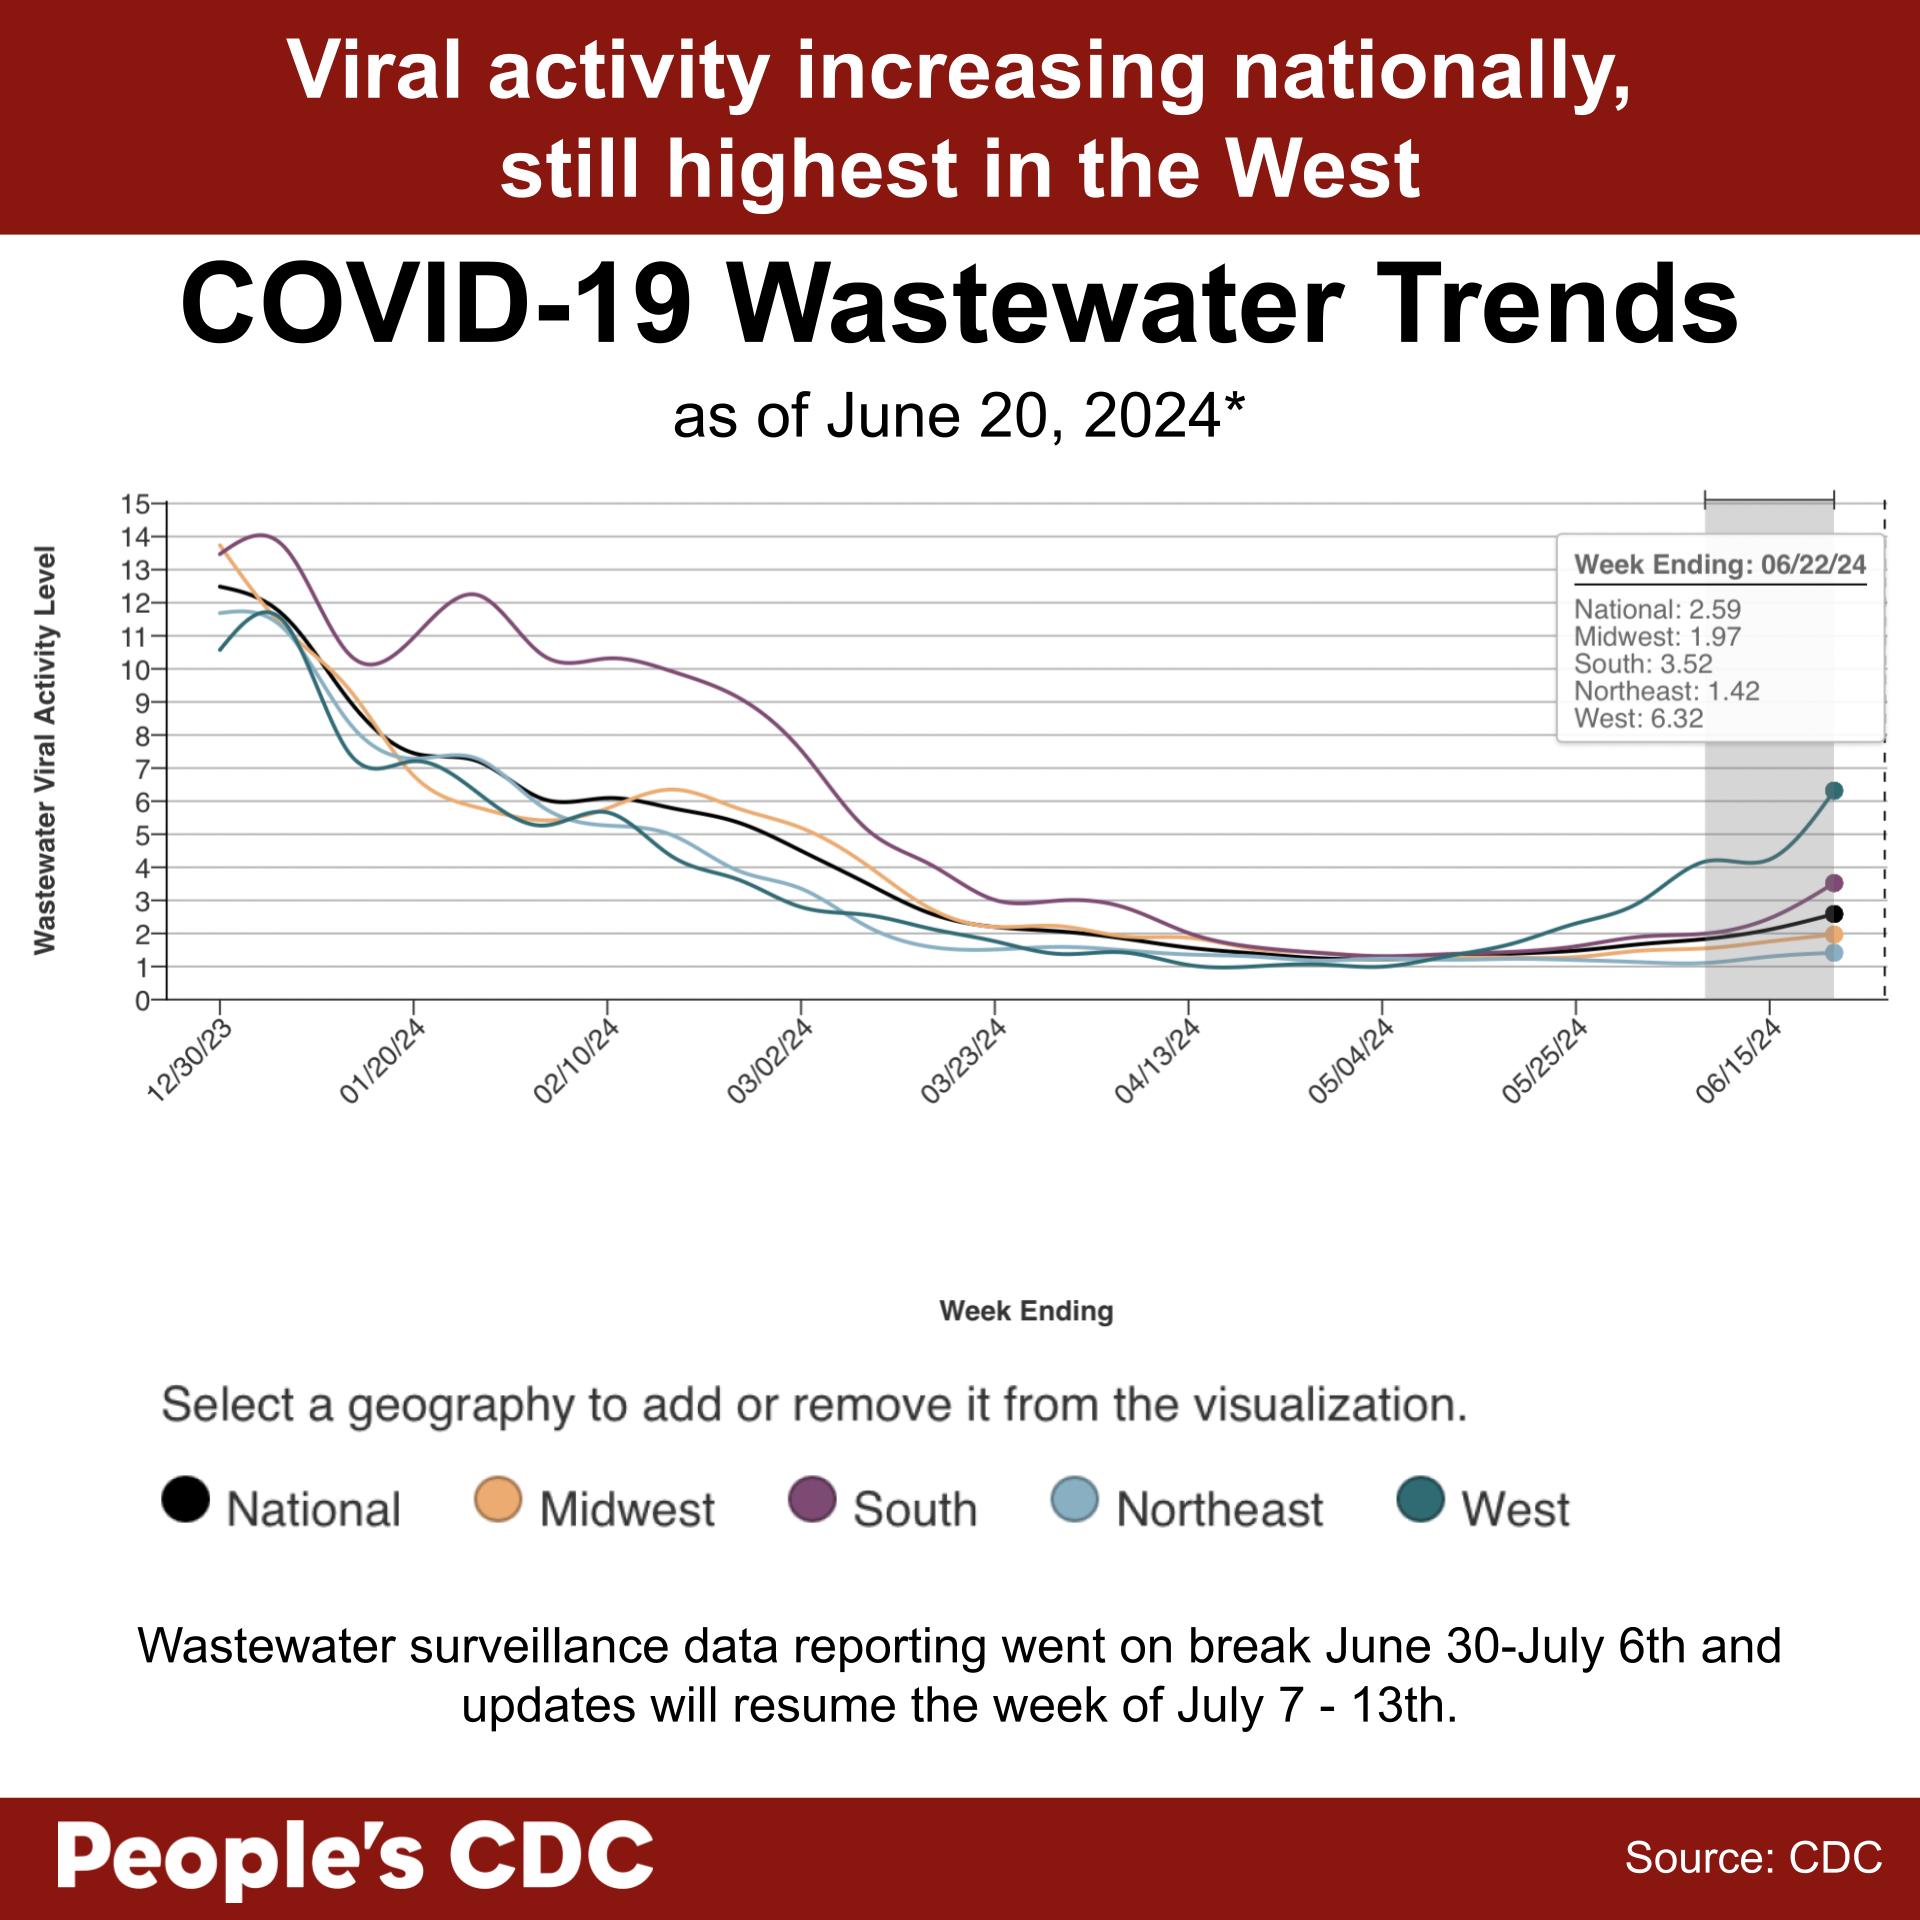
As per the CDC’s Wastewater COVID-19 National and Regional Trends dashboard, COVID wastewater levels are increasing nationally, with the highest increase in the West from June 8, 2024. According to provisional data for the weeks ending in June 15 and June 22, there seems to be a dramatic wastewater level increase in the West, followed by slight increases in the Midwest and South. Levels in the Northeast increased slightly and then plateaued. Wastewater SCAN also reports an increase in national levels during the course of the past month.
However, there is still a discrepancy between the CDC’s COVID wastewater data and Wastewater SCAN. While the CDC reports “Low” wastewater levels nationally, Wastewater SCAN reports “High” levels overall. We are still investigating why this is the case. If you would like to assess what the COVID situation is like in your area, you can view the CDC’s state/territory trends page, the WastewaterSCAN’s interactive viewer, or state/local public health wastewater trackers, if they are available. We would like to emphasize that even if wastewater levels are “Low,” this does not communicate the actual risk of contracting COVID in daily life, which may be significantly higher.
Please note that the CDC did not update data for the week of June 30–July 6. Therefore, we can only provide data as of June 27 for the map, and June 20 for the wastewater trends.
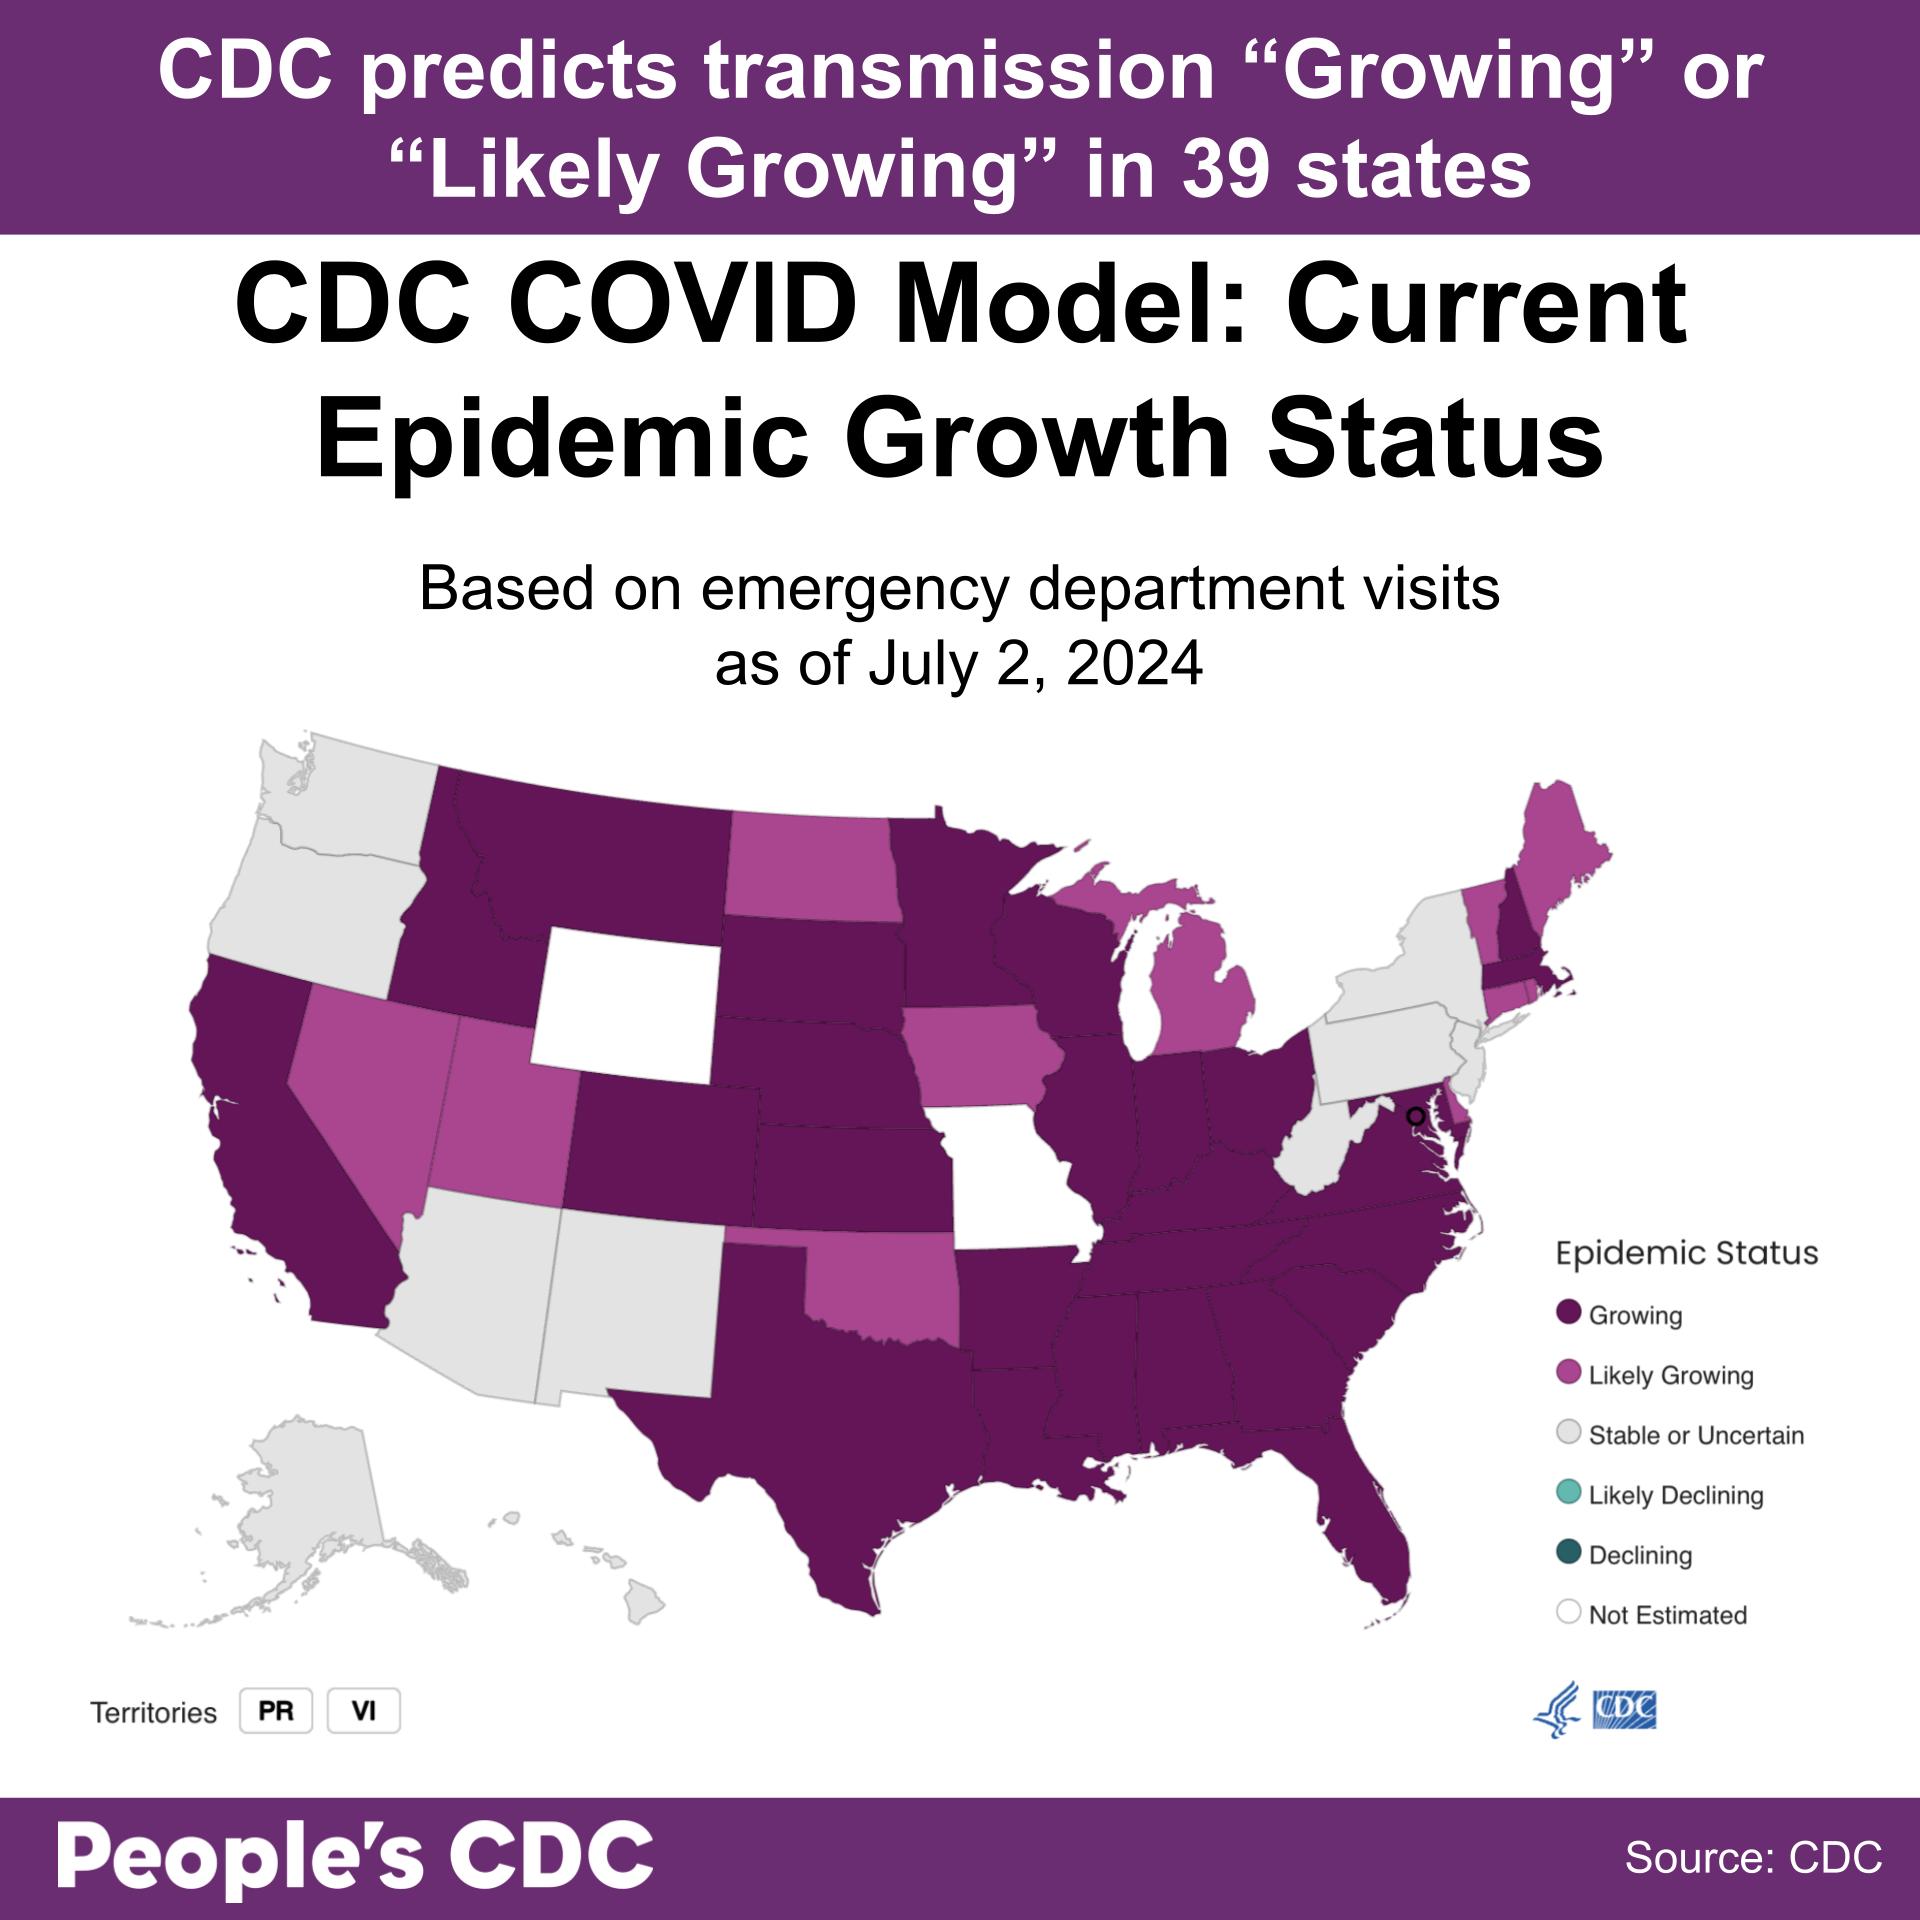
As of July 2, 2024, the CDC Center for Forecasting and Outbreak Analytics predicts that COVID infections “are growing” in 28 states and territories, and “likely growing” in 11 states and territories. Infections in all other states and territories are either “Stable or Uncertain” or “Not Estimated.” No states and territories have “Declining” rates of infection.
This model utilizes emergency department visit data to estimate COVID transmission’s Rt, which is an estimate of the average number of new infections caused by each infectious person. An Rt greater than 1.0 indicates that infections are growing, while an Rt less than 1.0 indicates that they’re declining. It is also important to note that this is very likely an undercount, as beginning May 1st of this year hospitals are no longer required to report COVID-19 Hospital Data.
Variants
According to the CDC’s variant tracking dashboard, KP.3 is the most prevalent variant as of June 8, 2024. Nowcast modeling projects that the prevalence of KP.3 will continue to grow, reaching 36.9% of all circulating variants by July 6. “FLiRT” variants are projected to make up 70.5% of all circulating variants. KP.2 and KP.1.1 are predicted to reach 24.4% and 9.2%, respectively.
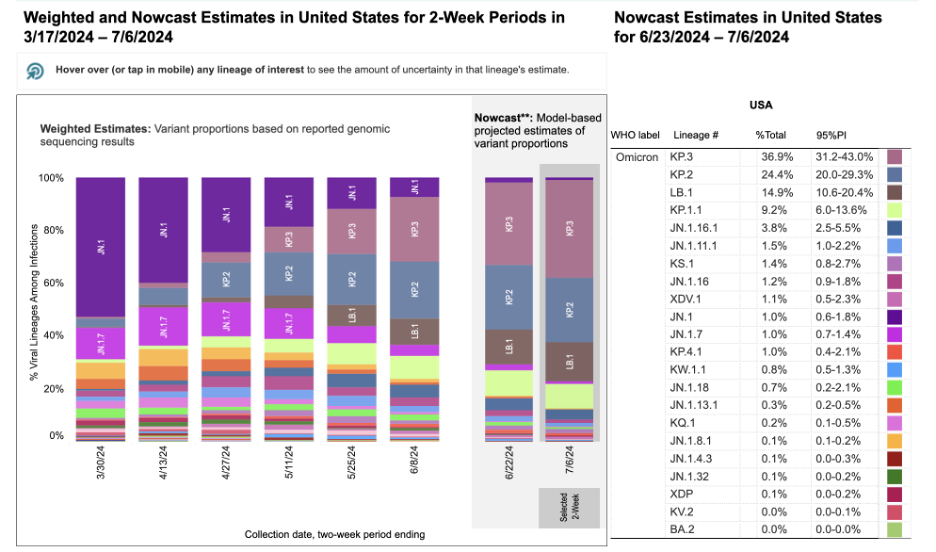
Graphic source: CDC Variant Tracker
Tomar acción
Recently, the CDC updated its website to acknowledge that COVID is not a seasonal virus, and that it can surge throughout the year. They make a distinction between the Flu/RSV and COVID—while Flu and RSV have a seasonal pattern, with sole peaks in the winter, COVID tends to be present at significant levels throughout the year with peaks in the winter and summer.
While this is a great first step in adequately addressing the severity of the pandemic as well as the prevalence of COVID, this is not enough. In addition to these changes, the CDC updated its guidance to include problematic messaging. CDC’s “core prevention strategies” include immunizations, hygiene, steps for cleaner air, treatment, and staying home to prevent spread. They still only recommend that people who are infected stay home until symptoms are improving and they are fever-free, and overlook steps such as testing negative for COVID, which help ensure that one is no longer infectious. We address this oversight in our Carta de firma de experto en aislamiento de COVID, which was signed by over 400 experts, and address the CDC’s overall pandemic response, including its inadequate isolation measures, in our AJPMFocus article.
Additionally, the CDC also fails to include masking, distancing, and testing as part of their “core prevention strategies,” and instead place them under “additional prevention strategies.” All three of these tools are essential, and should be part of everyone’s toolkit while navigating the pandemic.
This kind of messaging only serves to sideline and minimize masking, which is central to curbing COVID infections. In fact, a estudio reciente published in the Antimicrobial Resistance and Infection Control found that when hospitals switched to more stringent mask policies, healthcare-associated infections decreased significantly. Another study published in Environmental Science and Technology found that infectious virus was able to be retrieved from fabric masks, but not from surgical and N95 masks. When skin was pressed against the masks, only viral RNA was found (and no infectious virus). These studies provide additional evidence that masking is very protective, and should be implemented within healthcare and individual settings to prevent the spread of COVID.
CDC’s minimization of masking is also occurring in the wake of discussions to implement mask bans taking place across the country. Most recently, Los Angeles mayor Karen Bass expressed sentiments to ban masks, after people gathered to protest the illegal sale of Palestinian land. This took place shortly after New York Governor Kathy Hochul and New York City Mayor Eric Adams made similar announcements, as well as after North Carolina passed a new mask ban bill. This pattern of attempts to wrest masking from the people is a fascist tactic that aims to infringe both on our right to protect our health, as well as the right to protect ourselves from government surveillance. Check our No Masks Ban page for steps you can take, and spread the word to people you know — we’ve also created a printable flier you can circulate, which can be found at the bottom of the page: https://peoplescdc.org/no-mask-bans.
Wins
On June 27, 2024, the CDC’s Advisory Committee on Immunization Practices (ACIP) voted 11-0 to recommend the updated 2024-2025 COVID-19 and flu vaccines for all ages (6 months and up). Before this decision, ACIP was still deliberating on the updated vaccines’ eligibility criteria. Their decision to make it available for everyone was made possible thanks to all of you, who submitted public and oral comments. If you would like to read more about this achievement in depth, you can read our substack post about it.
After much opposition, New York City mayor Eric Adams’s budget proposal to cut $5.3 million in funding to Department of Health and Mental Hygiene (DOHMH) programs that prevent the spread of HIV/AIDS and provide free care programs for both the recently diagnosed and long-term survivors has been reversed. These essential services can continue for all New Yorkers.
Subscribe to our newsletter: People’s CDC | Substack.