
The Weather
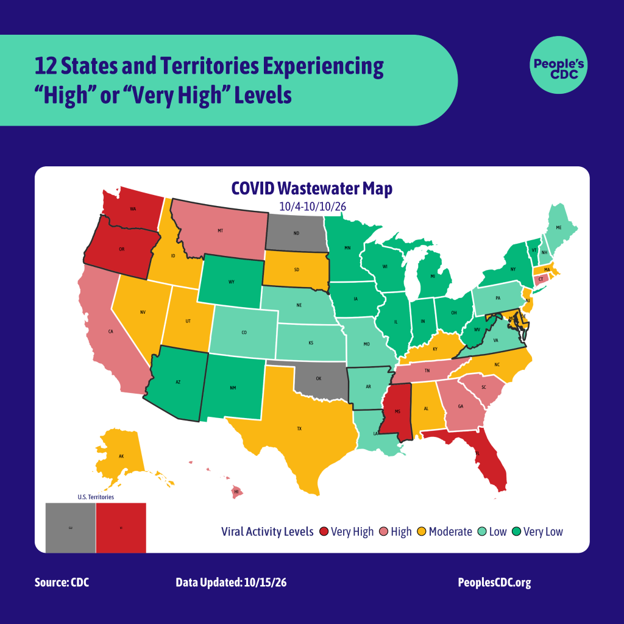
The CDC-based wastewater map was updated on October 15 and depicts wastewater levels for the period from October 4 through October 10.
According to the CDC’s COVID Wastewater Viral Activity map, Mississippi, Washington, U.S. Virgin Islands, Oregon, and Florida are experiencing “Very High” levels. Tennessee, Montana, Hawaii, Georgia, Connecticut, South Carolina, and California are experiencing “High” levels. 14 states are experiencing “Moderate” levels, 10 states are experiencing “Low” levels and 13 states are experiencing “Very Low” levels.
Arizona, Arkansas, Maryland, Mississippi, Montana, Oregon, South Dakota and Virginia are experiencing “Limited Coverage,” meaning that the data is based on less than 5% of the population and may not be accurate for the entire state. Oklahoma, North Dakota, Guam and Washington D.C. are reporting “Limited/No Data.”
Regional trend data from the CDC indicate a sharp decrease in Wastewater levels in the West which traversed the entire range of the “Moderate” tier in the past few weeks, falling from just below the “High” category to its current position of just above “Low.” The Northeast and Midwest have undergone more subtle decreases — from “Moderate” to “Low,” and from high point in “Very Low” to a slightly lower one in the same tier respectively. Levels in the South are experiencing a sharp increase to the upper portion of the “Moderate” tier, pushing the country wide average levels into “Moderate”.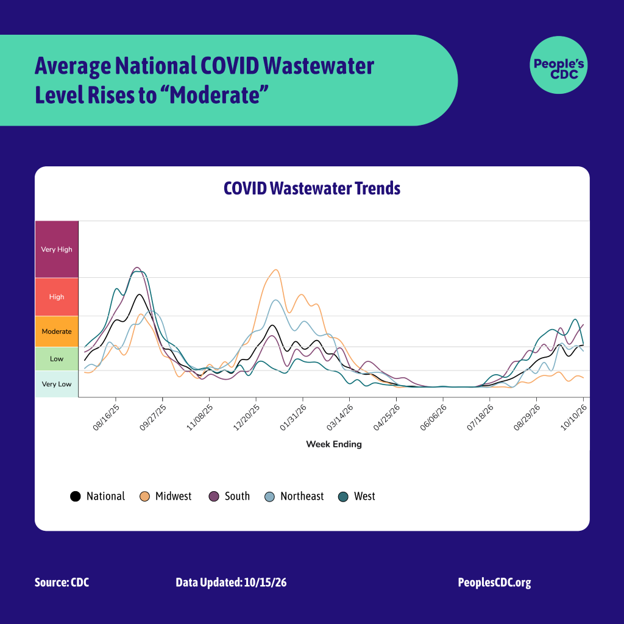 Graphic source: CDC
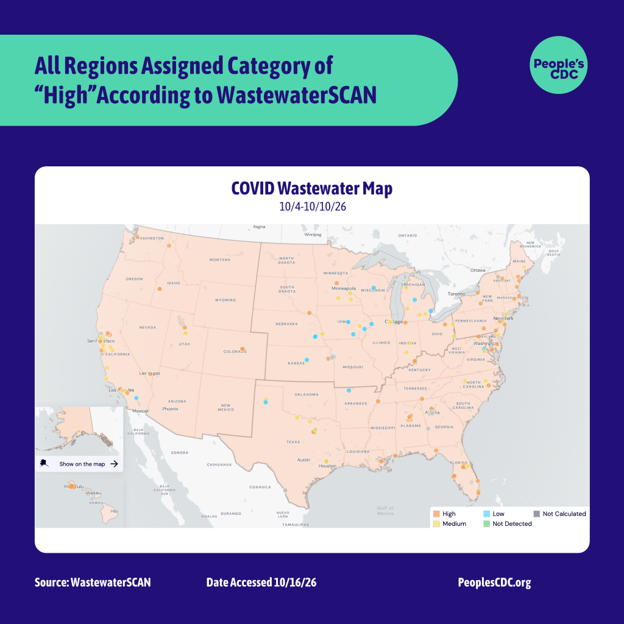
As a reminder, these categories should not be thought of as corresponding to any person’s risk of catching COVID. Remember other scientists can look at similar data and, using different systems, come to alternate conclusions. At Wastewater SCAN, for example, the team has determined all regions to be in the “high” category.
 Graphic source: Wastewater SCAN
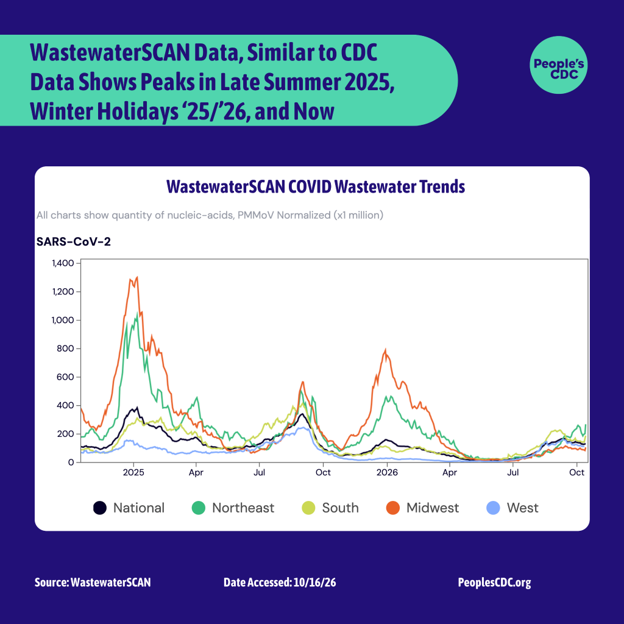
Though CDC and WastewaterSCAN differ on what levels they choose to label as “High” vs “Low,” when referencing the graphs for the past few surges, both data sets tell similar stories. In both CDC and WastewaterSCAN’s data we see surges in late summer of 2025, in the winter holidays between November 2025 and March 2026, as well as a surge right now. Though there is some variation. WastewaterSCAN data shows the highest peak in national levels for this current surge has already surpassed the high point during the surge associated with the 25’/26′ winter holidays. CDC readins show the highest national point in this current surge as ~73% as high as the highest point from the 25’/26′ winter holidays.
Both data sets show that national levels from the surge of late summer 2025 were higher than the surge of the winter holidays 25’/26’. WastewaterSCAN shows the highest peak in our current national readings as ~43% as high as the highest national peak in late summer of 2025. CDC shows the highest peak in our current national readings as ~51% as high as the highest national peak in late summer of 2025.
When reading wastewater data it is important to examine the graphical representation of the data over time rather than reading the subjective/qualitative label of “High, “Low,” etc that is applied by an organization or researcher. It is critical to think of this current surge and its relation to prior events. In this case the current surge we find ourselves in is either more severe (WastewaterSCAN) or about 73% as severe (CDC) as the surge of the 25’/26’ winter holidays, when considering national levels. We should all be masking with an N95/KN95/KF94 or better in all public indoor spaces to keep levels down generally. The wastewater levels that we are experiencing right now are some of the highest that we have experienced in the past 24 months, but not as high as the national levels that we experienced in late summer 2025 or in the winter holidays of 24’/25’. From our current place in the surge, these levels could still grow. Now is a good time to take additional precautions to prevent the current levels from increasing further.
It is also very important to look at data for your specific region. When looking at the WatewaterSCAN data, although our highest peak in national data in this current surge is higher than the highest national level from the winter 25’/26’ surge, the highest peak in the midwest from the 25’/26’ surge is notably ~4.75 times higher than our highest national level from this surge. In CDC data, the highest point in the midwest from winter 25’/26’ is ~2.35 times higher than our highest national level in this current surge.
 Graphic source: Wastewater SCAN
To find the most relevant data to your area and get even more specific than your continental region or state, check out the wastewater station in the city that’s nearest to you. For example, for someone living in Detroit, MI, by searching your state in the “Location” section of the WastewaterSCAN graphs page, one finds that the nearest wastewater treatment plant that is reporting right now is in Warren, MI. If we look at the levels over the last year from the Warren plant, we see that they are not nearly as low as they were through most of the spring and summer, but lower than they were last year at this time and not nearly as high as they were last winter.
Higher or lower wastewater levels do not dictate whether or not a person will catch COVID when taking no precautions. Without a regular masking, vaccination and testing practice, an individual’s risk of catching COVID is still higher than one who does have practices in place, even when the readings are low for their area. When wastewater levels in our area are growing, it is important that we each use more layers of protection such as — becoming more rigorous with our masking practice, air purification, ventilation, moving events outdoors, contact tracing, and more frequent PCR, NAAT and rapid testing in order to interrupt the spread of would-be infections from higher levels of virus in our immediate population. The better we do, collectively, at stopping the spread in these moments, the less likely we are to have bigger surges.
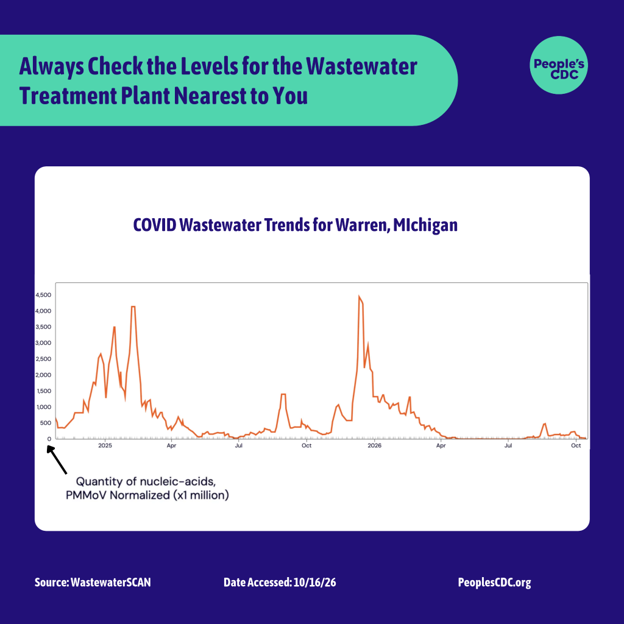 Graphic source: Wastewater SCAN
Please check out our Safer Gatherings Guide, which you can use for class, work, haunted houses, and any other gathering you may attend.
Epidemic Trends
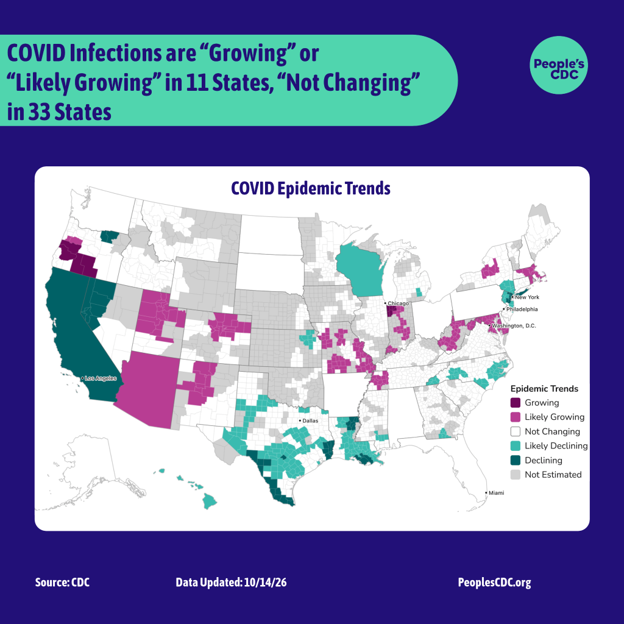
According to CDC Epidemic Trend data, there is a probability that the number of infections is “Growing” or “Likely Growing” in 11 states, “Declining” or “Likely Declining” in 7 states and “Not Changing” in 33 states. There are no full states that are “Not Estimated.” Check out the estimation for the specific region of the state you are in, as it may differ from the estimation for the state as a whole.
These values are estimated from daily incident emergency department visits reported through the National Syndromic Surveillance Program. It can tell us whether a current epidemic trend is growing, declining, or not changing, and is an additional tool to help public health practitioners prepare and respond. It cannot tell us about the underlying burden of disease, just the trend in infections. An Rt < 1 does not mean that transmission is low, just that infections are declining. They could be declining from a high level to another slightly lower high level.
Wins
On October 14th, Verily Health Inc announced the CDC’s renewal of their Wastewater contract. The CDC’s National Wastewater Surveillance System will continue! This contract’s renewal is no doubt a product of all of our calls to congress and to our representatives!
CDC also announced the new wastewater testing contract on the National Wastewater Surveillance webpage and says that there will be a brief gap in data “that will affect ~200 sites as sampling, testing, and reporting are restarted.” We will continue to keep you posted as we learn more.
MAHA Updates:
The Senate HELP committee voted to advance the nomination of Radiologist and FOX News pundit Nicole Saphier to a senate-wide floor vote for Surgeon General. Dr. Saphier claims to be vaccine-supportive, but has also failed to say publicly that the vaccine-related policies and positions advanced by the Trump administration are wrong. Additionally she has praised RFK’s removal of the full recommendation of the COVID vaccine for children and an opponent of gender-affirming care, she has referred to being transgender as a “national emergency.” See our “Take Action” section for ways to reject Saphier’s election to Surgeon General.
Measles:
The importance of being crystal clear about the safety and efficacy of Measles vaccines has never been greater. As a result of misinformation and disinformation campaigns and the consequential decreased uptake of vaccines, measles rates continue to climb.
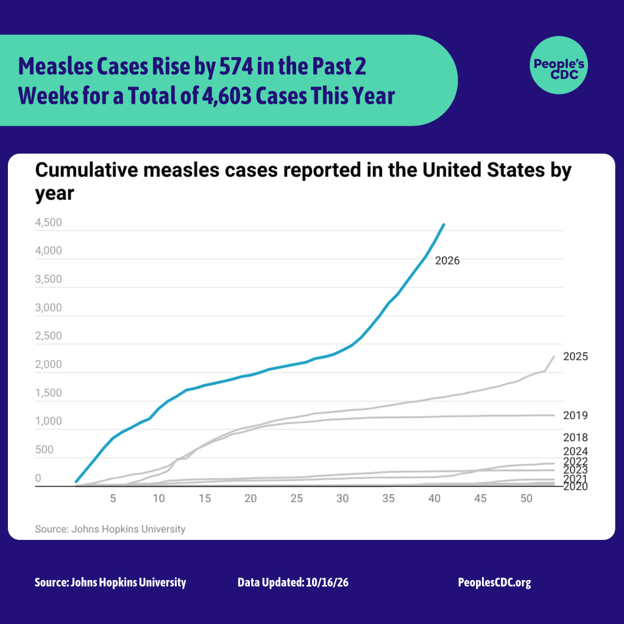
In the past two weeks the US has seen 574 new measles cases due to increases in 4 cities — Lancaster, Mifflin, and Chester, Pennsylvania, and Lafayette, Wisconsin. The state of Pennsylvania has accepted help from the CDC where their state Secretary of Health Debra Bogen has accused CDC director Erica Schwartz of not recording all of the deaths that are occurring. “By not acknowledging the deaths, the CDC obscures the seriousness of this disease and the toll of measles across the U.S.,” Bogan wrote in a letter to the CDC director.
Of every 1000 kids who get measles, 1 to 3 will die. We must also acknowledge the severe complications that can come from non-deadly cases of measles, such as pneumonia, encephalitis, premature birth or low-birth weight babies, immune amnesia, and in rare cases subacute sclerosing panencephalitis (SSPE) which is fatal 7-10 years after a measles infection. Measles is spread through direct contact with infectious droplets or through infectious aerosols. We can do our part to prevent spread by getting vaccinated, washing our hands, and… you guessed it! Masking with an N95/KN95/KF94 or better!
Take Action!
Reject Nicole Saphier for Surgeon General!
Call your senators and ask them to oppose Nicole Saphier in the senate-wide floor vote for Surgeon General. She is transphobic and has expressed flip-flopping views on vaccine efficiency. She quite literally wrote the book on MAHA with her 2020 title Make America Healthy Again: How Bad Behavior and Big Government Caused a Trillion-Dollar Crisis, a book which puts the blame on the American individual’s choices, such as eating, drinking alcohol, and sitting rather than on ultra-expensive health insurance, high cost of living, and corporate pollution for the prevalence of cardiovascular disease and cancer. The book’s description on Harper Collins reads “If Americans want to know why their health care is so costly and getting costlier they need only look in the mirror. […] We don’t need socialized medicine—we need to take better care of ourselves.” Notably, as a remedy for Americans “[not] tak[ing] care of [them]selves,” Saphier has created a dietary supplement company called DropRX which last year reported $270,605 in revenue. Both she and her husband also invest in large tobacco companies. Senators must reject this Surgeon General who blames Americans for being unwell in order to profit from them.
Organize in Your Community and Make Our Next Wins Section!
Talk to your friends and the people that you interact with every day about organizing. Ask the other parents at your kid’s school if they want to have a few meetings with administrators to talk about improving air quality. See if your colleagues want to join a call to speak with your union representatives about pushing for reinstating additional paid sick days for folks with COVID and a testing-based approach to returning to work. Coordinate a masked karaoke event for your tenants association. Write to us about what you’re working on, so we can celebrate you in our next “wins” section!