
The People’s CDC supports people the world over who wonder whether, when, and how to change their lives during the COVID-19 pandemic. Our “Weather Report” updates aim to shed light on the COVID-19 situation in the United States.
The Current Situation – “The Weather”: Overall, we are beginning to see signs of increasing cases in many parts of the country. However, testing data now undercounts cases, so there are probably many more cases than we are counting.
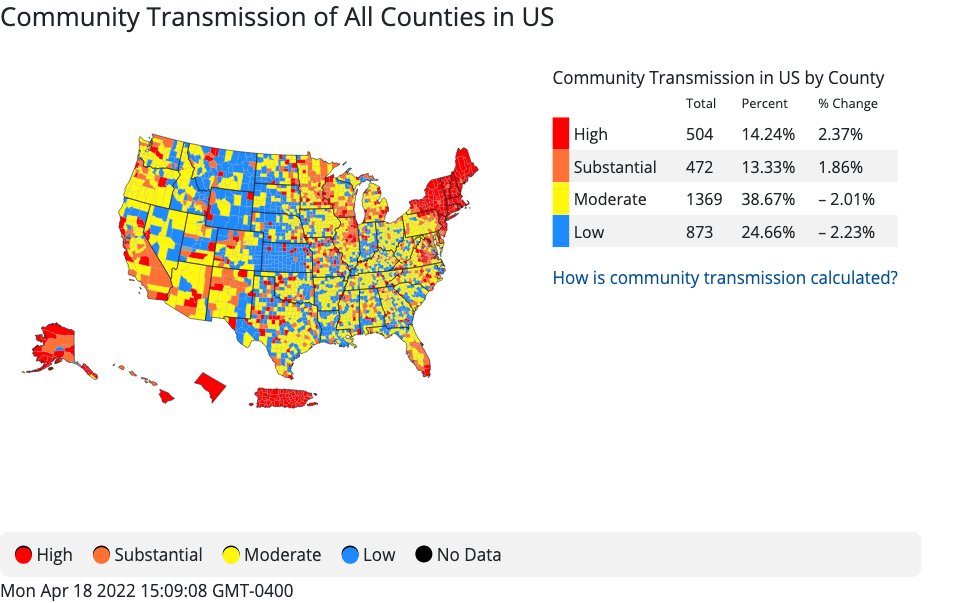
Using the former CDC transmission levels, which still have limitations, we see high levels of transmission in the Northeast and areas of the Southwest, including New Mexico & Arizona.
Wastewater surveillance may give us additional information. It doesn’t rely on access to testing and it doesn’t miss data from home tests. But it isn’t collected everywhere yet, including in rural areas.
Wastewater data shows a clear increase over the past few weeks…
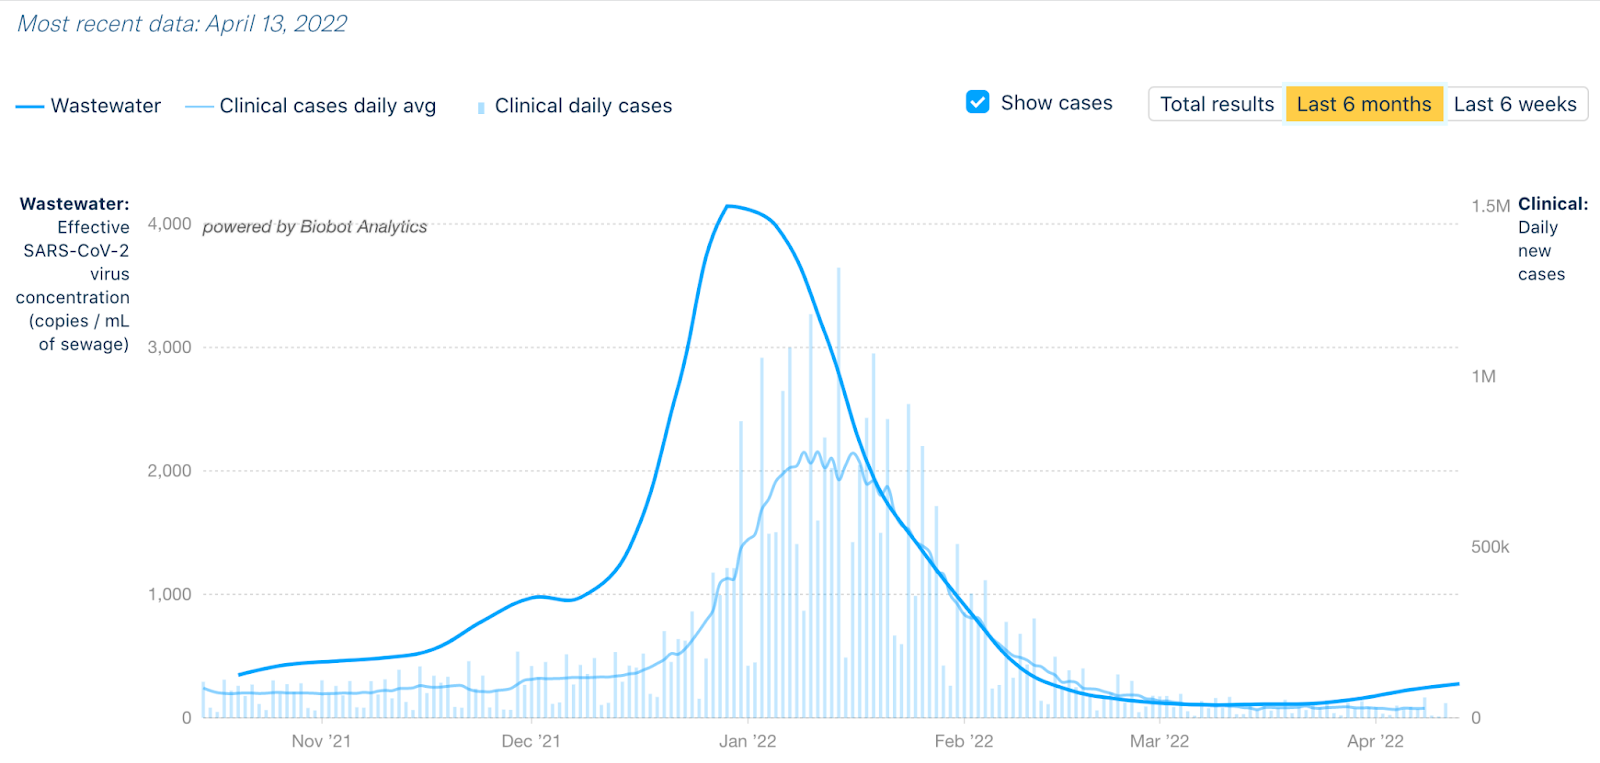
…particularly in the Northeast (yellow/top), where levels are the highest nationally. However, all regions now have increasing levels.

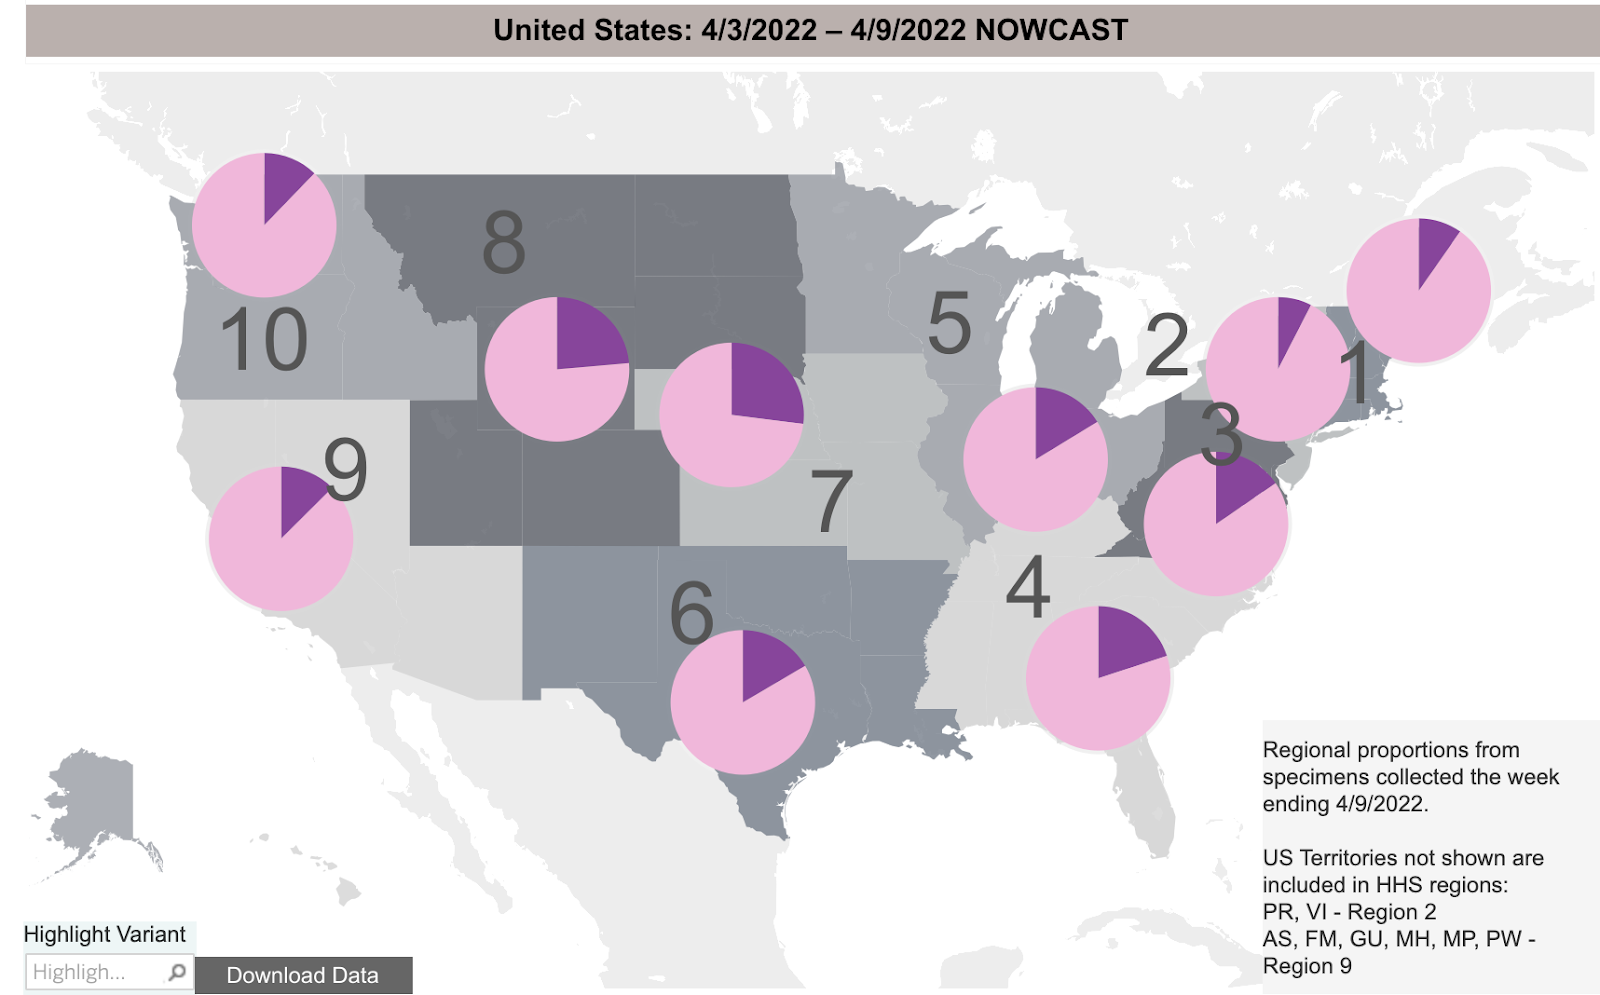
BA.2, a newer variant of Omicron, now makes up almost all cases across the U.S. (The CDC estimates 86% overall) – BA.2 in light pink and the original Omicron variant in purple.
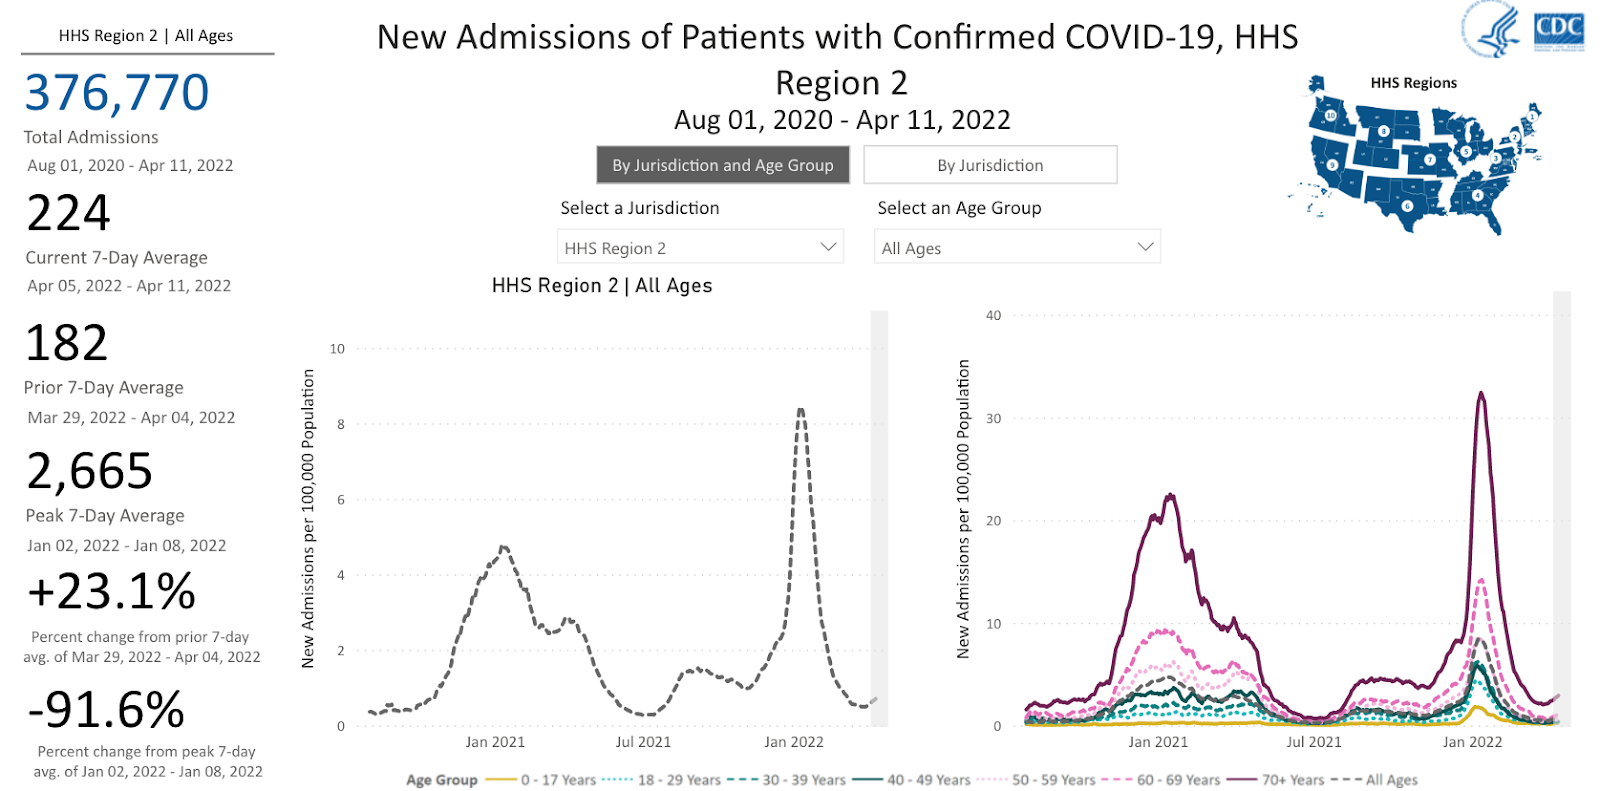
Hospitalizations are a lagging indicator – they tell us who was infected 2-3 weeks ago. Across the entire U.S., hospitalizations have come down greatly since the winter peak but are now flat…
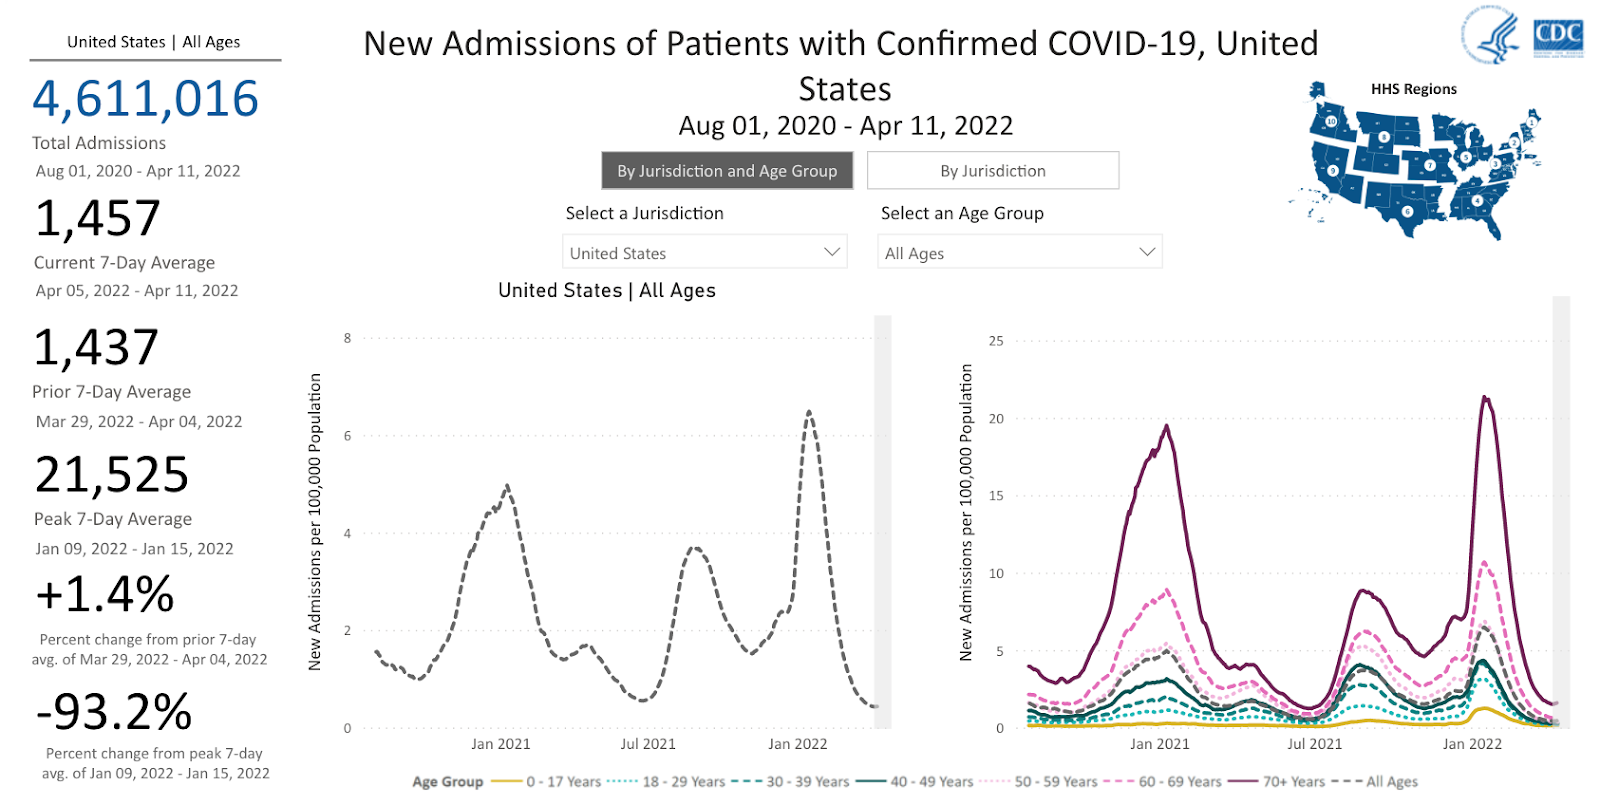
…or increasing, as shown here in the Northeast.
Last week, 2,597 people died of COVID-19 in the U.S. The U.S. is forecast to soon pass the one millionth known COVID Death in the United States.
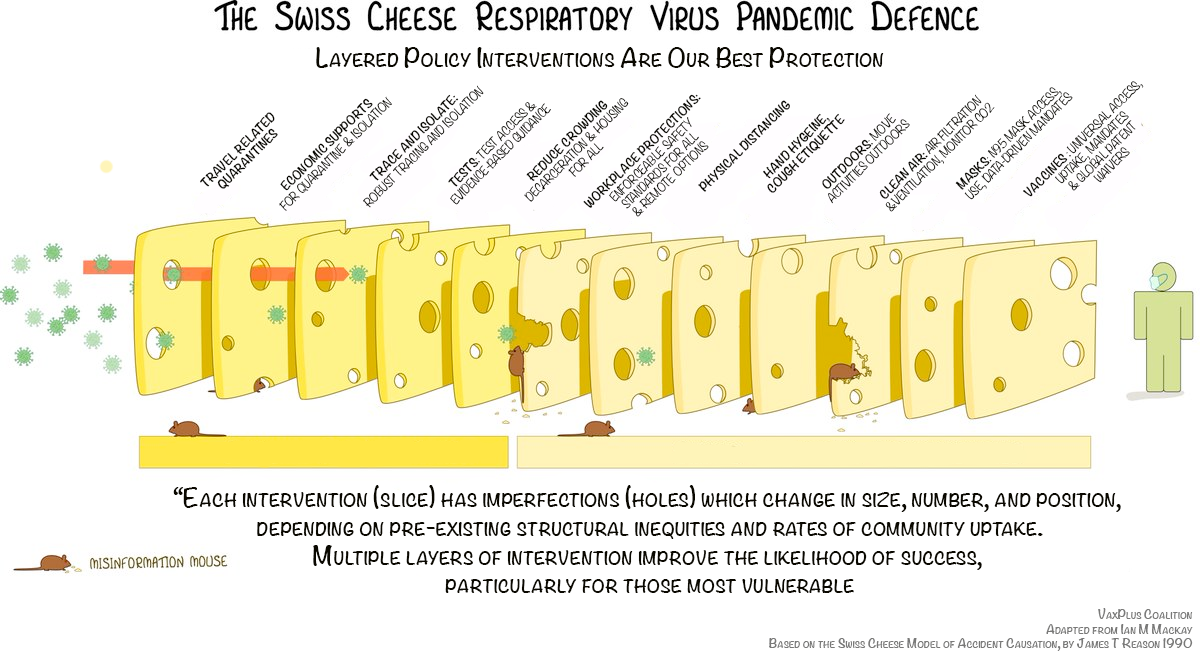
Be prepared, whatever the weather: Activities that share space with others carry some level of risk – this risk increases as cases rise. Using additional layers of protection when cases are rising helps you & your community stay safer!
Up-to-date vaccinations provide great protection against severe illness & death. They also reduce – but don’t completely stop – infections & transmission. For folks who are immunocompromised and those over 50, a 2nd booster is now recommended.
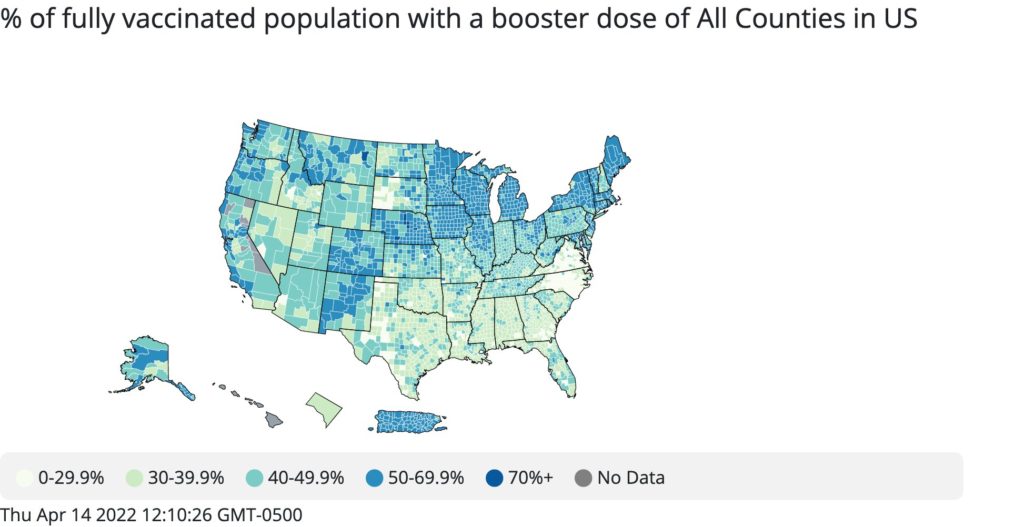
Vaccination rates are still low across the U.S.; only 45% of vaccinated people have their first booster and many of these shots are more than 4 months old, which means effectiveness is waning. No child under 5 is vaccinated.
Forecast: The US is unprepared to detect and deal with increasing cases. Many programs that cover costs of vaccines & testing have ended. Fewer people can afford tests & vaccines. This will undoubtedly lead to more spread and worse data.
Mask mandates for planes, buses & trains were set to expire today, but have been extended for two weeks! Masks on public transportation are crucial to protect everyone who uses them; removing this mandate will unfairly put the most vulnerable at even higher risk.
Though we expect an increase in cases related to BA.2 and reduced mitigation measures, we also expect that “official” messages coming from the White House and CDC will continue to minimize COVID spread and COVID impact.
The new CDC guidelines to reinstate masks & other protections will not be activated until hospitals are already full. However, thanks to public pressure, leaders in Philadelphia are bringing back mask mandates.
Tiny Tip: Many people got COVID over the winter & may think this will protect them against another infection. Unfortunately, this is likely not true. Early studies are finding low levels of antibodies after Omicron infections.
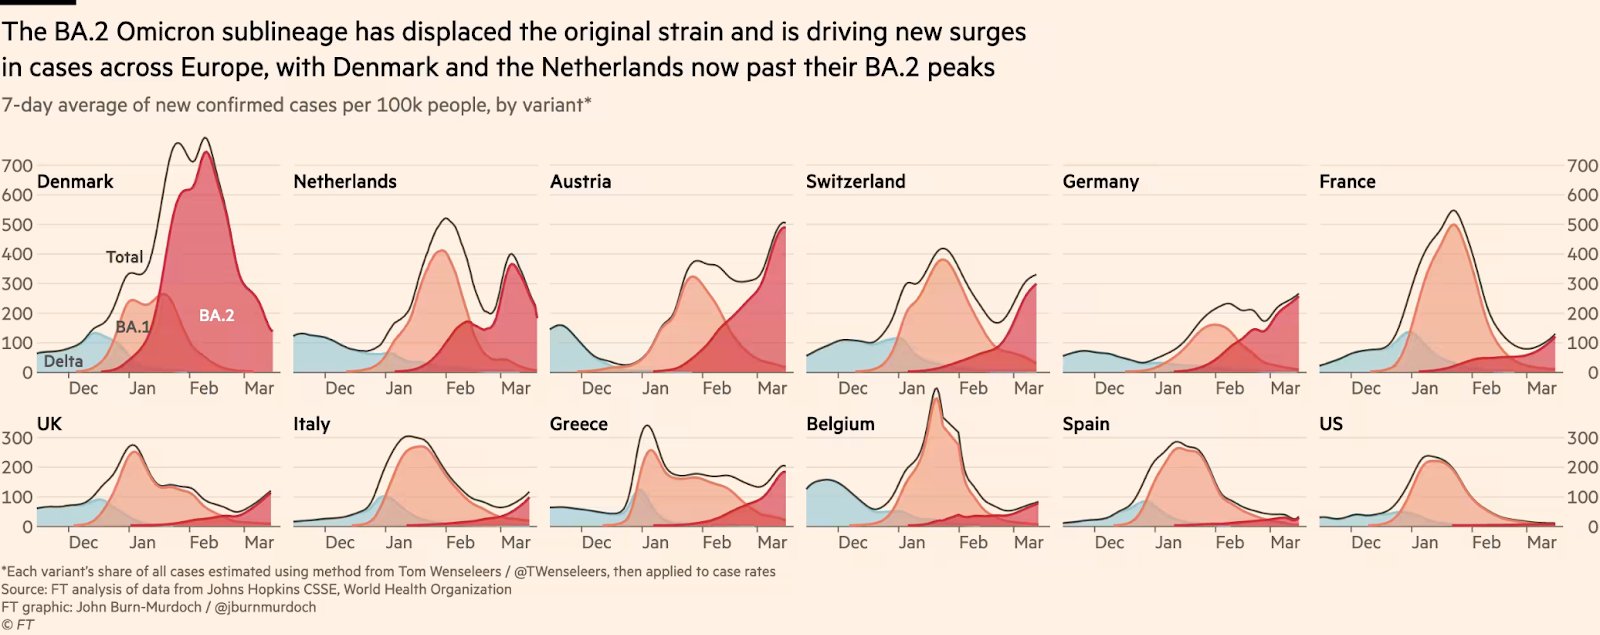
We also saw large BA.2 peaks in many European countries that just had large Omicron winter surges. The best plan is to stay up-to-date on vaccinations, keep masking and layer protections!
A final note: many noticed our recent op-ed in the Guardian and are interested in joining in the work. You can sign up to get more info here: http://join.peoplescdc.org/.