
April 25, 2022
The People’s CDC supports people the world over who want to know how to stay safer during the COVID-19 pandemic. Our Weather Report updates shed light on the COVID-19 situation in the United States.
The Current Situation – “The Weather”:
We continue to see increasing cases in much of the country. Testing data, wastewater data, & healthcare reports are each imperfect sources, but taken together they suggest we are in another surge.
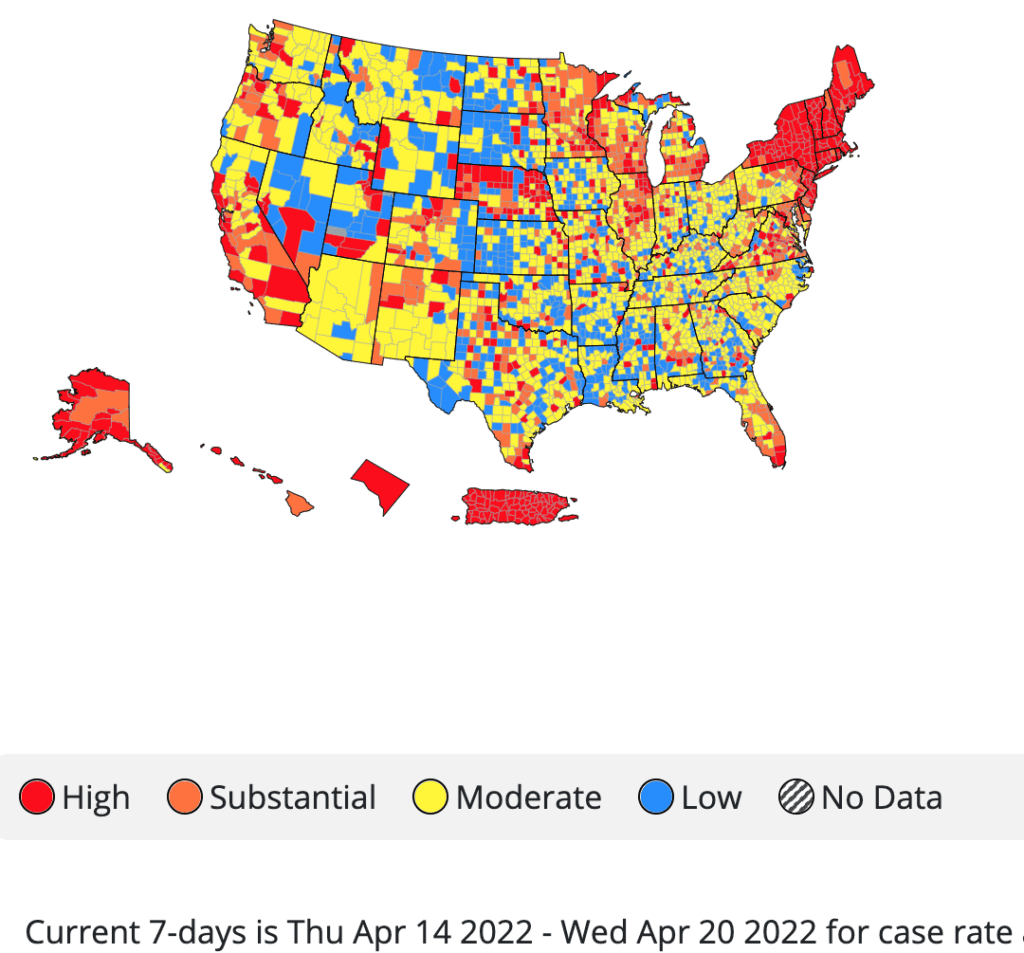
Using the CDC transmission levels (not the hospitalization-focused “Community Levels”), we continue to see high case levels in the Northeast. Cases are high throughout parts of the Midwest & West and will likely continue to spread.
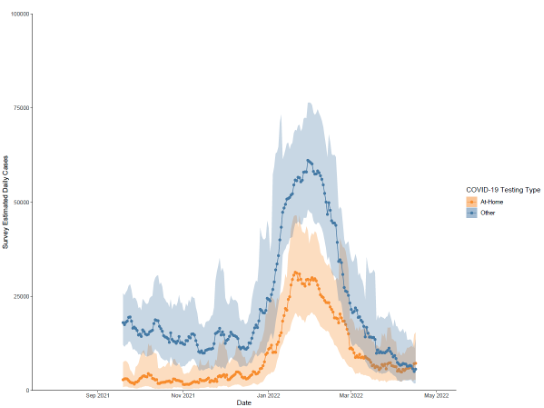
A report this week showed, for the first time, that more people are testing with at-home rapid tests instead of PCR tests. Many public health departments do not collect home test results, meaning we are likely missing many cases.
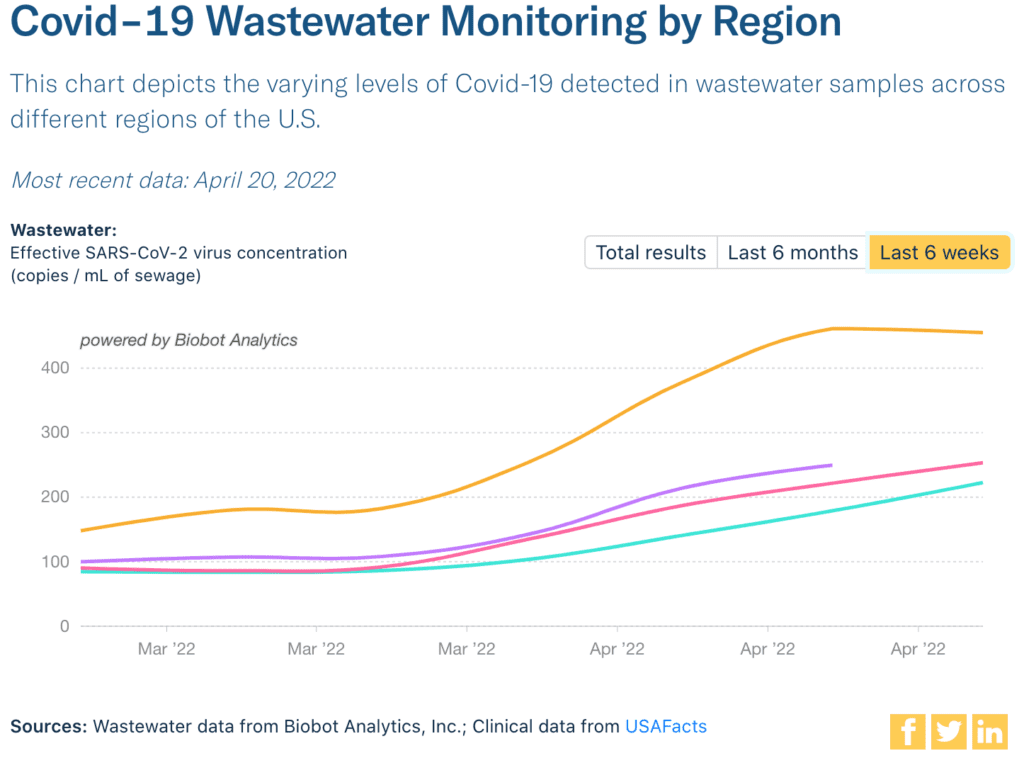
Wastewater data does not rely on testing. Northeast levels (yellow/top) are high but stable. The rest are rising (South=pink/middle, Midwest=purple/middle, West=green/bottom). Nationally, levels are similar to the start of the Delta surge.
Just as BA2 (pink) finished taking over the US, a new type of BA2 – called BA2.12.1 – has shown up (red). It is particularly common in the Northeast, where we’ve been seeing the most cases.
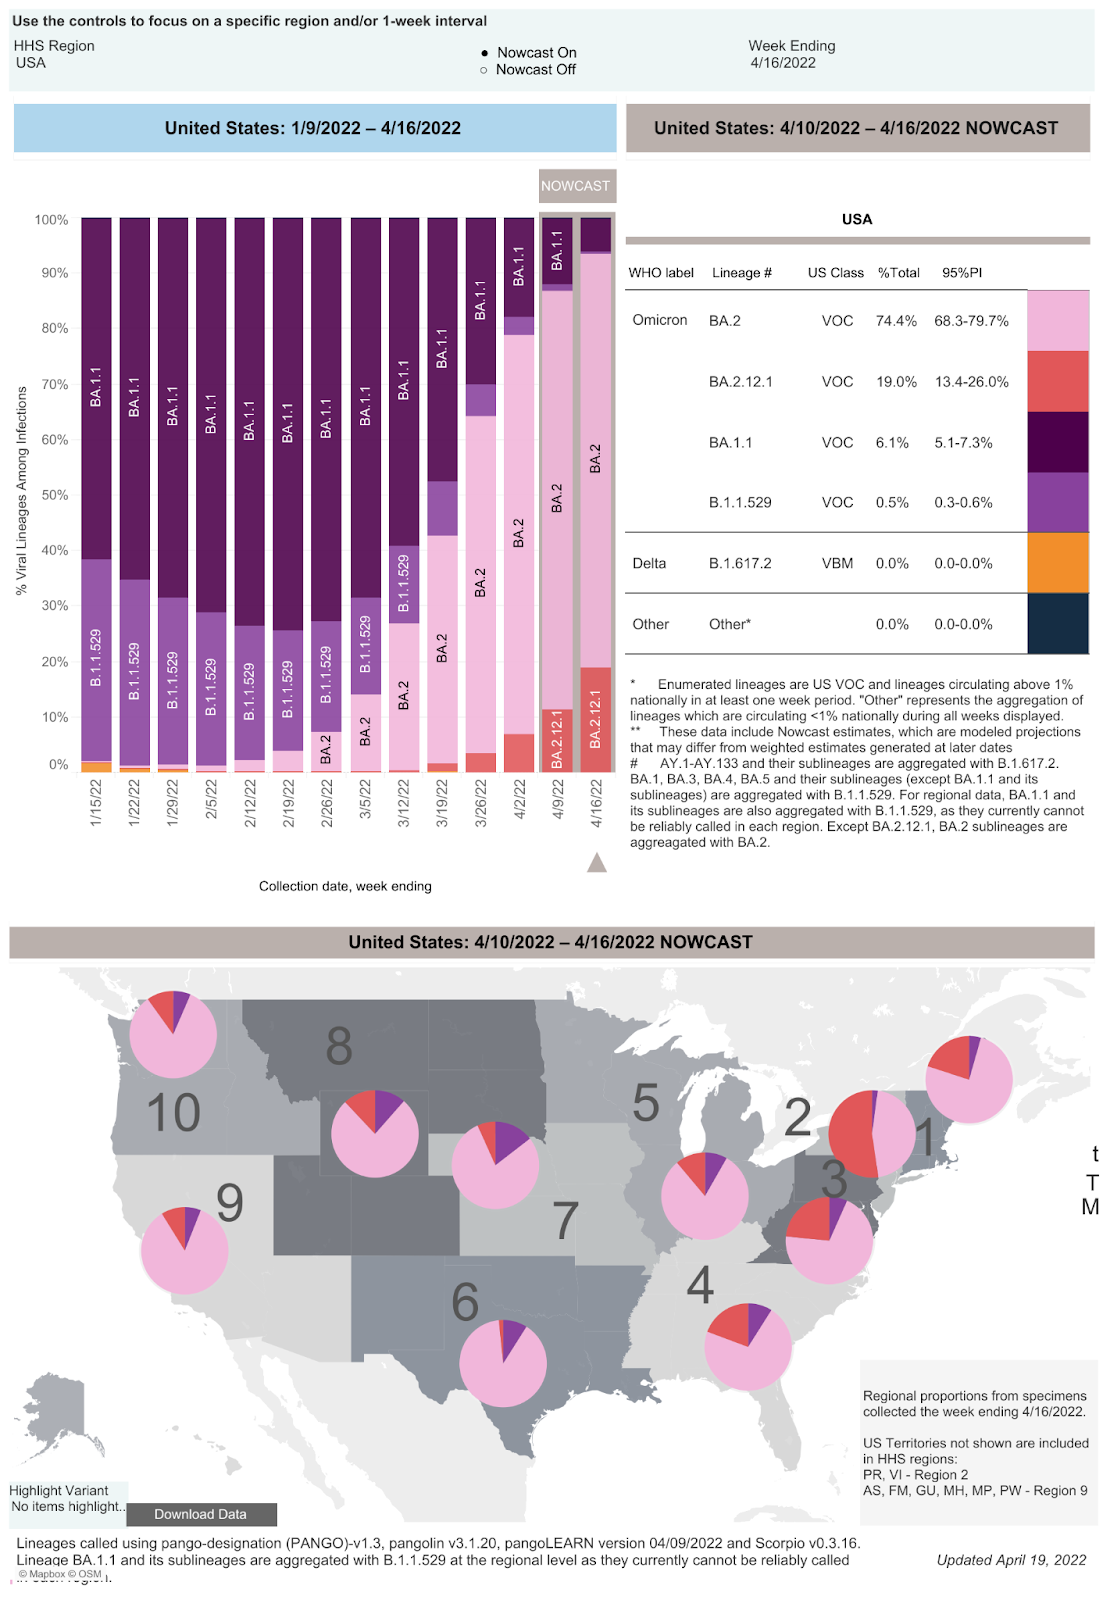
As protections have disappeared around the world, we are seeing many more variants & subvariants. While they can spread faster & can outcompete earlier strains, we don’t know yet if they make people sicker. We’ll keep you updated!
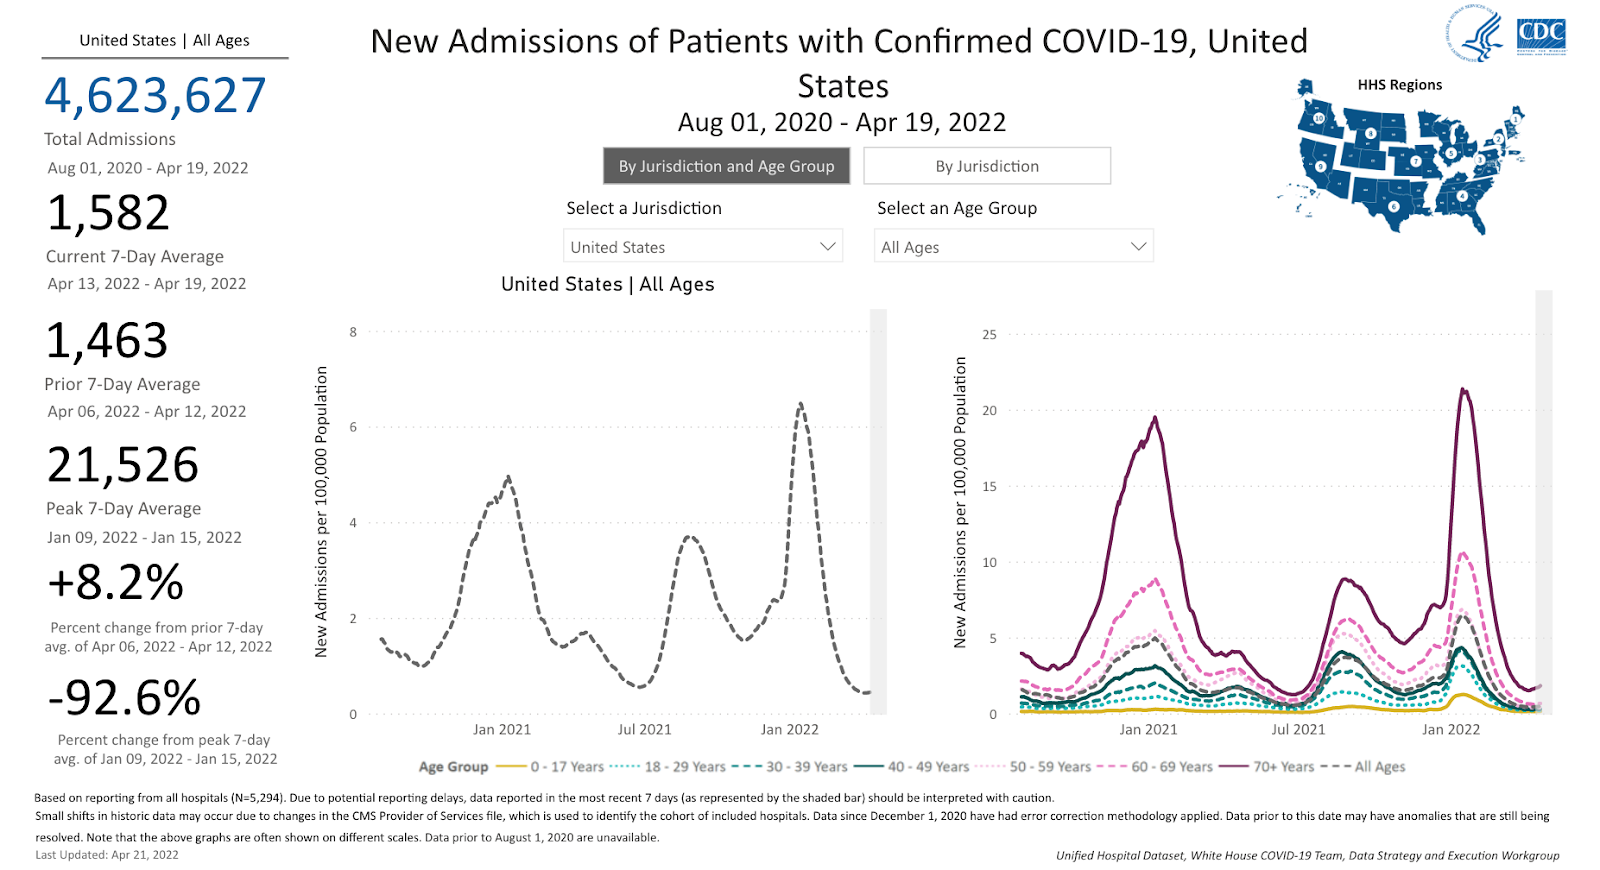
Hospitalizations are a lagging indicator of who was infected 2-3 weeks ago. Nationally, hospitalizations have stopped declining & are slightly increasing, especially among those over 70 years old & in the Northeast & Pacific Northwest.
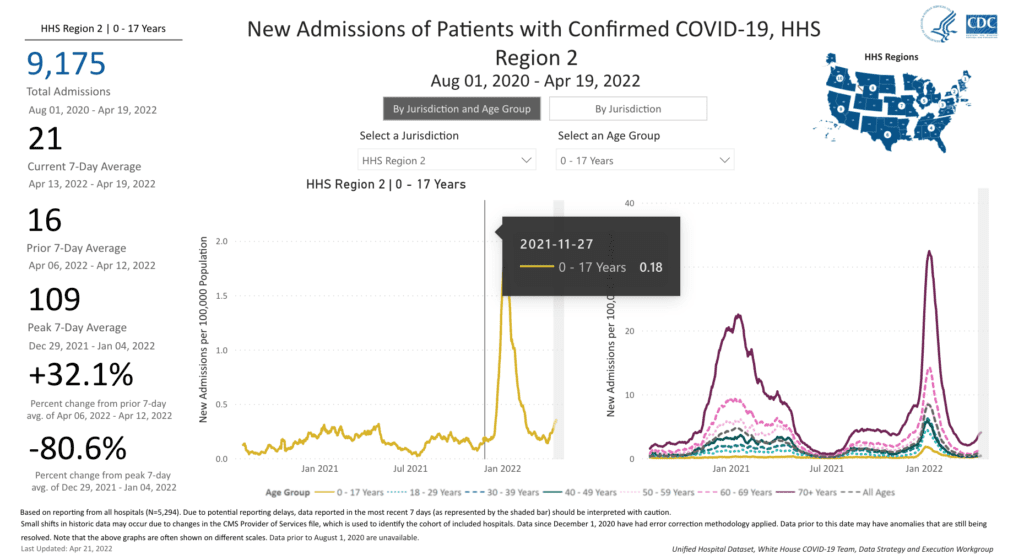
In the Northeast, it is worth noting an increase in hospitalizations among children (under 17 years old) as well:
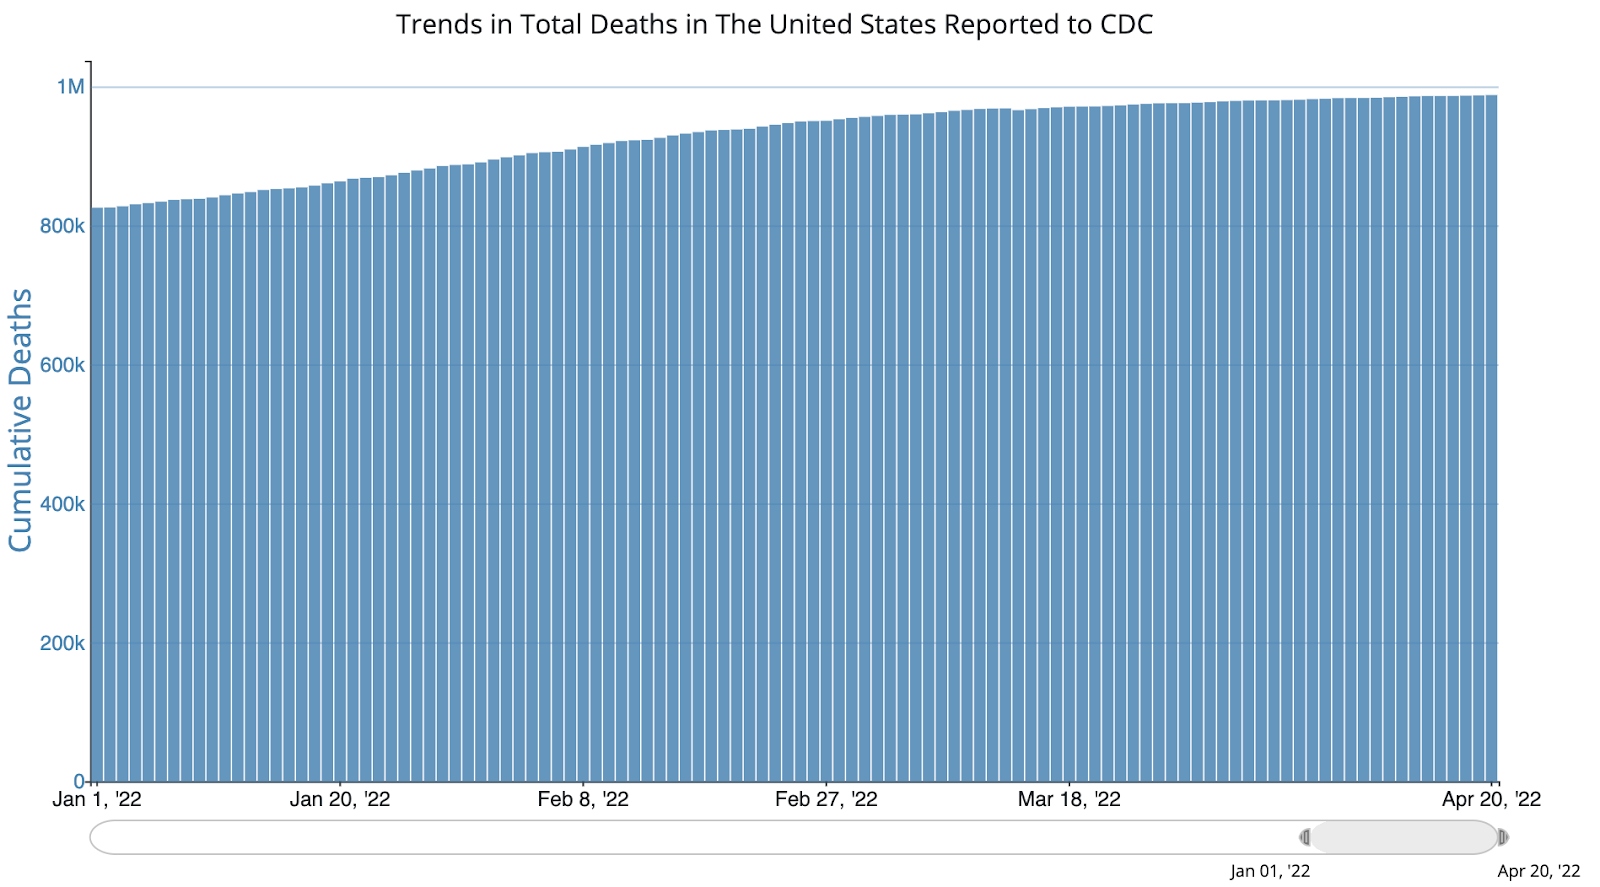
Last week, 2,631 people died of COVID-19 in the U.S. At least 162,000 people have died of COVID so far this year.
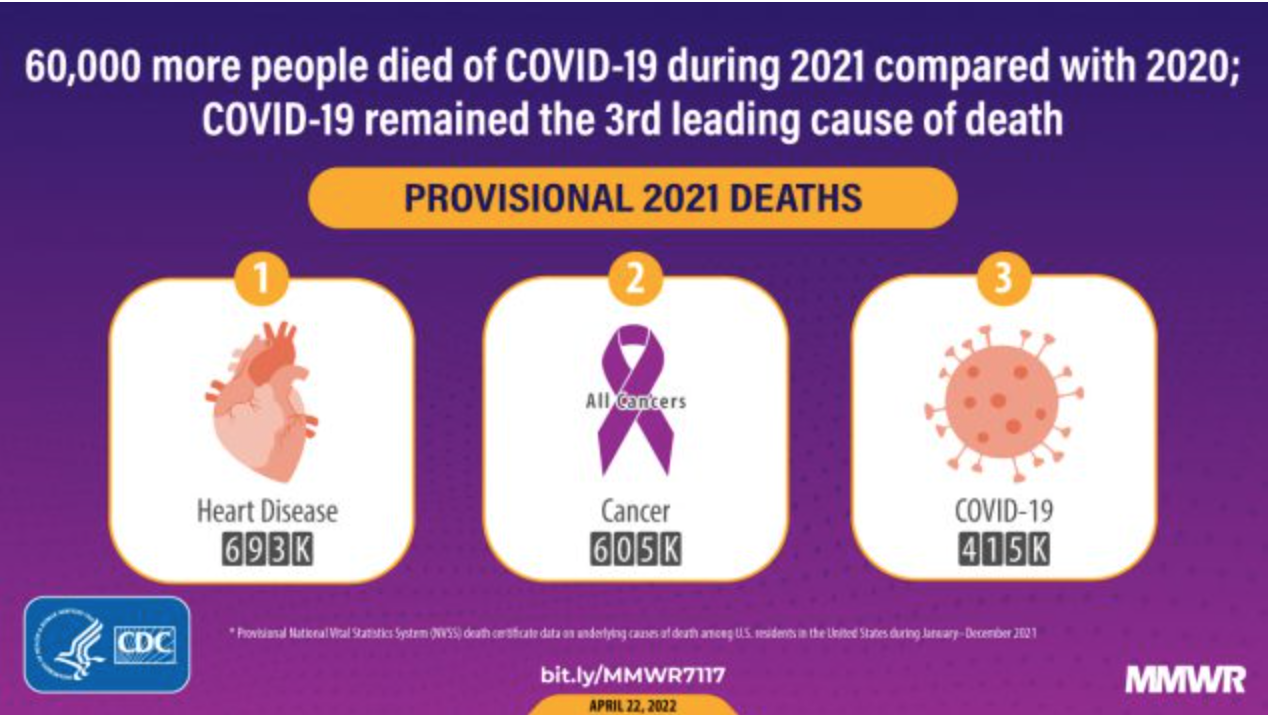
New data just released found that COVID-19 was the 3rd leading cause of death in 2021 for Americans.
Be prepared, whatever the weather:
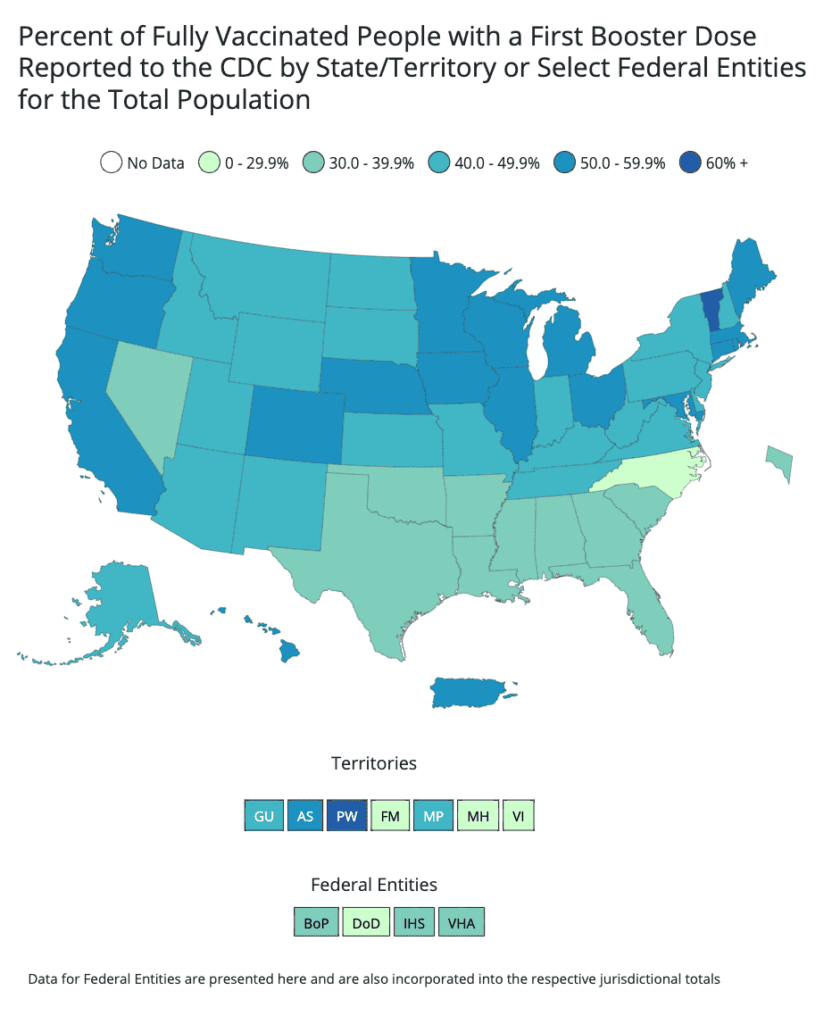
Vaccination rates are still low across the U.S.; only 45% of vaccinated folks have their first booster and many of these shots are more than 4 months old, which means effectiveness is waning. No child under 5 is vaccinated.
As spring break and spring holidays wrap up, be mindful that you and those around you may have been unknowingly exposed to COVID– especially at indoor, mask-optional gatherings.
Use all the layers you have available in the weeks to come in order to protect you and others. That might* include minimizing the number of people you encounter, especially indoors; using N95, KN95, or KF94 masks (projectn95.org); opening windows; using air filters (cleanaircrew.org); or using mutual testing.
*The People’s CDC recognizes that racist, ableist, profit-centered systems (and the political realities that uplift them) leave many without access to all layers of protection. We must protect ourselves and our communities by fighting for protective measures for all.
Forecast:
Though we have imperfect data about how much COVID is in our community, we do know that the recent holidays had many of us gathering and traveling. We expect that, as in the past, the holidays will bring increases in cases.
There has been lots of news & confusion on the federal mask mandate on planes, buses & trains. In short, a judge removed the mandate; many places stopped requiring masks. The CDC is asking for a new court decision. But most Americans want a travel mask mandate.
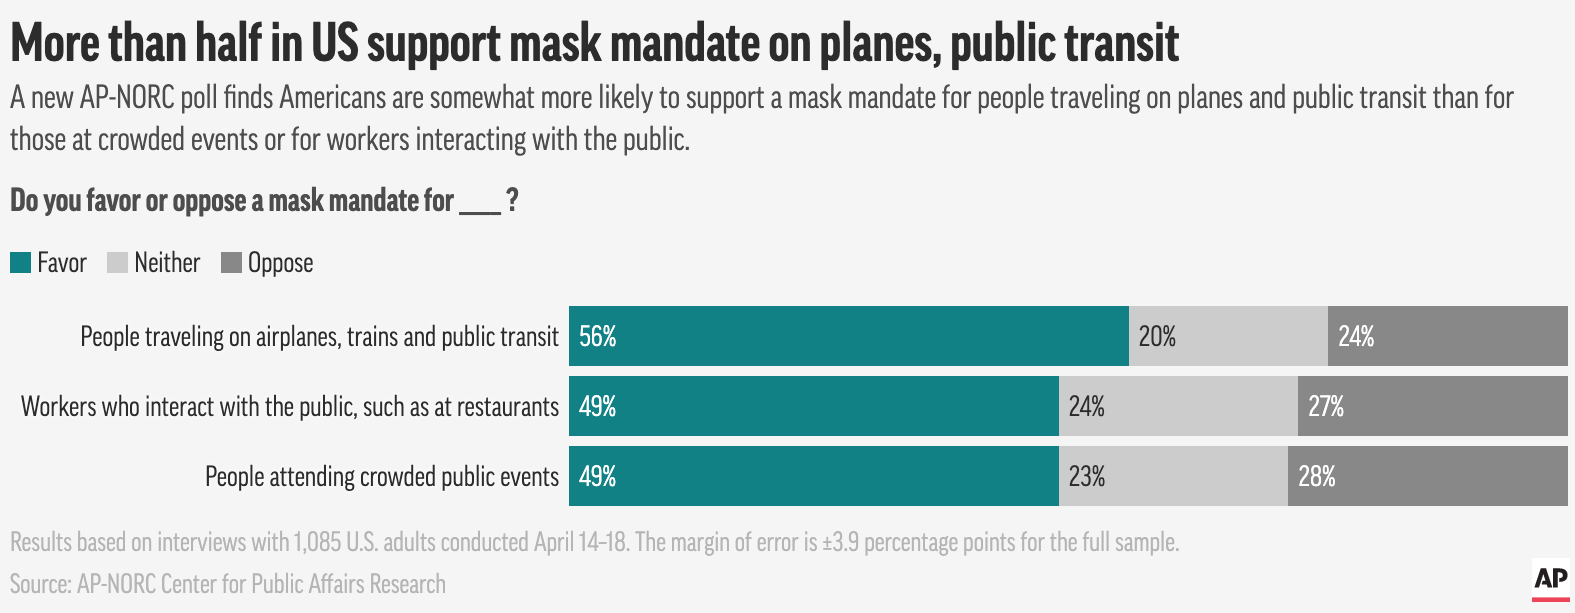
This is an important issue as so many Americans rely on buses & trains and need to keep themselves safe. You can read more here.
Also in the forecast, the US is soon to pass the one-millionth known COVID death in the United States. Join @MarkedByCOVID and others to hold a virtual vigil when that happens.
*On Long COVID*
As part of the PCDC’s Commitment to #LongCOVIDJustice, we will include a Long COVID update every week. You can commit to Long COVID Justice too!
Studies estimate that between 10-30% of people diagnosed with COVID have prolonged symptoms. Therefore, using the imperfect surveillance data from the CDC, we assume that between 30K-90K people will develop Long COVID from infections they acquired this week.
Tiny Tip: Mask mandates work. Check out our toolkit for action to demand the reinstatement of mask mandates on public transportation.