
The Current Situation – “The Weather”:
The US continues to experience a surge. The CDC transmission map shows almost 99 percent of people in the US at high/substantial transmission.
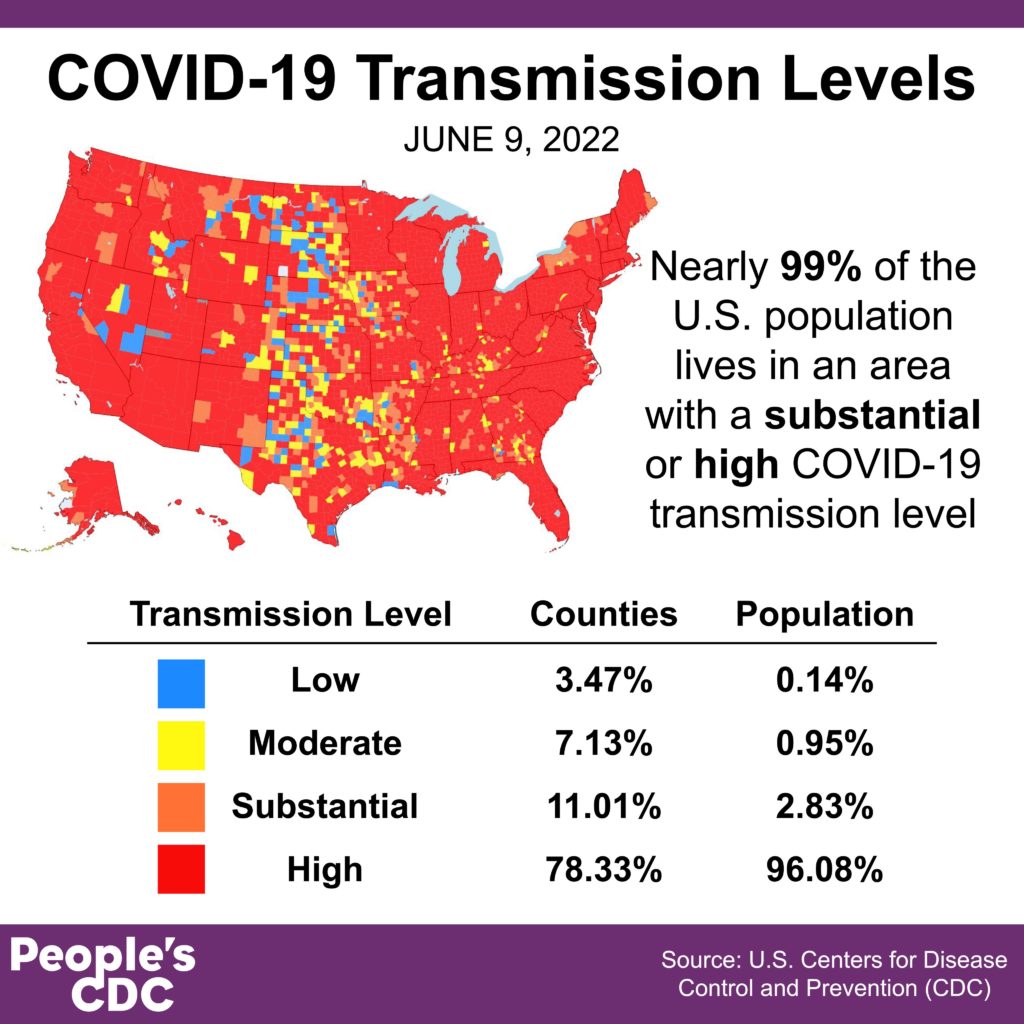
This video shows the evolution of 2022 transmission levels from March 15th – June 9th. After a brief lull in March, the Northeast begins turning red in early April and now most of the country is red.
On Variants:
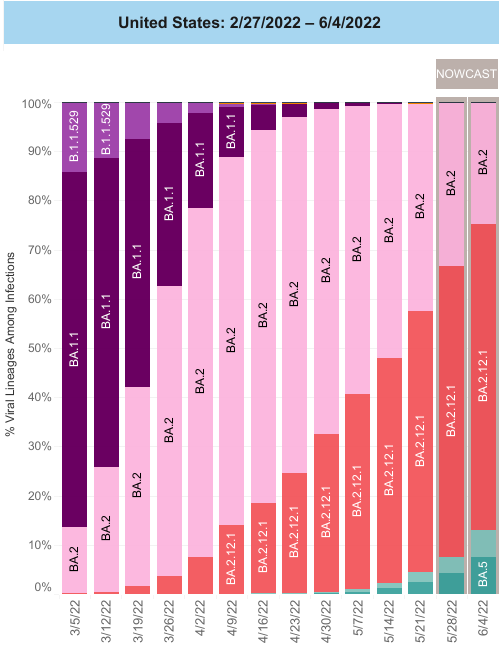
BA2.12 is still the dominant variant in the US, at 62%. BA4 & BA5 are shown in light & dark teal, respectively; BA4/5 are most common in the South & West currently. They are growing in prevalence; people with previous infections may not be protected from these new variants.
Wastewater Monitoring:
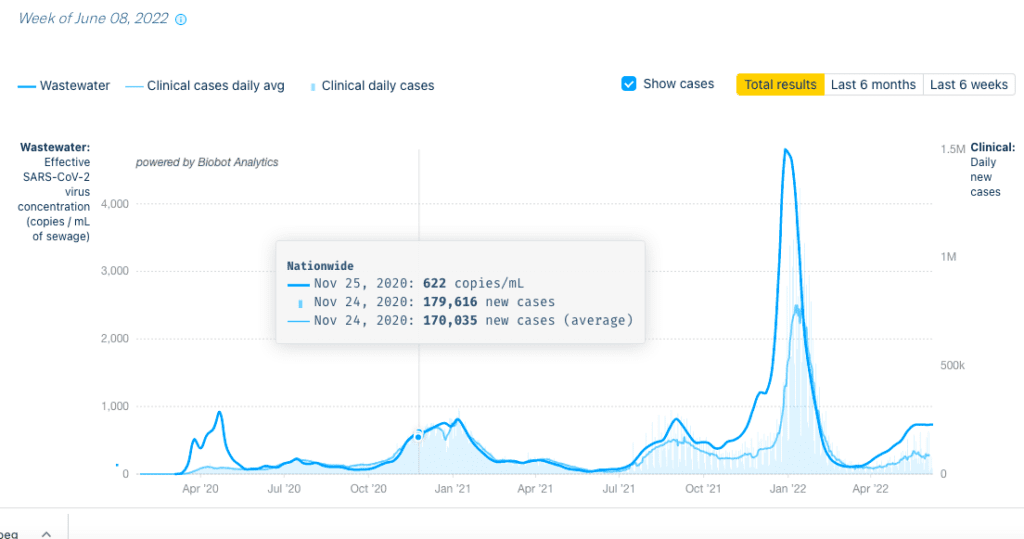
Wastewater is a useful metric that doesn’t rely on accurate case counts (& we know that covid cases are undercounted across the country). However, it is important this data is used in ethical ways.
Nationally, wastewater levels are higher than the Delta surge last fall. Levels seem to have plateaued.
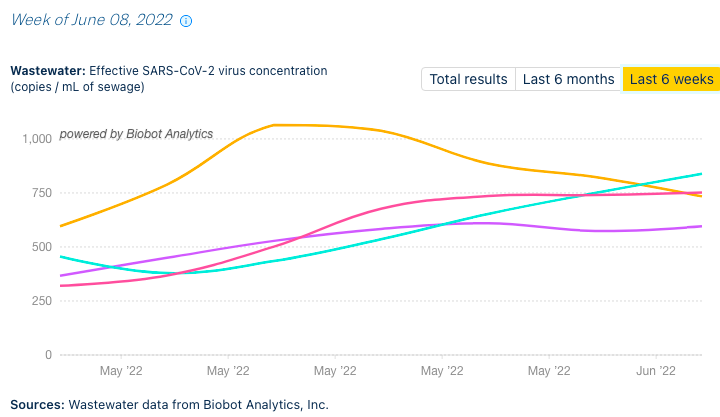
When we look at regional data, we see that the appearance of that plateau is attributed to a decline in wastewater concentration in the Northeast (yellow). Other parts of the country continue to rise, albeit slowly.
Hospitalizations:
For 7 weeks in a row, hospitalizations are rising nationally, though still at relatively low levels. Hospitalizations seem to have peaked in the Northeast but are rising in other regions.
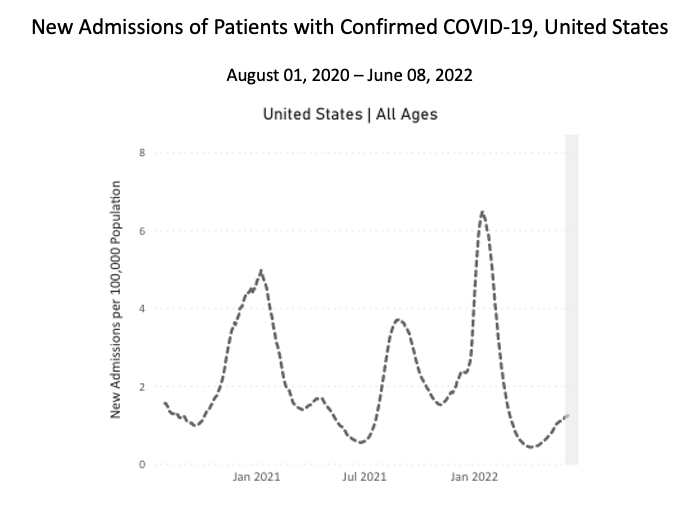
Hospitalization numbers, like testing and other metrics, have become harder to assess with changing definitions.
Deaths:
In the past week, from June 2 to June 8, 2174 people died of COVID nationally, up 27% from last week.
Again, remember that COVID deaths are also underreported.
Be Prepared, Whatever the Weather:
Inspired by this week’s episode of @DeathPanel_ fInspired by this week’s episode of @DeathPanel_ featuring @Theresa_Chapple – which we recommend checking out – we wanted to make a few things very clear:
- You can get COVID outside! If you’re at a crowded outdoor event, in a bustling farmers market, or playing pick-up basketball with friends, mask up wearing a high-quality mask.
- You can get COVID more than once. The virus changes rapidly, and there are multiple variants circulating at once, so reinfection with Omicron variants can happen frequently and within months of previous infection. There is no herd immunity to COVID because immunity wanes relatively quickly and vaccinated people can still transmit the virus. Other mitigation measures such as high-quality masks, good ventilation, updated vaccines & paid sick leave are necessary to slow transmission.
- Kids can get and spread COVID, and can be harmed by it.
Forecast:
There’s some vaccine news on the horizon. First, a new, non-mRNA vaccine met the first steps of approval, but data presented to the FDA does not tell us how this vaccine will perform against newer Omicron strains.
And keep your eye out for news about a new Omicron-specific booster, an important contribution since all other vaccines to this point were designed for the original strain and are less effective than they once were.
On Long COVID:
We want to say plainly that you can have a mild infection and still get Long COVID.
And, vaccinated people can also get Long COVID.
Tiny Tip:
As climate change continues largely unmitigated, we will continue to see spillover diseases like COVID and #Monkeypox.
Last week, the CDC released a resource about strategies to avoid Monkeypox at social gatherings and during sex which is wonderfully sex-positive.
But the CDC has been inconsistent when it comes to acknowledging the possibility of airborne transmission of Monkeypox, initially recommending masks, and then moving away from that recommendation.
They say the change was because of “confusion” caused by the recommendation. We suspect this change was political, and want to advance their original guidance:
“Wear a mask. Wearing a mask can help protect you from many diseases, including monkeypox.”
Sources (in order):
- https://covid.cdc.gov/covid-data-tracker/#county-view?list_select_state=all_states&list_select_county=all_counties&data-type=CommunityTransmission&null=Risk
- https://covid.cdc.gov/covid-data-tracker/#variant-proportions
- https://www.gavi.org/vaccineswork/five-things-weve-learned-about-ba4-and-ba5-omicron-variants
- https://theconversation.com/targeted-wastewater-surveillance-has-a-history-of-social-and-ethical-concerns-183570
- https://biobot.io/data/
- https://covid.cdc.gov/covid-data-tracker/#new-hospital-admissions
- https://abcnews.go.com/Health/us-dramatically-undercounting-current-covid-19-resurgence-experts/story?id=84012793
- https://covid.cdc.gov/covid-data-tracker/#trends_dailydeaths
- https://doi.org/10.1038/d41586-022-00104-8
- https://www.aamc.org/news-insights/how-are-covid-19-deaths-counted-it-s-complicated
- https://www.deathpanel.net/episodes-1
- https://www.npr.org/sections/goatsandsoda/2022/06/06/1101752798/coronavirus-faq-i-got-covid-then-i-got-it-again-whats-the-deal-with-reinfection
- https://abcnews.go.com/Health/youre-waiting-herd-immunity-covid-19-time-move/story?id=84910302
- https://www.npr.org/sections/health-shots/2022/06/07/1103563935/advisers-to-the-fda-back-novavax-covid-vaccine
- https://www.ft.com/content/ce0597bd-70ee-4857-be6b-ccdb20bd71a0
- https://journals.plos.org/plosone/article?id=10.1371/journal.pone.0254347
- https://www.ons.gov.uk/peoplepopulationandcommunity/healthandsocialcare/conditionsanddiseases/bulletins/selfreportedlongcovidafterinfectionwiththeomicronvariant/6may2022
- https://doi.org/10.1038/s41591-022-01840-0
- https://www.cdc.gov/poxvirus/monkeypox/pdf/MPX_Social_Gatherings_Safer_Sex-508.pdf
- https://khn.org/morning-breakout/cdc-posts-then-deletes-guidance-on-airborne-risks-of-monkeypox/