
The Current Situation – “The Weather”:
We are in a sustained surge. BA.4 and BA.5 are continuing to spread and displace prior variants, particularly in the West and Midwest. The transmission map shows that 99% of people in the US continue to be at high or substantial transmission.
Watch the spread here:
On Variants:
BA.4 and BA.5 continue to spread quickly, jumping from being 22% of all variants last week to 35% this week, as BA.2.12 and BA.2 recede.
Variant proportions change by region. The Northeast still has the largest proportion of BA.2.12, whereas BA.4/5 comprise about a quarter of variants. The West and Midwest see much larger proportions of BA.4/5, around one-third of variants.
Wastewater Monitoring:
Nationally, we are beginning to see a slight dip in wastewater levels, somewhat mirroring the levels of last year’s Delta surge. Regionally, there are small decreases in the Northeast and West while the South and Midwest are mostly stable.
Hospitalizations:
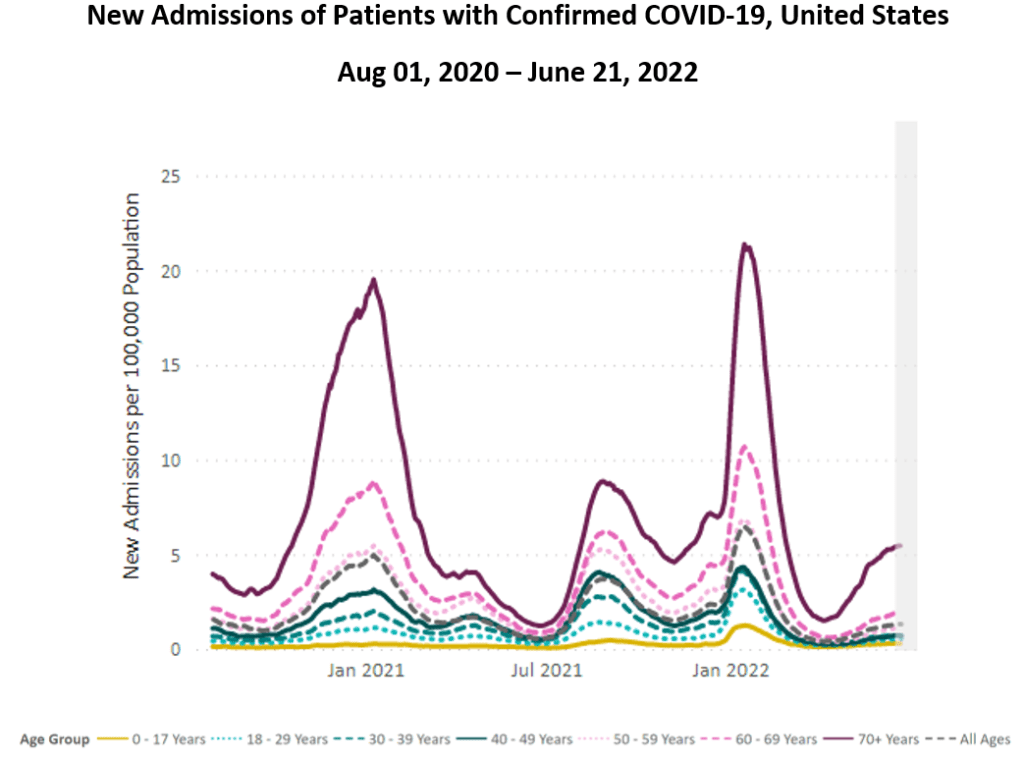
For 9 weeks in a row, hospitalizations continue to rise nationally, though still at relatively low levels (1.32 per 100,000 people).
Hospitalizations for those ages 70+ have been rising the fastest. This is the most vulnerable age group, and the fact that hospitalizations for this group have never been lower than other ages highlights the need for this country to do better for its elders.
Escalation of anti-Asian racism is another COVID-related morbidity not well-tracked by authorities. While attacks are undercounted, there is no doubt that Asian Americans are suffering increased violence & mental health crises and deserve all of our solidarity & support.
Deaths:
In the past week, from June 16 to June 22, 1,787 people died of COVID nationally. Since the beginning of the pandemic, the moving average of daily deaths has never been less than 200.
Be Prepared:
If you are 50+ and haven’t received your 2nd booster yet, get it now. New CDC data shows that a 2nd booster means lower death rates. Data still holds that all vaccinated groups had lower death risk compared with unvaccinated.
Beware of reinfection. High levels of infections & reinfections among those vaccinated or with prior BA.1/2 infection is due to the evolution of BA.2.12 & BA.4/5 with substantial evasion of immune protection. New subvariants are causing continuing surges & reinfection risk.
Guidance on treating COVID for people living with HIV states that although clinicians must assess the potential for drug interactions, in most cases your medical provider can prescribe Paxlovid. You can also use this locator for the test-to-treat program.
If you are living with HIV and this is your first time having COVID, you can participate in the amfAR study, which is looking at how COVID may affect people with HIV over time. They will come to your home to collect blood samples. Learn more at CovidRecoveryStudy.org.
Forecast:
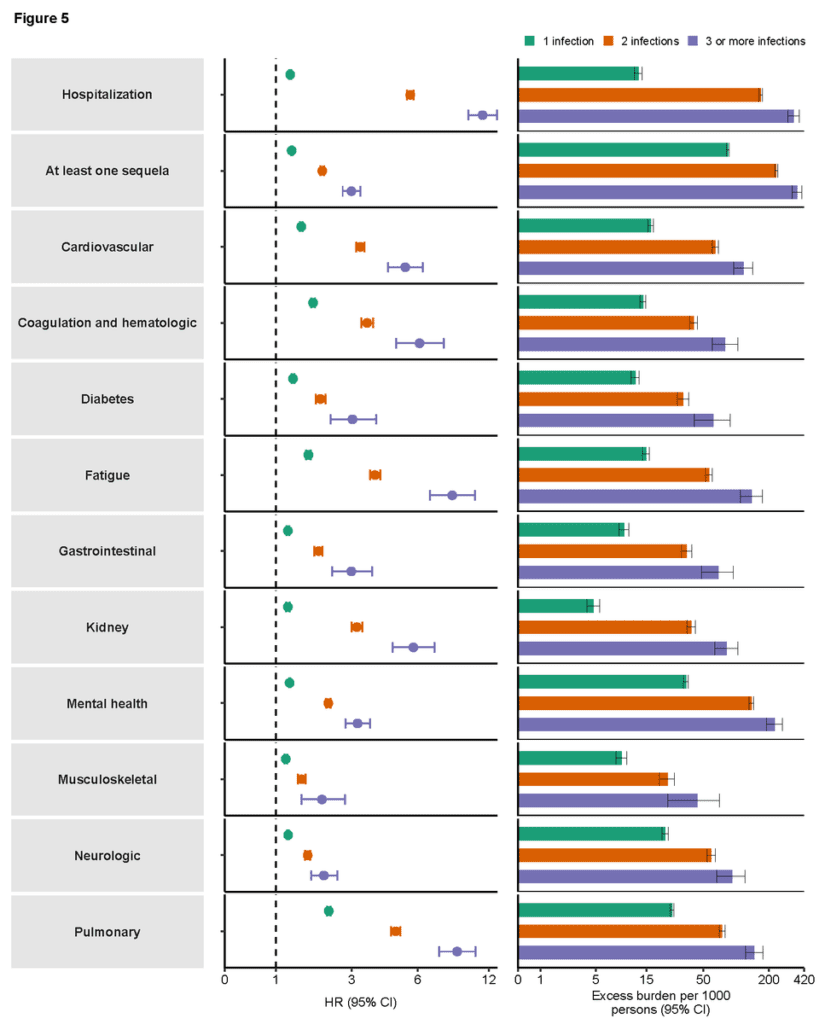
A new study shows increased risk with repeated COVID reinfections. While the study had a limitation in that it compared days 30-210 after the 1st infection vs. days 1-180 post-reinfection, it nevertheless showed COVID reinfections confer added risk of negative health outcomes.
Those outcomes included cumulatively increasing risk of hospitalization and a variety of additional adverse health outcomes including lung, heart, GI, and kidney issues, along with diabetes and fatigue in both the the acute and post-acute phases of reinfection.
Immunization options for children are expanding! This past week, children ages 6 months to 5 years old became eligible for COVID vaccines from Pfizer & Moderna. The CDC has endorsed a two dose Moderna vaccine for kids ages 6-17, joining Pfizer as a vaccine option for this group.
Exciting research on dogs’ ability to sniff out disease holds promise for early detection of COVID. While more dogs will need to be trained to scale this up, it would be an interesting intervention to increase COVID safety in community settings.
On Long COVID:
A recent study found lower odds of Long COVID with the omicron variant versus the delta variant. However, 4% of cases having Long COVID is still very high given the total number of individuals infected with omicron.
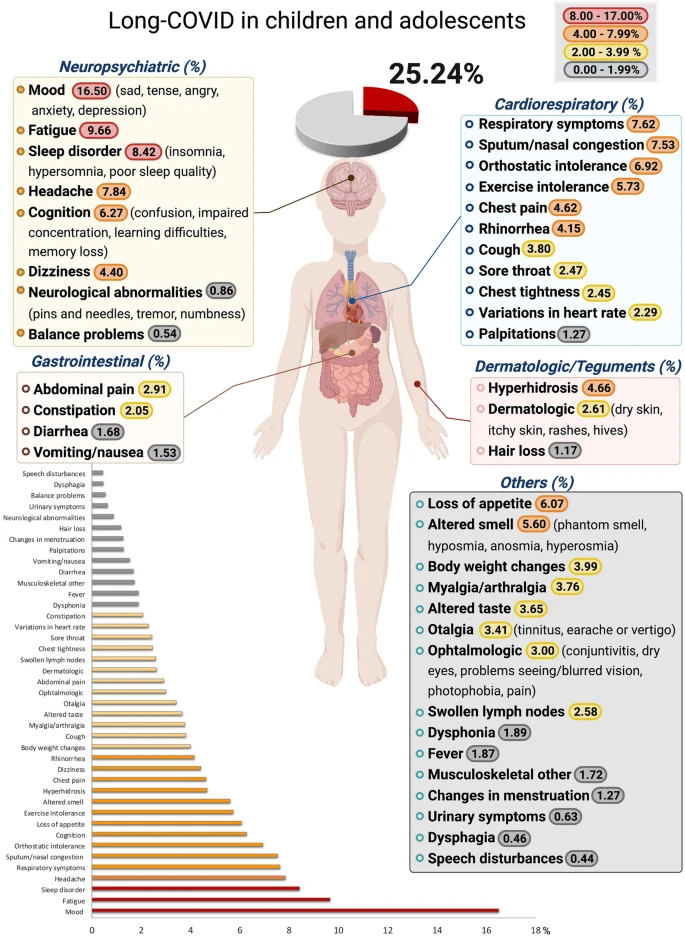
A new systematic review of #LongCovidKids found that 25% of children with Long COVID most commonly had mood symptoms, fatigue, and sleep disorders. Kids infected with COVID also had a higher risk of breathing, smell, and taste problems and/or fever compared to controls.
A literature review on sex differences in Long COVID found higher risk of Long COVID overall and higher odds for ENT (ear, nose, throat), mood, neurological, dermatological, and other disorders for females. However, odds of endocrine and renal disorders were higher among males.
Over 40% of US adults have had COVID & nearly 1 in 5 (19%) have symptoms of Long COVID. 1 in 13 US adults have Long COVID, with new symptoms lasting 3 or more months post-infection.
Actions to Take!
@Pan_End_It encourages people to answer @usedgov‘s request for public comment on proposed amendments to #Section504. Comment on ways to improve and meet the needs of disabled students, especially on preventing infectious disease spread in class.
Check out and share our new info sheets!
We have fact sheets on layers of protection, masking, and how COVID spreads.
View them all here: https://bej.gbh.mybluehost.me/infosheets/.
Sources (in order):
Or check out the links on our web version: https://bej.gbh.mybluehost.me/reports/
- https://covid.cdc.gov/covid-data-tracker/#county-view?list_select_state=all_states&list_select_county=all_counties&data-type=CommunityTransmission&null=Risk
- https://covid.cdc.gov/covid-data-tracker/#variant-proportions
- https://biobot.io/data/
- https://covid.cdc.gov/covid-data-tracker/#new-hospital-admissions
- https://www.npr.org/2021/03/11/975592502/asian-americans-experience-far-more-hate-incidents-than-numbers-indicate
- https://www.cnn.com/audio/podcasts/chasing-life/episodes/b8eced5c-6e4d-435c-a4db-aeb50135368d
- https://stopaapihate.org/
- https://www.imreadymovement.org/
- https://covid.cdc.gov/covid-data-tracker/#trends_dailydeaths
- https://covid.cdc.gov/covid-data-tracker/#rates-by-vaccine-status
- https://www.nejm.org/doi/full/10.1056/NEJMc2206576
- https://clinicalinfo.hiv.gov/en/guidelines/guidance-covid-19-and-people-hiv/guidance-covid-19-and-people-hiv
- https://www.covidrecoverystudy.org/
- https://www.npr.org/2022/06/20/1106193435/covid-vaccines-are-finally-available-for-children-under-5
- https://www.cnbc.com/2022/06/23/cdc-panel-recommends-moderna-two-dose-covid-vaccine-for-kids-ages-6-to-17.html
- https://www.nature.com/articles/d41586-022-01629-8
- https://www.thelancet.com/journals/lancet/article/PIIS0140-6736(22)00941-2/fulltext
- https://www.nature.com/articles/s41598-022-13495-5
- https://www.tandfonline.com/doi/full/10.1080/03007995.2022.2081454
- https://www.cdc.gov/nchs/pressroom/nchs_press_releases/2022/20220622.htm
- https://actionnetwork.org/letters/write-a-public-comment-to-the-office-of-civil-rights-on-possible-amendments-to-section-504-of-the-rehabilitation-act-of-1973