
The Current Situation – “The Weather”: As BA4/5 increasingly become the dominant new strains, we remain at a sustained surge nationally. The transmission map shows that 99% of people in the US are still at high or substantial transmission.
The need for updated vaccines, masking & ventilation is urgent as are community mitigation strategies such as paid sick leave, eviction protections, & unemployment support.
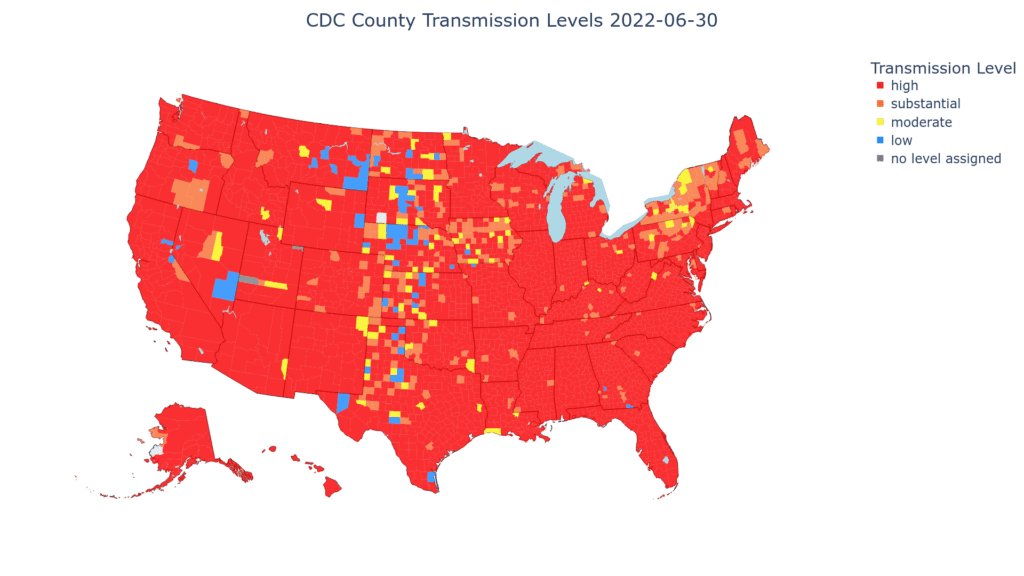
Watch the spread here:
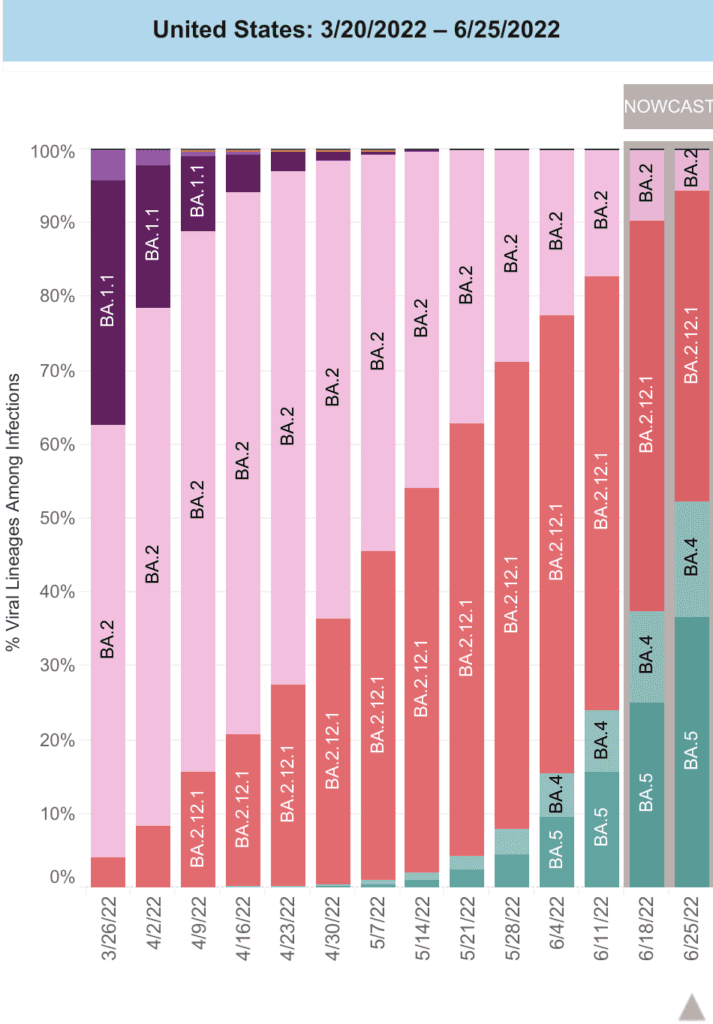
On Variants: Only weeks ago it seemed BA2.12 would take over, but BA4/5 have instead swept the US, at 52% of cases. This rapid growth, after high levels of infections all year, shows how transmissible and immune-evasive these new variants are.
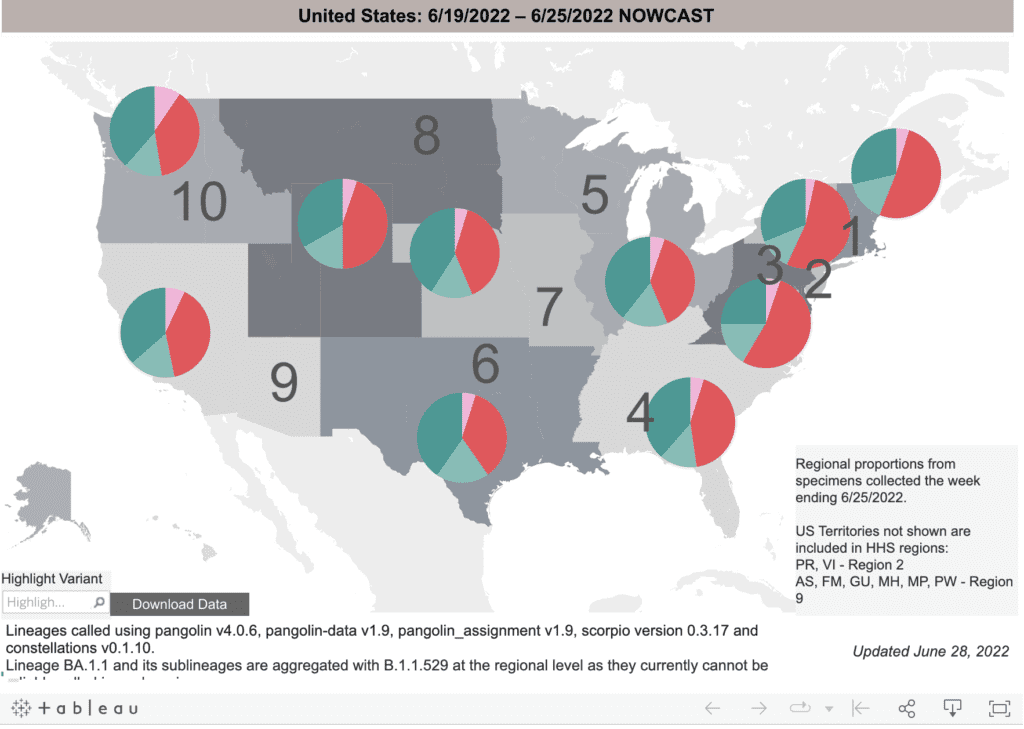
In the Northeast, where BA2.12 was first observed, BA4/5 are not yet the dominant strain, which may explain the brief lull in hospitalizations there. However, BA4/5 make up more than half of cases in every other region.
Unless we use layers of protection to keep cases lower, the virus will continue to mutate and cause new surges. A new variant, BA2.75, with the potential to overtake BA4/5 has already been identified; we’ll report on the situation as more data becomes available.
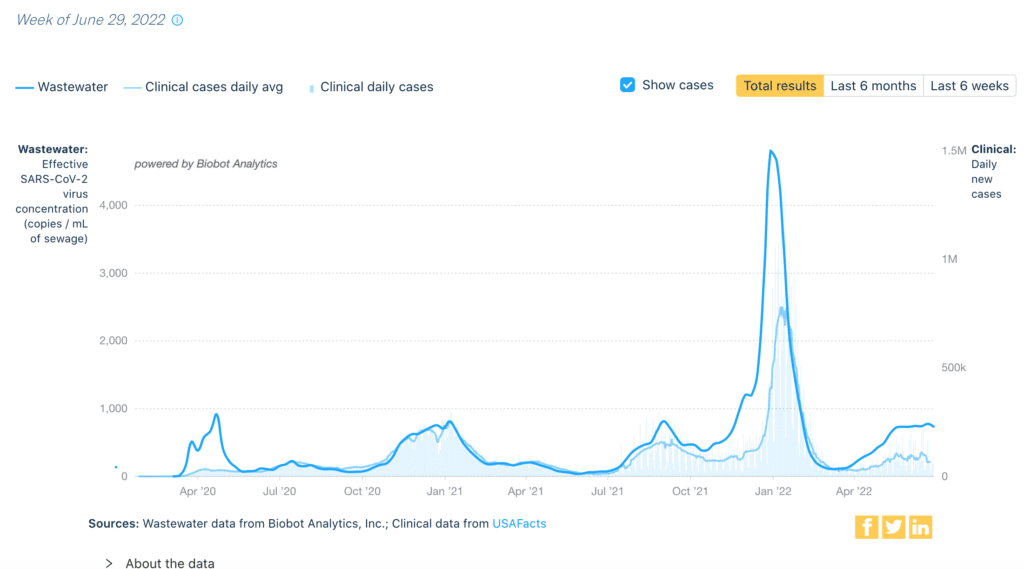
Wastewater Monitoring: National wastewater data also clearly show we are in a sustained surge, with a long plateau never previously seen in the pandemic. This is the predictable result of removing all protections & allowing the virus to circulate freely.
Hospitalizations: For 10 weeks in a row – since April 11 – hospitalizations continue to rise nationally, currently at 1.47 hospitalizations per 100,000 people. This long-term drain on our healthcare system is not sustainable.
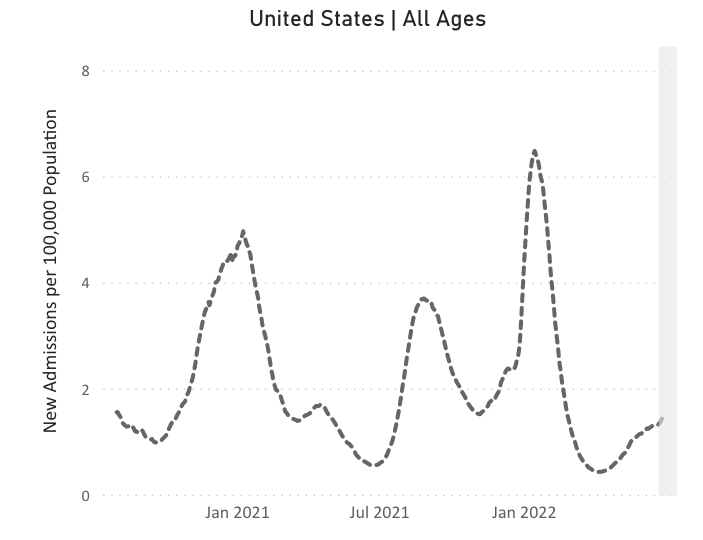
Hospitalizations have dipped in the Northeastern states but continue to climb in every other region. Future data will help us understand if BA4/5 cause more hospitalizations due to more severe disease, incredibly rapid spread, or some combination of the two.
Deaths: In the past week, from June 23 to June 29, 2,221 people died of COVID nationally. At the half-way point of the year – with vaccines & treatment but no emphasis on prevention with high-quality masks, testing, or ventilation – over 187,000 people have died of COVID in 2022.
Be Prepared: The FDA recommended boosters for fall be updated to match Omicron – specifically BA4/5. This is key, as all vaccines so far are for the original 2020 virus. New boosters can have a bigger impact on preventing infection AND reducing severe disease.
Reminder: children under 5 are eligible & receiving vaccines finally, which provide important protection. However, national vaccine rates are low – only 106 million residents out of 330 million have full vaccination + booster. How can you help your community get boosted this fall?
Forecast: The White House directed $3.2B to Pfizer for 105 million doses of vaccine that could be ready this fall. These funds will be pulled from other important areas, including testing and variant tracking, PPE, ventilators, and research on a universal COVID vaccine.
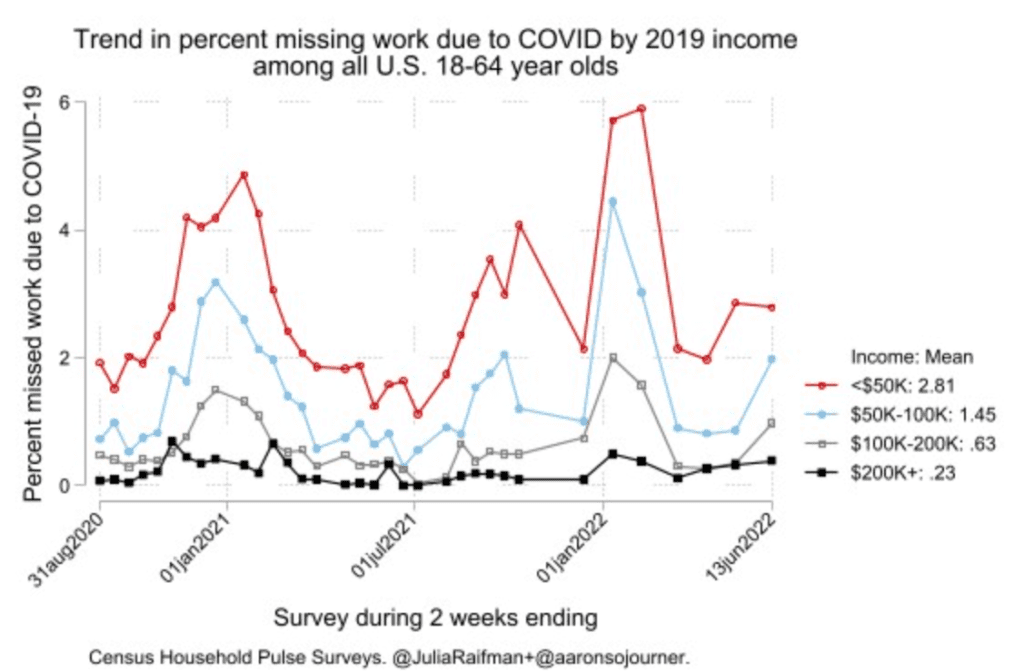
New analysis shows what @PeoplesCDC has long stated: low-income & other marginalized groups face higher levels of COVID exposure and suffer worse health & socioeconomic outcomes.
By prioritizing low-income & other marginalized groups for vaccines, treatment & improved workplace ventilation and continuing to organize for things like paid sick leave, unemployment supports, eviction protections, & universal healthcare, we can address this inequity.
On Long COVID: A new study analyzing the health records of over half of the Danish population found that those who had tested positive for COVID were at 2.7x increased risk for ischemic strokes, again highlighting that COVID is far from the common cold.
Actions to Take! NPR reported this week on why & how to improve ventilation to prevent COVID. Ventilation expert Joey Fox also explained how to use CO2 monitors to keep your home & business safer! https://thepavlovictoday.com/covid-is-airborne-co2-sensor-can-help-stop-it/
And a reminder, if you have COVID, self-isolate to the extent possible & test out with 2 negative tests, like at-home rapids. Recent data continue to show that many people infected with Omicron strains can still have active virus & infect others after day 5.
Another important virus to watch, 460 Monkeypox cases have been reported in 29 states, DC & PR, with little other info so far. Cases continue to rise rapidly in Europe. In NYC, limited vaccines were eagerly taken up among MSM & their partners; vaccine supplies must be increased!
Testing was limited but has expanded to more labs. We need better surveillance & contact tracing; we expect cases to spread to other communities. There are no deaths yet, but monkeypox can be very painful & cause severe disease among immunocompromised, children & pregnant people.
Sources: See the web version for hyperlinks to the articles referenced. https://bej.gbh.mybluehost.me/reports/