
The Weather: As we’re figuring out how to display COVID transmission in an accurate and accessible way, please know that about 98% of the US population lives in an area with substantial or high transmission, according to the CDC transmission map.
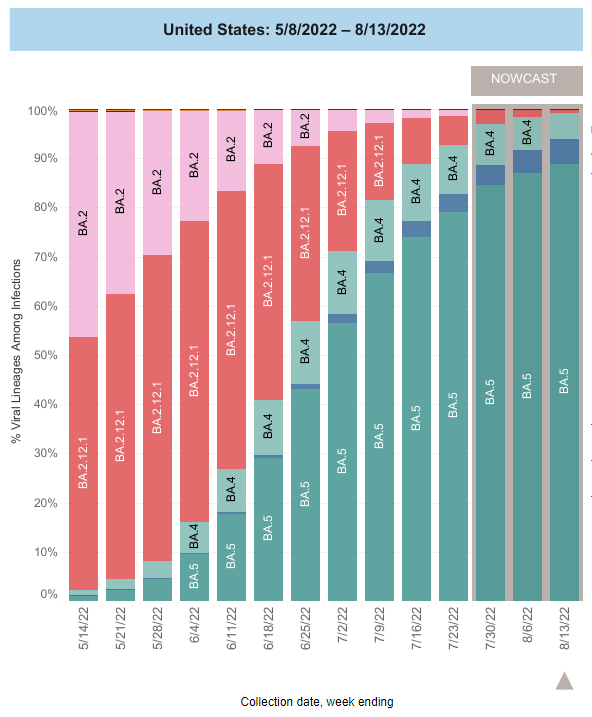
On Variants: BA.4/5 currently makes up 94% of cases nationally. BA.4.6, another Omicron variant, has been slightly increasing throughout the past few weeks since early July. It is not yet clear whether it will surge.
A new study summarized by Dr. Liji Thomas suggests COVID will continue to evolve through mutations that improve its ability to escape prior immunity, making clear – once again – that herd immunity is not a reasonable expectation or strategy.
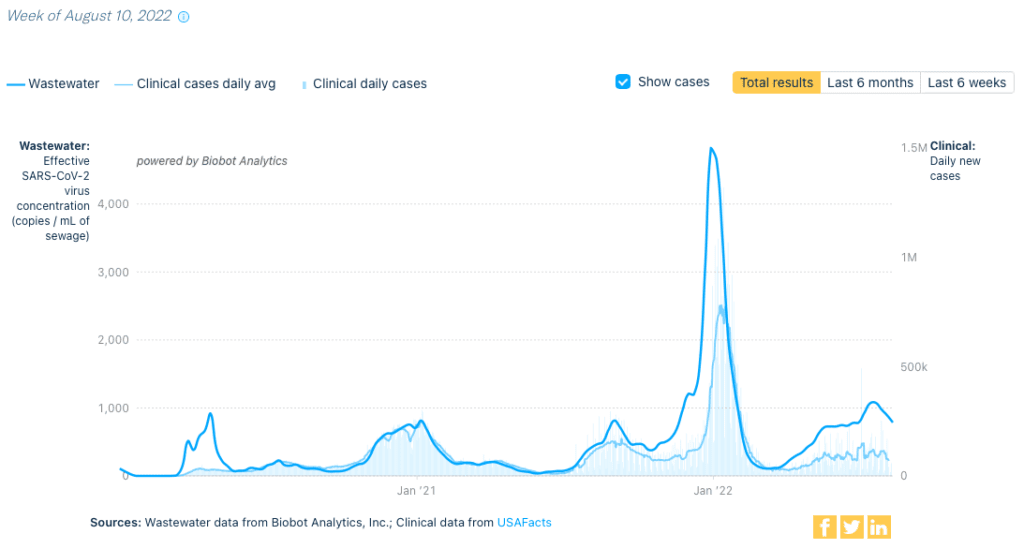
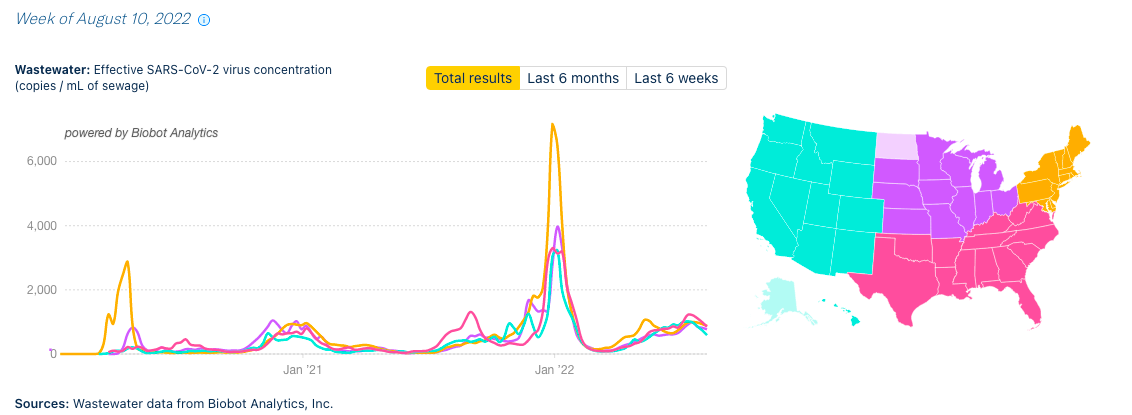
Wastewater Monitoring: National wastewater data from @BiobotAnalytics shows a continued decrease from last week, though levels continue to remain higher than before the Omicron surge.
Hospitalizations: Although hospitalizations show a slight decrease nationally for the first time in months, that decrease is very slight.
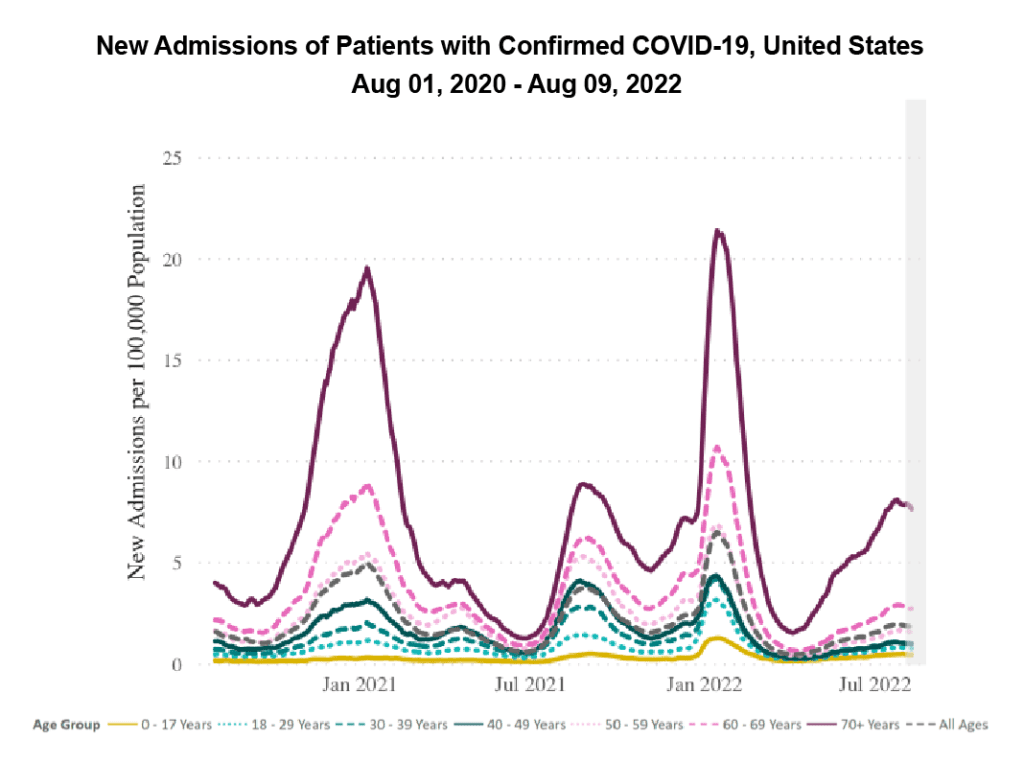
It’s important to note, however, that many hospitals have changed how they record COVID hospitalizations. For example, some are only recording those that require certain antiviral drugs.
Deaths: From August 4 to August 10, 2,940 people died of COVID nationally. On average, more than 400 people are dying of COVID each day in the US; this average has not dipped below 400 since mid-July.
On Long COVID: A recent piece in Nature describes the difficulties facing Long COVID researchers and patients. Proper federal funding is needed to more quickly pin down the causes of, and treatments for, LC.
Of particular importance from this Nature piece: graded exercise therapy does not work, may make things worse, and should not be recommended for patients with Long COVID.
Despite funding-related hurdles, research into Long COVID is ongoing. Read a breakdown of a preprint examining the immunological features of LC, which provides evidence that LC is real and biologically-based, in this Twitter thread from Prof. Akiko Iwasaki (@VirusesImmunity).
We want to lift up the work of The Patient Led Research Collaborative (@patientled) for conducting Long COVID research, pushing policy, and ensuring that research involves and centers Long COVID patients.
Forecast: We are experiencing sustained and uncontrolled COVID spread, a worsening Long COVID crisis, and a deteriorating US healthcare system.
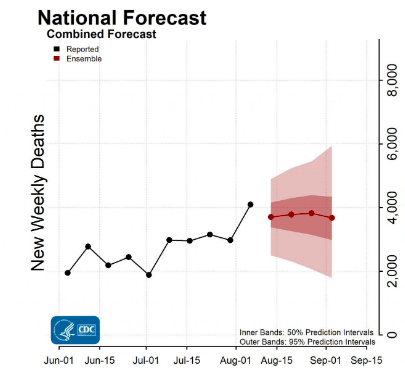
What’s more, The CDC itself predicts deaths will “remain stable or have an uncertain trend” in the coming weeks.
Despite this, the CDC published a horrifying set of new, relaxed guidelines last week, which places even more responsibility onto individuals than ever before and ignores all COVID-related outcomes they classify as “not severe” (including Long COVID).
These updated guidelines underscore the CDC’s refusal to control or prevent disease, and send a clear message that they believe 400+ deaths per day are acceptable.
The CDC is asking us to continue allowing our children, neighbors, coworkers, and friends to die; to surrender to the “inevitability” of Long COVID; and to accept that those of us who are disabled must endure ever increasing isolation and harm – all in the name of a wretched economy.
In fact, they’re already being praised by the capitalist class, who are happy to have us back to our “pre-Covid behaviors” – spending more money, working through illness, and unable to take time off following exposure – at the price of the public’s health.
To name it clearly, the CDC’s policies are eugenic – they rely on and promote the indefensible stance that disabled and elderly, poor and working class people are disposable, unworthy of care, and unworthy of participation in society.
And the failures don’t stop at the CDC. Rob Wallace, an epidemiologist and fellow PCDC volunteer, offers an in depth breakdown of the current lack of public health measures, noting similarities between both administrations’ pandemic responses.
The state of COVID nationwide, especially as schools are set to reopen with little to no covid safety measures in place, are a cause for concern.
Not only are children at risk of catching and spreading COVID, but children with a prior COVID infection are at increased risk for blood clots, heart problems, diabetes, and kidney failure, according to a new report by the CDC itself.
But there’s hope somewhere in the understanding that we *can* protect each other. This starts by recognizing that those of us who wish to keep eachother safe are not a minority. Unmitigated spread, eugenics, and individualism as policy are not inevitable. We must demand and work towards a different future.
Register your objection with the president. Once again, @watermelonpunch has gotten us all started: https://teamshuman.substack.com/p/the-cdc-is-supposed-to-control-and?r=21wmy&s=w&utm_campaign=post&utm_medium=email
Join us in pushing for the return of mask mandates. Mask mandates protect children and staff in schools, helping us to “avoid potential depending of educational inequities.”
You can read a breakdown of this mask mandates in schools study from one of its authors, Dr. Ellie Murray (@EpiEllie), in this Twitter thread.
Finally, remember that you are not alone. Consider registering for CovidMeetups.com, a service “designed to help COVID careful individuals and families connect in their local area.”
Let’s keep each other safe this week.