
The Weather
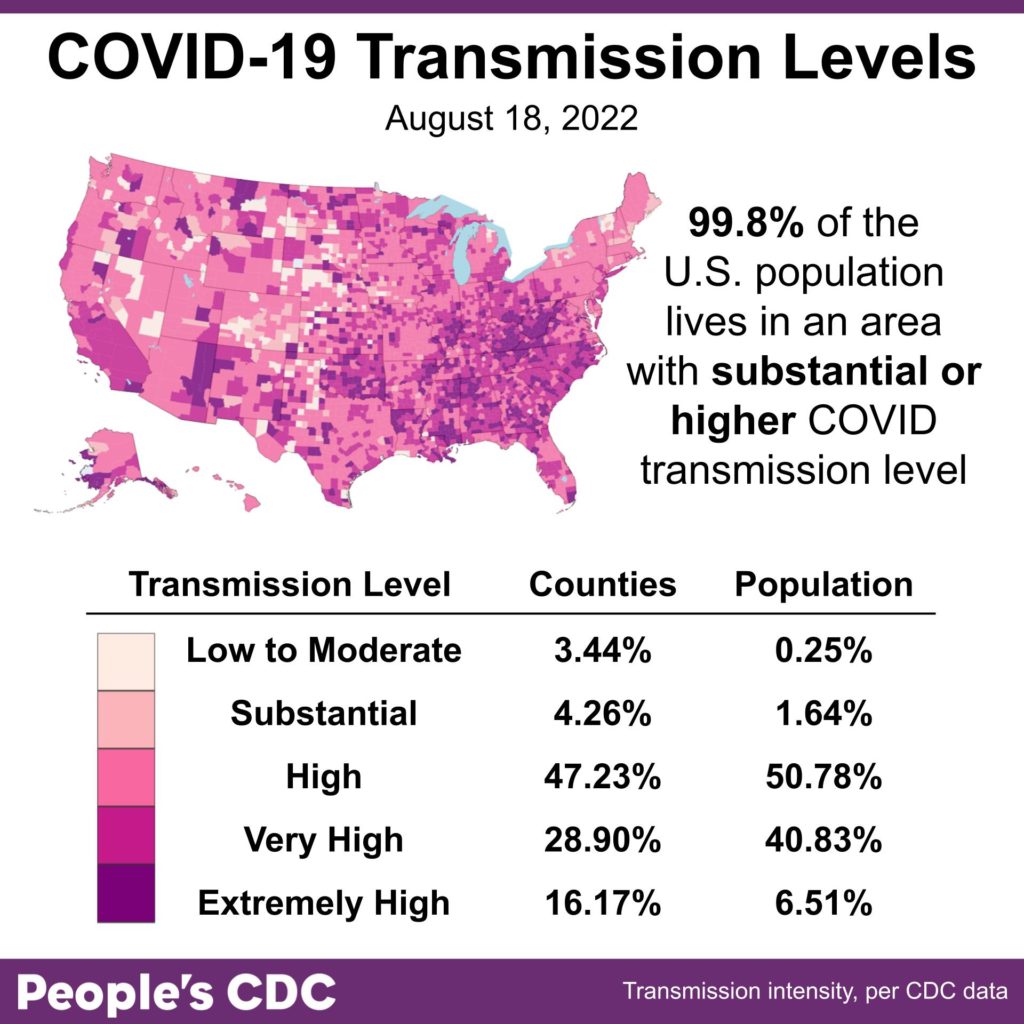
We have updated the COVID transmission map visuals to better view the intensity of spread across the US. Since few counties have low or moderate transmission, we grouped those categories together. The CDC’s uninformative High level is split to show 3 levels of High transmission.
Consistent with numbers since early June, almost all (99.8 percent) of the population is living in areas with substantial, high, or even higher COVID transmission.
On Variants
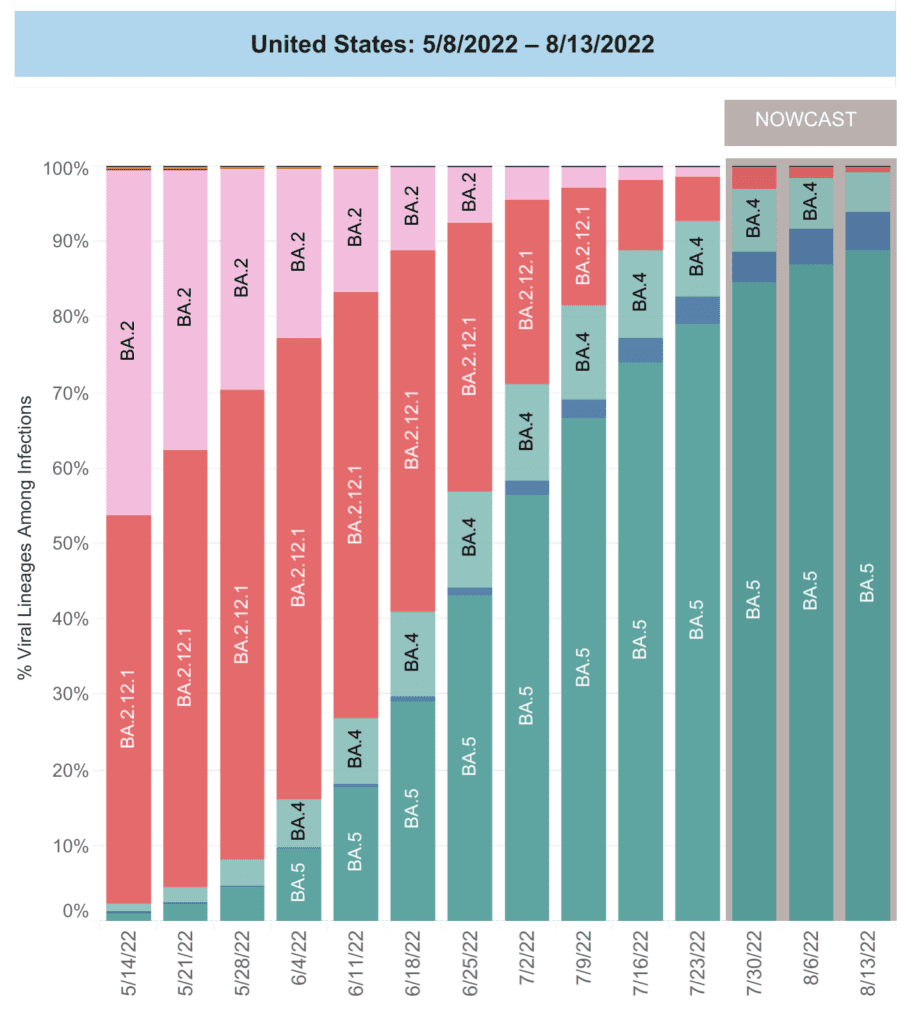
BA4/5 continue to dominate, making up 94 percent of cases nationally with BA4.6 making up the remaining 5 percent, and no new variants are rising.
Researchers have developed a promising antibody treatment, SP1-77, that is able to neutralize all COVID variants to date.
The SP1-77 treatment may have broad applications for preventing & treating COVID in the future. Their next steps are to test in humans & to expand this technology commercially.
Wastewater Monitoring
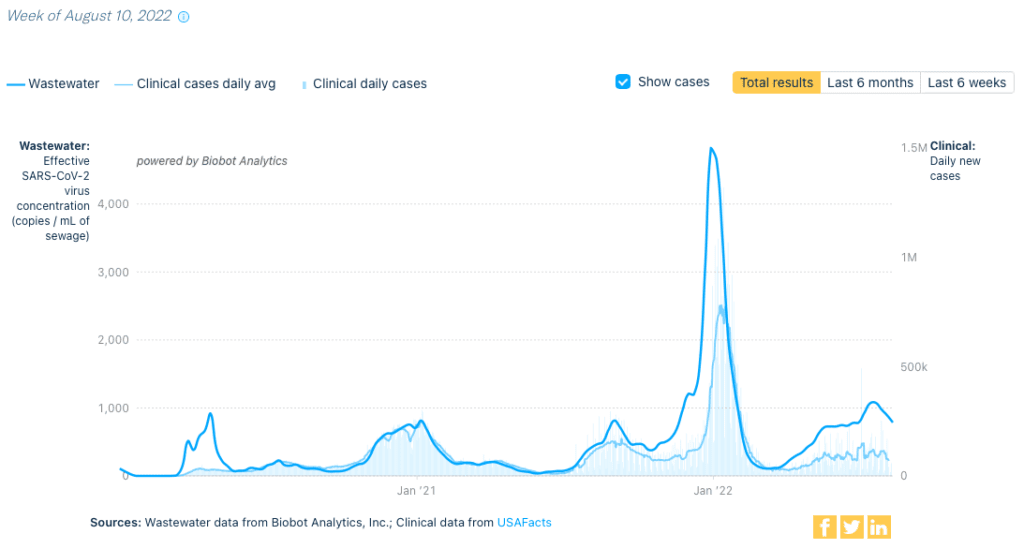
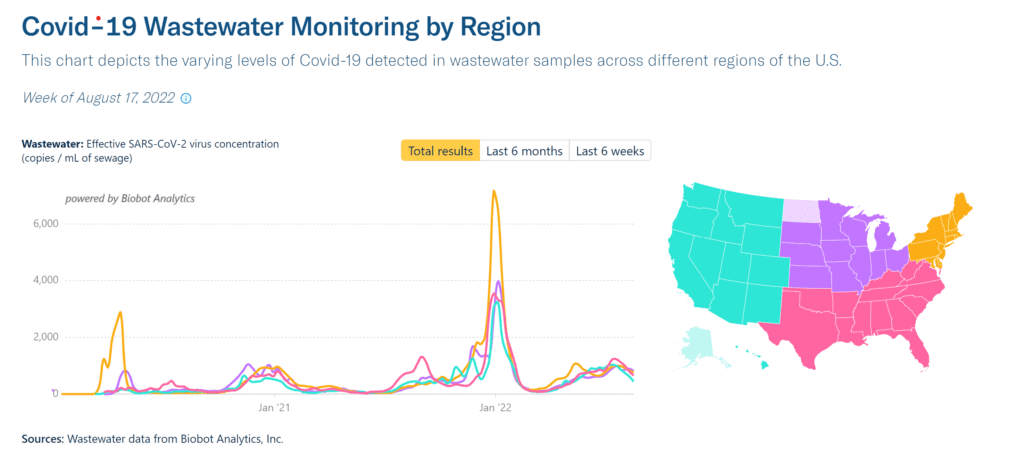
National wastewater data from @BiobotAnalytics show a continued decrease from last week. And yet, levels are now about the same as during the Delta surge.
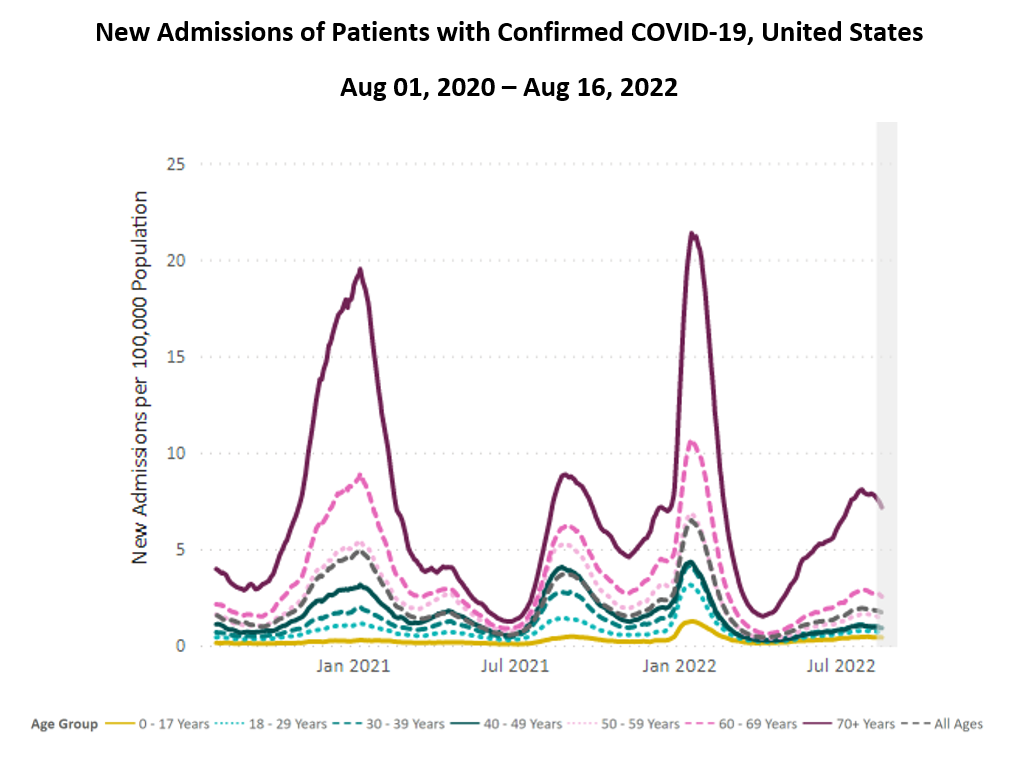
Hospitalizations
Hospitalizations are down 6.1 percent from last week’s 7-day average. The 7-day average from August 10th to August 16th is 5,690 hospitalizations, with about 1.7 new admissions per 100,000 across all age groups.
Given the CDC’s latest guidelines that further undermine COVID measures, as we discussed in last week’s report, we will likely see hospitalizations uptick again.
A study found that over 1 in 4 children hospitalized with acute COVID or multisystem inflammatory syndrome (MIS-C) experienced persistent symptoms for at least 2 months.
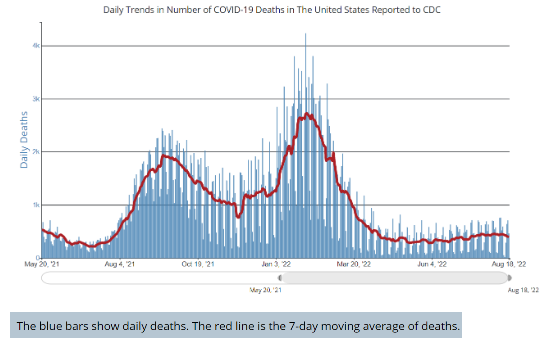
Deaths
From August 11th to August 17th, 2,760 people died of COVID nationally.
The trend of death counts has been steady since April, when the nation began to recover from the wave of death from the late 2021-early 2022 Omicron BA.1 surge. This is consistent with the country consistently loosening COVID protections as if the pandemic were over.
On Long COVID
Strategies for High Impact and its Network for Long COVID Justice kindly urge you to share enrollment information (also available in Spanish).
The Network for Long COVID Justice is the only clinical study in the US dedicated to understanding the long term effects of COVID in People Living with HIV (PLHIV)!
Initial studies have suggested that PLHIV may be at higher risk of developing Long COVID, even after mild or asymptomatic COVID. It is crucial for us to learn more about the post-COVID experiences of PLHIV.
A large study of 1.5 million COVID patients found an increased risk of psychotic disorder, cognitive deficit, dementia, and epilepsy or seizures at 2 years post-infection, suggesting COVID has a significant and lasting impact on the brain.
Forecast
On a hopeful note, Drs. Patricia Neves & Ana Paula Ano Bom from Brazil invented a different kind of mRNA vaccine. This new design is self-amplifying; only a small dose is enough to teach the body to replicate the RNA.
This new design was necessary because Moderna and Pfizer refused to share their formulations.
The new formula makes the vaccine cheaper to produce, much needed for many countries in the Global South. Their team is on track for Phase I of clinical trials. They aim to mass produce this drug in about 1.5 years for the world, using a not-for-profit model. Kudos to them!
In the US, given the lifting of COVID measures while most of the country experiences substantial or high transmission, COVID cases will rise.
COVID will continue to disrupt many lives due to infection & Long COVID, which is so common it’s been referred to as “an epidemic within a pandemic.”
Be Prepared & Take Action
The FDA has issued new guidance on reducing the possibility of false negative results from at-home antigen testing.
After an exposure, those who are asymptomatic should do at least 3 tests, each 48 hours apart, and those who are symptomatic should do at least 2 tests, also 48 hours apart, to reduce the risk of false negatives.
Stay tuned: This week on Instagram we’ll suggest scripts for calling on the White House to respond to the pandemic responsibly and equitably, which you can also send via Action Network.
We need to do everything we can to pressure the government to take public health seriously.
Data Note: In this report, the numbers pulled from the CDC were current as of Aug 19, 2022. The CDC updates data frequently as it receives refreshed information from states and counties. The numbers you view today may be slightly different from the numbers from this report.
Sources: Check out the links throughout and see our website for more! https://bej.gbh.mybluehost.me