People’s CDC COVID-19 Weather Report

Published

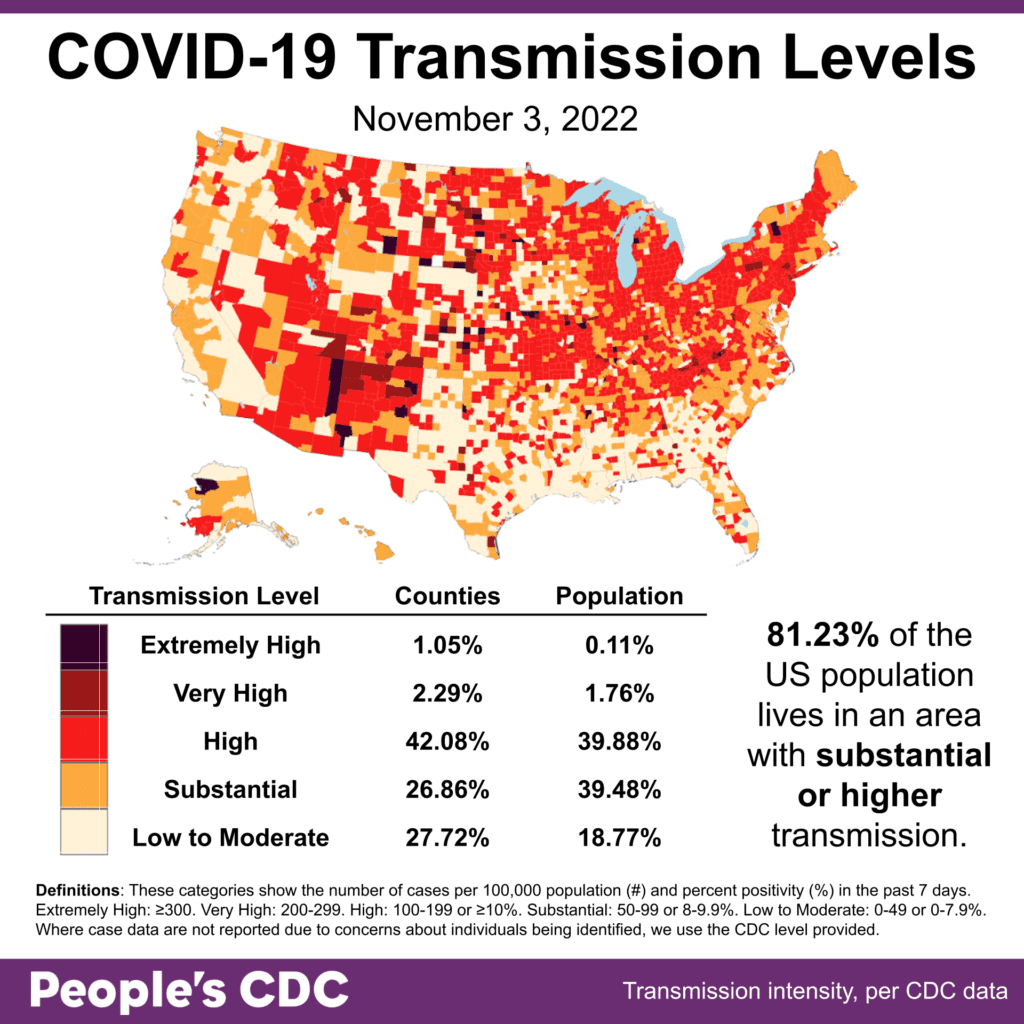
The Weather: A slight increase from last week shows that 81.23% of the population is living with substantial or higher transmission. 

As the winter holiday season approaches and more people travel and gather together, the rise in areas that already have substantial levels of transmission indicate a need to prevent further infections.

Map and table show COVID transmission levels by US county as of 11/3/22. Low to Moderate transmission levels are pale yellow, Substantial is orange, High is red, Very High is brown, and Extremely High is black. Most of the Northeast and Midwest are red; CA, TX, and the Gulf Coast are mostly pale yellow; the Mountain West and the western parts of the Midwest have a mix of colors including several counties that are black or brown. Text reads: 81.22  percent of the US population lives in an area with substantial or higher transmission. A Transmission Level table shows 1.05 percent of counties (0.11 percent by population) as Extremely High, 2.29 percent of the counties (1.76 percent by population) as Very High, 42.08 percent of counties (39.88 percent by population) as High, 26.86 percent of counties (39.48 percent by population) as Substantial, and 27.72 percent of counties (18.77 percent by population) as Low to Moderate. The People's CDC created the graphic with data from the CDC.

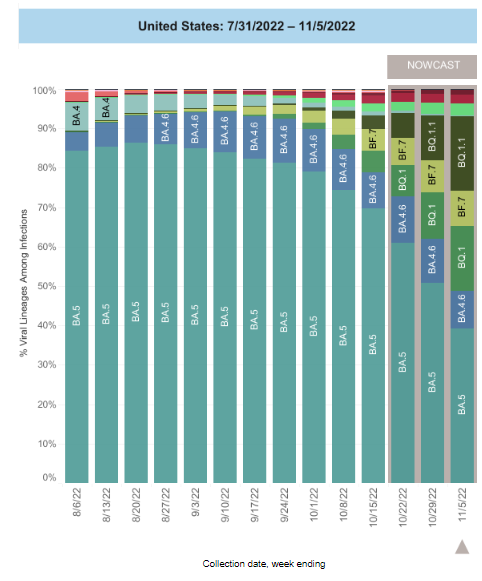
On Variants: BA.5 proportions have dropped to under 40% this week. BA.4.6 and BF.7 continue to be stable, at around 10% each. However, BQ.1 and BQ.1.1, the more immune-evasive variants, continue to rise by 8% this week—from 27% last week to 35% now.

Stacked bar chart with x-axis as week shows weeks from 8/6/2022 through 11/5/2022 and y-axis as percent viral lineage among infections. The most recent 3 weeks are labeled as “Nowcast projections.” BA5 (teal) is the most common lineage overall, growing from about 80 percent of cases on 7/30 to a peak on 8/20 of about 86 percent. Receding since then, it presently makes up about 40 percent. BQ1 (forest green) and BQ1.1 (olive) increased from barely-visible proportions in August to current estimates of 16.5 and 18.8 percent, making them 2nd and 3rd most common variants this week. BA4.6 (blue) is 4th this week at 9.5 percent, slowly increasing from about 3 percent on the week of 7/23 to about 11 percent on the week of 9/17 and decreasing since then. BF7 (lime green), barely present at the beginning of August,  slowly increases to 9.0 percent. Even more slowly increasing are BA2.75 (rose) and BA2.75.2 (maroon), and BA.5.2.6 (pastel green), all currently under 4 percent.
Graphic source: CDC COVID Data Tracker: Variant Proportions

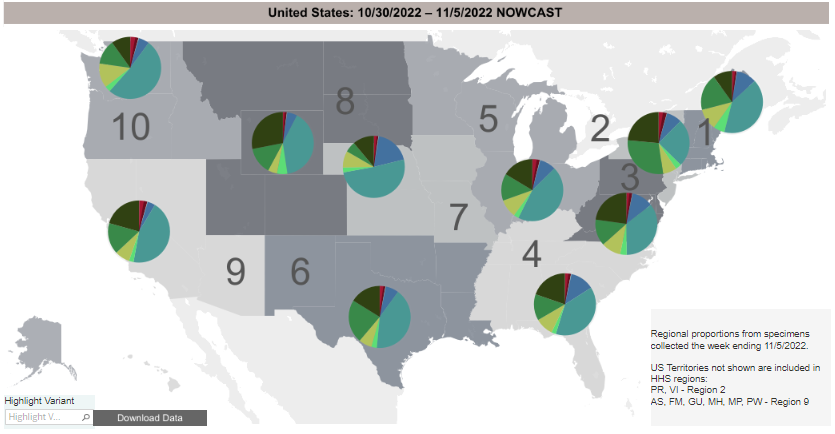
There are regional differences in variant coverage across the US. In the West, BA.5 continues to be about half of cases, whereas it is about a quarter to a third of cases in the East. 

BQ.1.1 is particularly high in NY, NJ, PR, and VI (Region 2) as well as in the Middle Rockies (Region 8), at 24% and 28%, respectively. BQ.1 is highest in the South Central area (Region 6) and again in Region 2, at 23% and 29%, respectively.

Regional difference map of the US with 10 regions (groups of roughly 3 or 4 states), depicted as shades of gray. Title reads: United States: 10/30/2022 - 11/5/2022 Nowcast. Each region has a colored pie chart. Legend reads “Regional proportions from specimens collected the week ending 11/5/2022” and “US Territories not shown are included in HHS regions: PR, VI - Region 2. AS, FM, GU, MH, MP, PW - Region 9.” BA.5 (teal) is most common in most regions, followed by BQ.1 (forest green) and BQ1.1 (olive). Region 2 (NY, NJ, PR, VI) is the exception with BQ1 as the majority of cases (28.8 percent) and only about one quarter BA.5. Region 7 (IA, MO, KS, and NE), and Region 10 (ID, WA, and OR) also differ, having higher percent BA.5 (about 60 percent) than other regions which are around 50 percent. Region 7 also has more BA4.6 (blue) than other regions. Bottom text reads: “Updated October 28, 2022” and  “Lineages called using pangolin v4.1.3, pangolin-data v1.15.1 and user v.0.5.4.”
Graphic source: CDC COVID Data Tracker: Variant Proportions

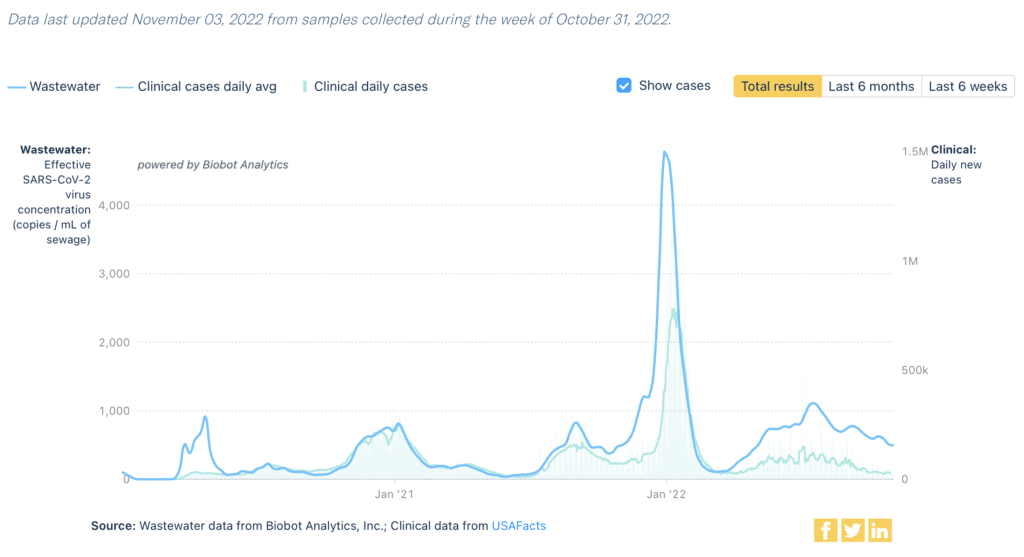
Wastewater Monitoring: National wastewater levels have shown a slight decline, including the Northeast, although that region still has the highest reported levels.

Title reads Covid-19 Wastewater Monitoring in the US. Top text says “Data last updated November 3, 2022 from samples collected during the week of October 31.” Graph shows weekly wastewater viral concentration and daily clinical cases since the beginning of the pandemic and ending on October 31, 2022. A dark blue line represents viral concentration in copies per milliliter of sewage, and a light blue line represents clinical cases daily average. Since about March 2022, the light blue case line is somewhat erratic and relatively plateaued at well less than 100K. Over the same time, the dark blue wastewater line is persistently higher. It peaks above 1,000 in late 7/2022 and has since been decreasing to a current value of 21,335. Bottom text reads Source: Wastewater data from Biobot Analytics, Inc; Clinical data from USAFacts.
Graphic source: Biobot Analytics

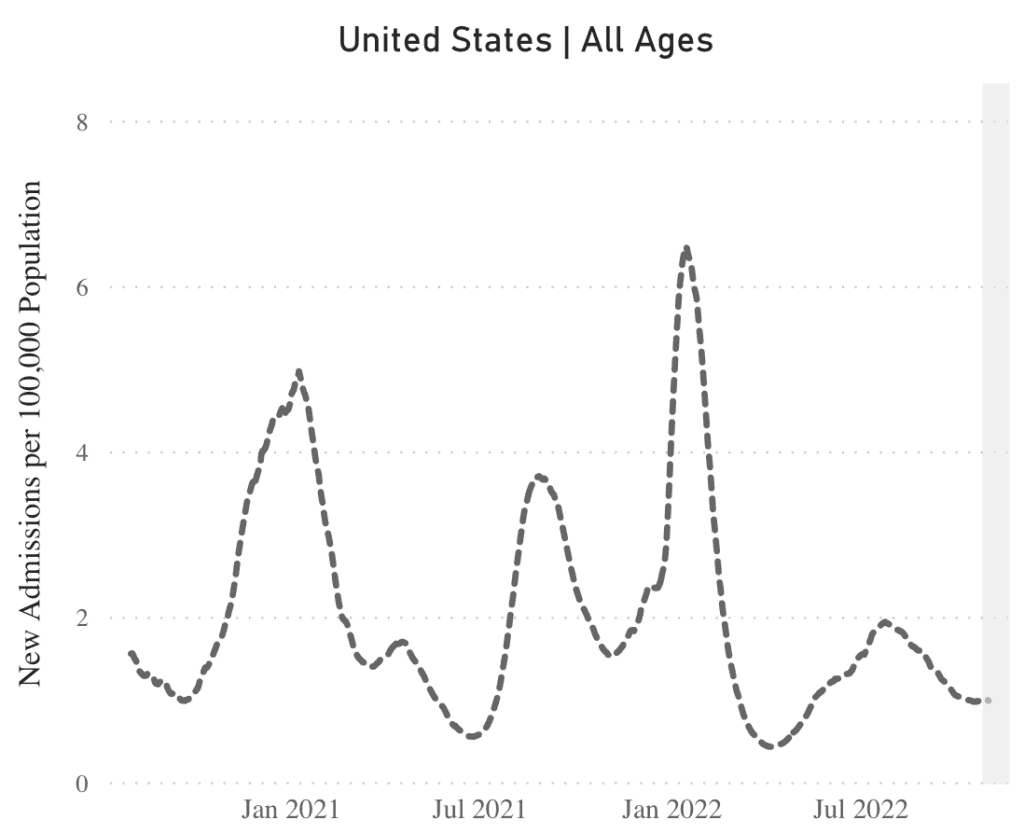
Hospitalizations: Nationally, hospitalizations remain mostly flat, as they have been in recent weeks. However, the Southeast, Midwest, Midcontinent, and Pacific Northwest are experiencing some increases.

A line chart representing new admissions of patients to hospitals with confirmed COVID in the United States. The chart has New Admissions per 100,000 Population on its y axis and labels of January 2021 to July 2022 on its x axis; the plot extends past x labels with data ranging from August 2020 to November 2022. New admissions peak at about 5 per 100,000 in January 2021 and 6.5 per 100,000 in January 2022, with smaller peaks happening in August 2021 (about 3.7 per 100,000) and July 2022 (about 2 per 100,000). The line gradually decreases after the July 2022 minor peak to about 1 per 100,000 at the right most point.
Graphic source: CDC COVID Data Tracker: New Hospital Admissions

Deaths: Between October 26 and November 1, 2,504 people died of COVID nationally. This is the 17th week in a row that at least 2,500 people have died from COVID. 

With documented transmission increasing again, deaths remaining high, and new subvariants taking hold, the winter months are looking grim without proactive measures to combat the ongoing pandemic.

On Long COVID: A recent article reported on a study that found that COVID infection could increase vulnerability to developing severe neurological symptoms associated with Parkinson’s and Alzheimer’s. 

Forecast: Global consensus from a multidisciplinary panel convened as part of a Delphi study highlighted key recommendations.

Some recommendations included the requirement of whole society engagement and a “vaccine-plus” approach, validating our call for layers of protection.

Researchers are working on nasal sprays that could prevent COVID infection and act as an additional layer of protection to vaccines and quality masking. However, funding and resources are lacking, highlighting the need to demand continued COVID research.

This report documents the consequences of decreased federal funding for COVID, especially with the upcoming planned expiration of the public health emergency declaration on January 11, 2023.

With the increased commercialization of essential public health resources, the country will face reduced supplies of tests and treatments, with the uninsured standing to lose the most. We must keep demanding that public health is a public good, not a private enterprise!

Take Action: Sign up to testify at the NYC hearing on COVID—scheduled for today, November 7th at 1PM—to call on NYC’s elected officials to invest more in COVID prevention efforts and Long COVID care.

The 1st annual People’s Public Health Conference was recently held online. Check out the conference booklet and list of presentations, including some from People’s CDC members, and join us next year!

Conferences like this are important alternatives to costly in-person conferences that often have few COVID protective measures, though advocacy can result in improved but still limited COVID measures, like partial masking.

Read & share this housing advocacy toolkit that outlines the connections between public health and housing, including the impact of COVID.

The National Institute of Health is seeking participants for Long COVID clinical studies to research possible prevention and treatments.

Notes: 1) The numbers in this report were current as of 11/4. The CDC updates data frequently as it receives refreshed information. Today’s numbers may be slightly different from the data here. 2) Check out the links throughout & see our website for more! https://peoplescdc.org.

Share this:
Translate
Close