People’s CDC COVID-19 Weather Report

Published

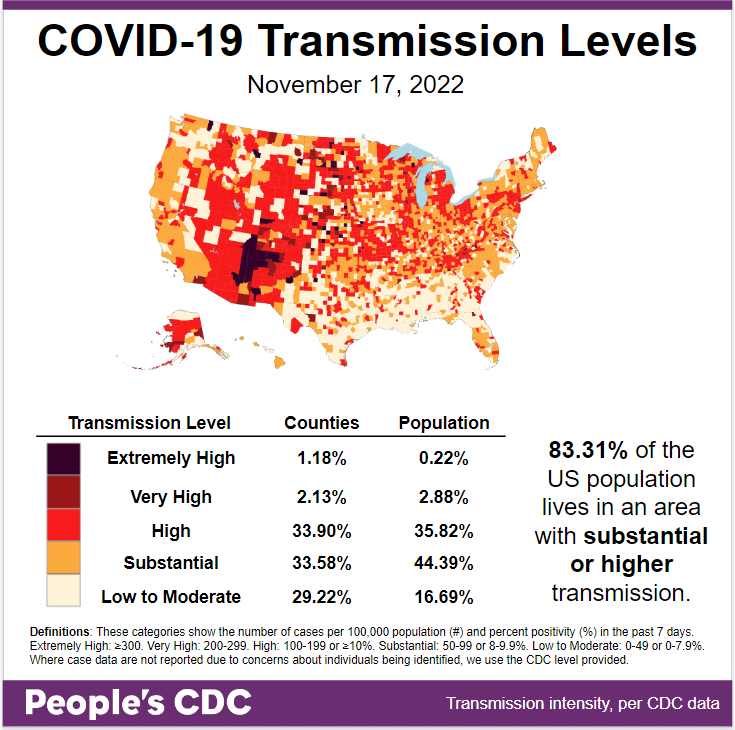
The Weather: Transmission levels continue to remain high, with 83.31% of the population currently living in areas with substantial or higher transmission.

A study published in the CDC’s MMWR found that half of adults surveyed perceived local COVID transmission to be low to moderate, despite sustained high transmission. Unsurprisingly, when people perceived local transmission to be high, they used more preventive behaviors.

So the CDC acknowledges that perception of risk is associated with protective behaviors. Since the CDC refuses to do so, we will continue to tell the truth: Almost the entire country has been experiencing high or substantial transmission for months.

Map and table show COVID transmission levels by US county as of 11/17/22. Low to Moderate transmission levels are pale yellow, Substantial is orange, High is red, Very High is brown, and Extremely High is black. Mountain States are mostly red with some pale, orange, and black. Southwest and Plain States are red, brown, and black. South is pale with orange and red spots. West Coast, East Coast, Midwest, and South FL are red and orange. Text reads: 83.31 percent of the US population lives in an area with substantial or higher transmission. A Transmission Level table shows 1.18 percent of counties (0.22 percent by population) as Extremely High, 2.13 percent of the counties (2.88 percent by population) as Very High, 33.90 percent of counties (35.82 percent by population) as High, 33.58 percent of counties (44.39 percent by population) as Substantial, and 29.22 percent of counties (16.69 percent by population) as Low to Moderate. The People's CDC created the graphic from CDC data.
The People’s CDC created the graphic from CDC data.

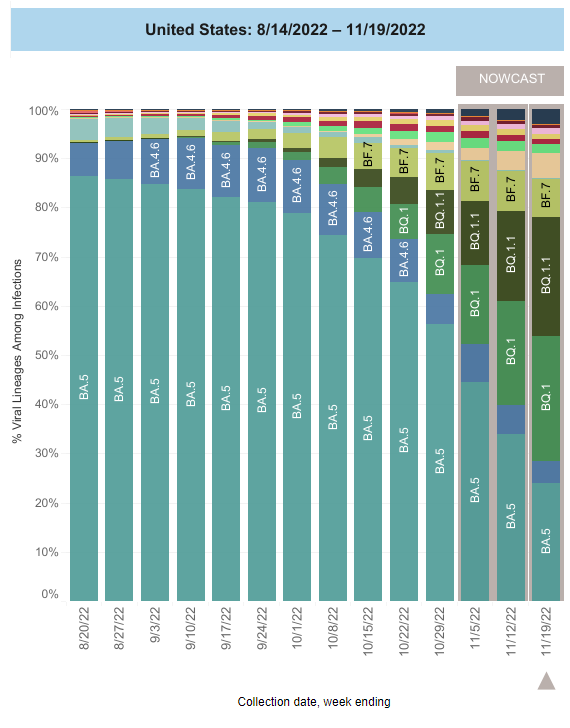
On Variants: The variant picture continues to shift, with BA.5 proportions continuing to drop and BA.5 subvariants BQ.1.1 and BQ.1 continuing to rise.

BA.5 now represents only 24% of cases; in contrast, BQ1.1 and BQ.1 now represent a combined 49.7%, up from 44.2% last week.

Stacked bar chart with weeks on the x-axis shows weeks from 8/20/2022 through 11/19/2022 and y-axis as percent viral lineage among infections. The most recent 3 weeks are labeled as Nowcast projections. BA5 (teal) was the most common lineage overall and has receded over time. From its peak around 8/20 of about 86 percent, it has receded to about 24 percent at present. BQ1 (forest green) and BQ1.1 (olive) increased from barely-visible proportions in August to current estimates of 25.5 and 24.2 percent, making them the 1st and 2nd most common variants this week. BF7(lime green), barely present at the beginning of August, is now 4th this week, remaining steady at 7.8 percent the last 2 weeks. BA4.6 (blue) dropped from 6.0 percent to 4.4 percent, after slowly increasing from about 3 percent in July to about 11 percent in mid-September after which it started decreasing.
Graphic source: CDC COVID Data Tracker: Variant Proportions

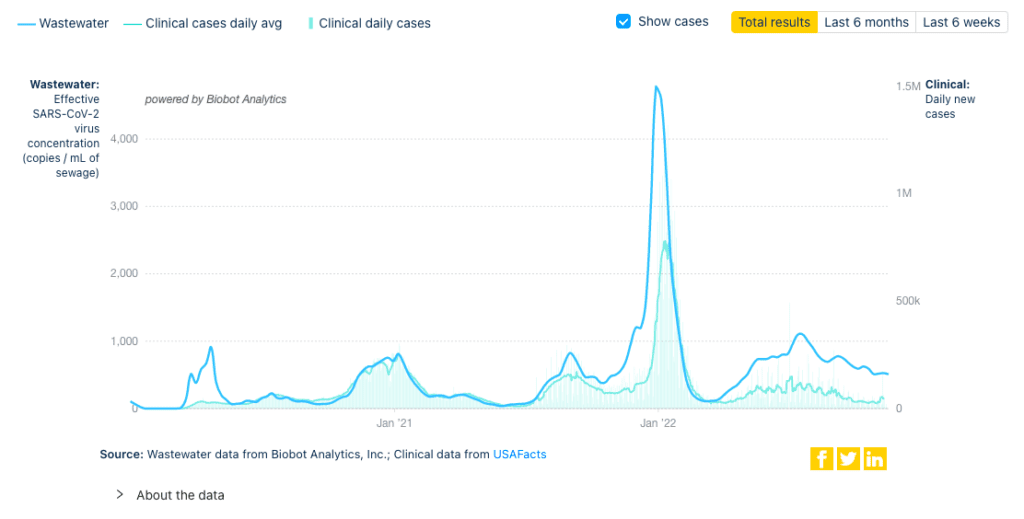
Wastewater Monitoring:  National wastewater levels have remained relatively stable over the past month.

Title reads Covid-19 Wastewater Monitoring in the US. Top text says Data last updated November 17, 2022 from samples collected during the week of November 14. Graph shows weekly wastewater viral concentration and daily clinical cases since the beginning of the pandemic and ending on November 16, 2022. A dark blue line represents viral concentration in copies per milliliter of sewage, and a light blue line represents clinical cases daily average. Since about March 2022, the light blue case line is somewhat erratic and relatively plateaued at well less than 100K. Over the same time, the dark blue wastewater line is persistently higher. It peaks above 1,000 copies/mL in late July 2022 and was decreasing until last week, where it has now plateaued at 508 copies/ml.  Bottom text reads Source: Wastewater data from Biobot Analytics, Inc; Clinical data from USAFacts.
Graphic source: Biobot Analytics

Hospitalizations: New admissions hospitalizations with confirmed COVID remain steady for the past several weeks around 1 per 100,000. However, flu and RSV have created capacity issues in pediatric healthcare systems across the country.

A line chart representing new admissions of patients to hospitals with confirmed COVID in the United States. The chart has New Admissions per 100,000 Population on its y axis and labels of January 2021 to July 2022 on its x axis. New admissions peak at about 5 per 100,000 in January 2021 and 6.5 per 100,000 in January 2022, with smaller peaks happening in August 2021 (about 3.7 per 100,000) and July 2022 (about 2 per 100,000). The line gradually decreases after the July 2022 minor peak to about 1 per 100,000 at the right most point. This week’s data show the continuation of a slight uptick.
Graphic source: CDC COVID Data Tracker: New Hospital Admissions

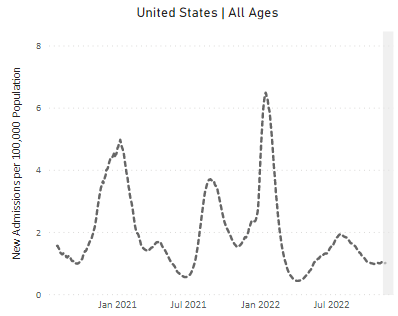
Read a letter from over 30 physicians groups to the White House describing the overwhelmed state of pediatric emergency rooms and hospitals across the country and calling on the Biden Administration to help.

The Biden Administration declined their request, saying that the issues described in the letter were to be addressed at the local level.

Deaths: Between November 9 and November 16, 2,222 people died of COVID nationally. Over 245,000 people have died of COVID in the US this year so far.

Forecast: With air travel estimated to be the highest this Thanksgiving since the start of the pandemic and protections such as mask mandates abandoned we may see increases in cases over the next few weeks.

This week, the People’s CDC released guidance for Safer In-Person Gatherings. While the safest option is always to move gatherings to a remote format, we understand that many people will gather in-person. These guidelines describe various layers of protection to #SeeYouSafer.

On a warm-toned gradient background, bold white text reads, “Protecting only ourselves is insufficient. Protecting each other is urgent.” Below, three illustrated figures stand next to each other all wearing masks. A mauve band overlaid on the figures reads “#SeeYouSafer” in bold white text. Smaller white text at the bottom reads “SeeYouSafer.org.”
SeeYouSafer.org

Take Action: Want to join the calls to demand protections for workers? @NationalNurses put out this amazing tool to help us write letters to the editor requesting permanent OSHA Standard for COVID-19.

#COVIDIsAirborne and #BringBackMasks trended again in reference to CDC director and Biden administration continued omission of universal masking for prevention of COVID and other respiratory viruses. We must continue to organize and fight dangerous public policy.

Over 48k graduate workers & post-docs across the University of California system are on strike. Organizers are working to include more COVID-19 protections in the contracts. If you join the in-person picket lines, be sure to follow these covid safety tips.

Notes: 1) The numbers in this report were current as of 11/17. The CDC updates data frequently as it receives refreshed information. Today’s numbers may be slightly different from the data here. 2) Check out the links throughout & see our website for more! https://peoplescdc.org.

Share this:
Translate
Close