People’s CDC COVID-19 Weather Report

Published

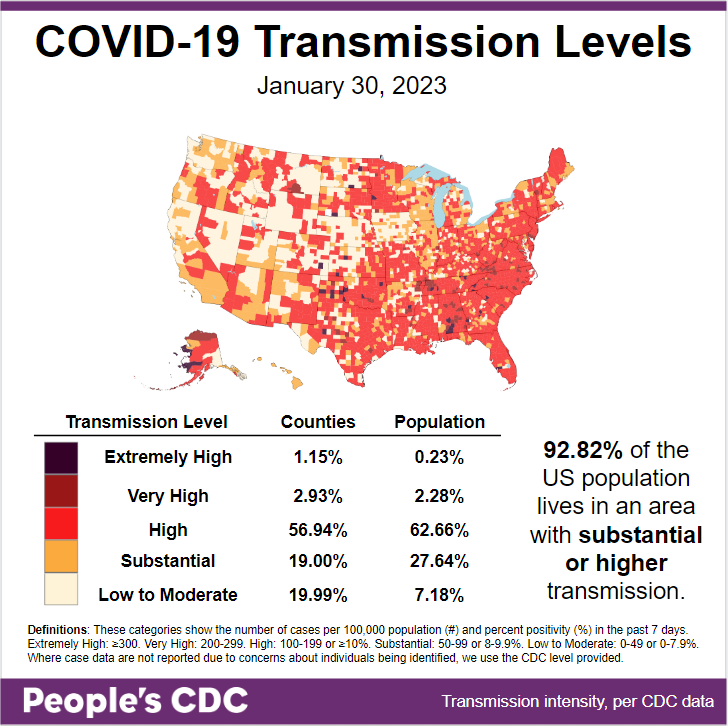
The Weather: Transmission levels remain high, with 92.82 percent of the population living in areas with substantial or higher transmission. Rates are particularly high in the South, part of the Midwest, and the East Coast, with lower levels in the West.

Map and table show COVID transmission levels by US county as of January 30, 2023 based on the number of COVID cases per 100,000 population and percent positivity in the past 7 days. Low to Moderate transmission levels are pale yellow, Substantial is orange, High is red, Very High is brown, and Extremely High is black. Eastern, southern, and parts of Midwest are almost all red, while the northwest is pale yellow and orange. Text in the bottom right reads: 92.82 percent of the US population lives in an area with substantial or higher transmission. Transmission Level table shows 1.15 percent of counties (0.23 percent by population) as Extremely High, 2.93 percent of the counties (2.28 percent by population) as Very High, 56.94 percent of counties (62.66 percent by population) as High, 19.00 percent of counties (27.64 percent by population) as Substantial, and 19.99 percent of counties (7.18 percent by population) as Low to Moderate. The People's CDC created the graphic from CDC data.

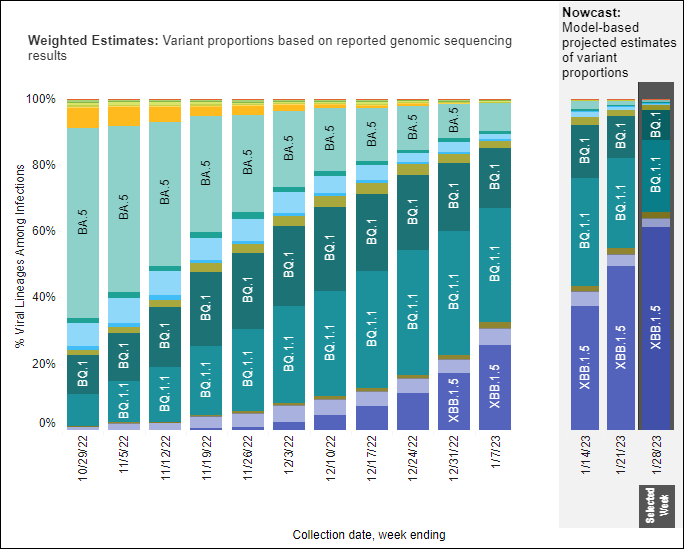
On Variants: This week, variant XBB 1.5 (Kraken) remains the most common variant (61.3%). It continues to dominate in the Northeast and is taking a larger share as it moves west across the U.S.

A stacked bar chart with weeks on the x-axis shows weeks from October 29, 2022 to January 28, 2023 and y-axis as percentage of viral lineages among infections. The recent 3 weeks are labeled as Nowcast projections.  XBB.1.5 (dark purple) continues to increase, making up about 61.3 percent of current week infections. BQ.1.1 (teal) has decreased in recent weeks but remains the second most prevalent lineage currently around a quarter of infections. BQ.1 (dark teal) is now about half as prevalent as BQ.1.1 but remains visibly labeled. BA.5 (light teal), which in October was the dominant lineage, is now down to nearly zero visibility - joined by XBB (periwinkle purple) and a handful of other colors in the week ending January 28, 2023.
Graphic source: CDC COVID Data Tracker: Variant Proportions

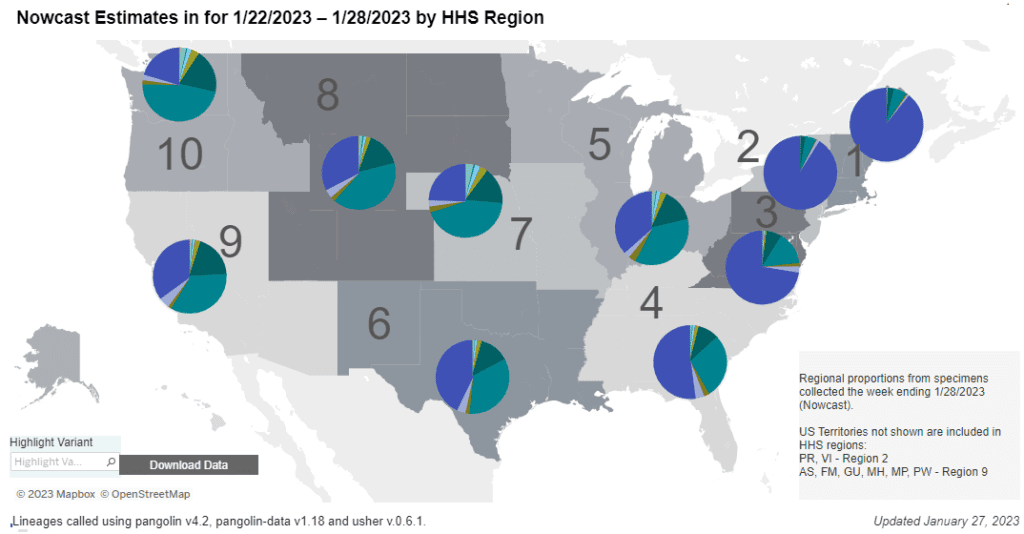
Regional differences in dominant variants continue. Kraken (dark purple) is dominant in the Northeast and Southeast, and is gaining rapidly in other regions currently dominated by BQ1/1.1 (teal green).

Regional difference map of the US with 10 regions each with roughly 3 or 4 states depicted as shades of gray. Title reads “Nowcast Estimates in for 1/22/2023 to 1/28/2023 by HHS Region.” Each region has a colored pie chart showing variant proportions. Legend at bottom right reads “Regional proportions from specimens collected the week ending 1/28/2023” and “US Territories not shown are included in HHS regions: PR, VI - Region 2. AS, FM, GU, MH, MP, PW - Region 9.” XBB1.5 (dark purple) makes up nearly 90 percent of the pie in regions 1 and 2 (Northeast), almost 75 percent in region 3 (Mid-Atlantic) and ranges from about 20 to 50 percent elsewhere. BQ1.1 (teal) shares less than 30 percent of region 4’s infections and remains nearly the most dominant lineage in regions 5 to 10. Bottom text reads: “Updated January 27, 2023” and  “Lineages called using pangolin v4.2, pangolin-data v1.18 and user v.0.6.1.”
Graphic source: CDC COVID Data Tracker: Variant Proportions

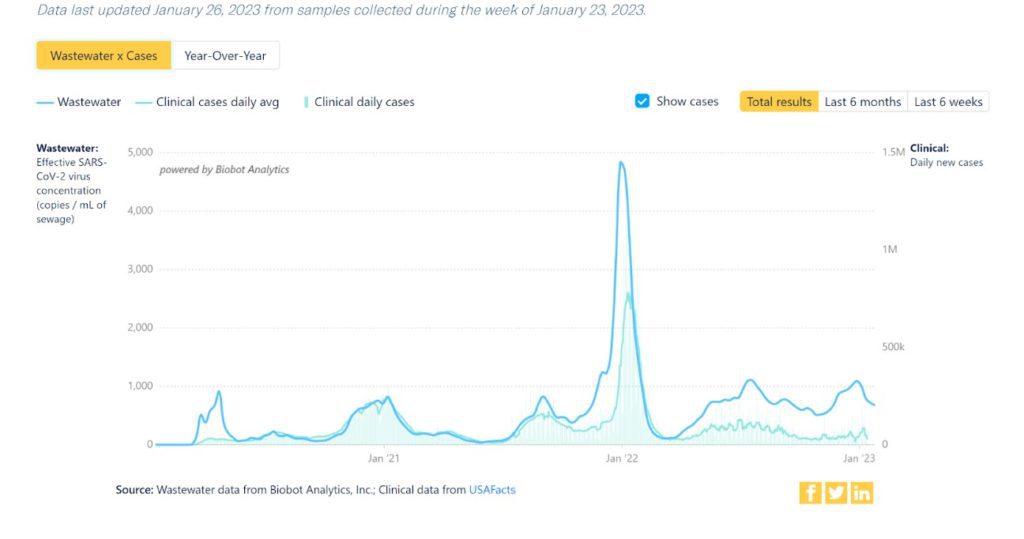
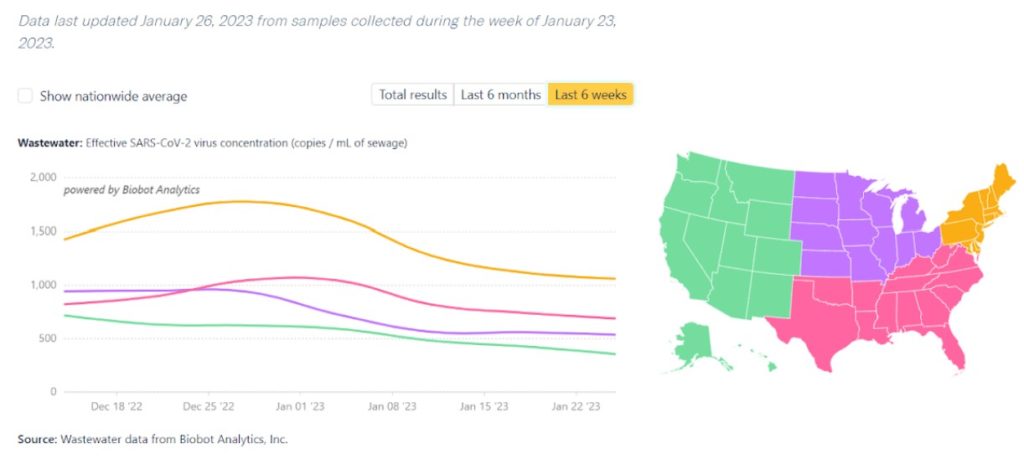
Wastewater Monitoring: National wastewater levels continue to decline, although they may be starting to plateau. This would continue a pattern of elevated baseline levels with smaller peaks which we’ve been seeing since May of last year.

Graph shows weekly wastewater viral concentration and daily clinical cases since the beginning of the pandemic. Top text says “Data last updated January 26, 2023 from samples collected during the week of January 23, 2023.” A dark blue line marks viral concentration in copies per milliliter of sewage, with a left y-axis from 0 to 5,000. A light blue line marks the average daily new clinical cases, with a right y-axis from 0 to 1.5 million. Since about March 2022, the light blue case line is a bit erratic and relatively plateaued at well less than 100K. Over the same time, the dark blue wastewater line is persistently higher. It peaked above 1,000 copies per mL in late July 2022 and was decreasing until the end of October. A notable increase occurred early in January 2023, rivaling July numbers just over 1,000 copies/mL. It’s now downtrending slightly. Bottom text reads: “Source: Wastewater data from Biobot Analytics, Inc; Clinical data from USAFacts.”
Graphic source: Biobot Analytics

Wastewater levels regionally show a similar plateau as the national average, with levels highest in the Northeast.

Title reads “Covid-19 Wastewater Monitoring by Region. This chart depicts the varying levels of Covid-19 detected in wastewater samples across different regions of the U.S.” Line graph shows effective SARS-CoV-2 virus concentration as copies per mL of sewage on a y axis with an x axis showing 6 weeks of time between December 18 and January 22. Each of 4 regions has a different color trend line. A legend map of the US on the right shows the West region as green, South as pink, Midwest as purple, and Northeast as orange. Northeast (orange) has the highest virus concentration over the past 6 weeks, increasing throughout December, and then declining in the past 4 weeks, most recently starting to plateau around 1,000 copies per mL. South (pink) has been more stable, slightly decreasing to about 700 copies per mL over the past week and second highest, followed by Midwest (purple) near 500 copies per mL, and West (green) around 350 copies. Source: Wastewater data from Biobot Analytics, Inc.
Graphic source: Biobot Analytics

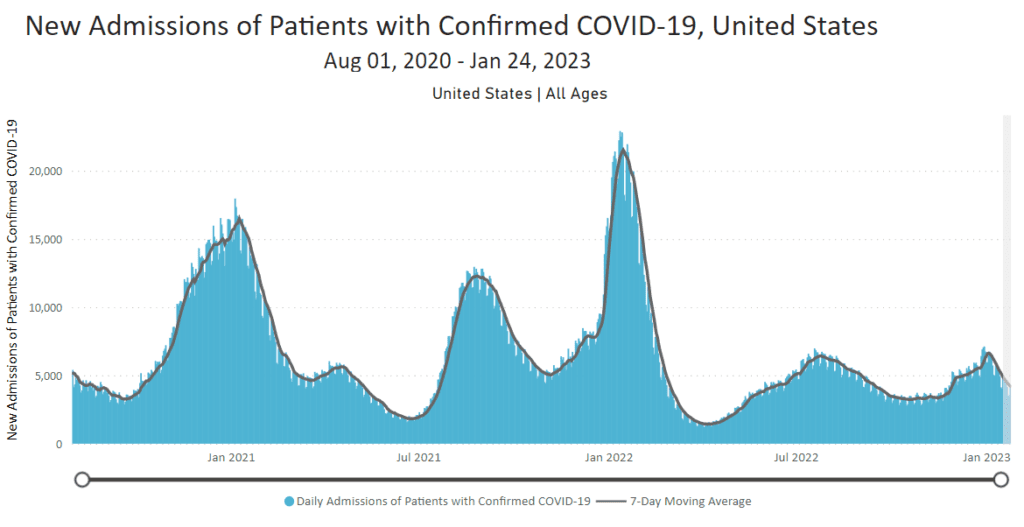
Hospitalizations: Hospitalizations for confirmed COVID cases continue to decline with the national average currently around 4,200 new patients. Due to the lag in reporting of hospitalizations, the recent decline may not be accurate.

A teal line graph represents new hospital admissions of patients of all ages with confirmed COVID in the United States between August 2020 and January 2023. A solid dark brown line outlines the general trend of the line graph, representing the 7 day moving average of daily admissions. Admissions peak in January 2021, August 2021, and January 2022. The highest peak on the map is in the second week of January 2022, at over 20,000 admissions. There is a more modest increase in July and August of 2022, to a peak of around 6,400, and a nadir around 3,300 in November. In December 2022, rates began to rise again, peaking around 7,000 with a 7-day average peak of around 6,600, before beginning to decline again after the first week of January. As of January 23, the 7-day average for hospitalizations is around 4,200 new admissions.
Graphic source: CDC COVID Data Tracker: New Hospital Admissions

Deaths: The week of January 25, at least 3,756 people died of COVID nationally.

FDA recently voted on pivoting to a long-term immunization strategy, indicating a shift to an endemic framing. Following this recommendation would effectively accept 500+ daily deaths.

Cardiovascular deaths increased substantially and unexpectedly in 2020, likely because of COVID. BIPOC communities saw the largest increases, reflecting COVID infections and existing health disparities.

Long COVID: A study of university students, faculty, and staff found 36% of COVID survivors experienced Long COVID. As universities roll back protections such as contact tracing, testing, and masking, we ask: are our university members expected to accept this risk?

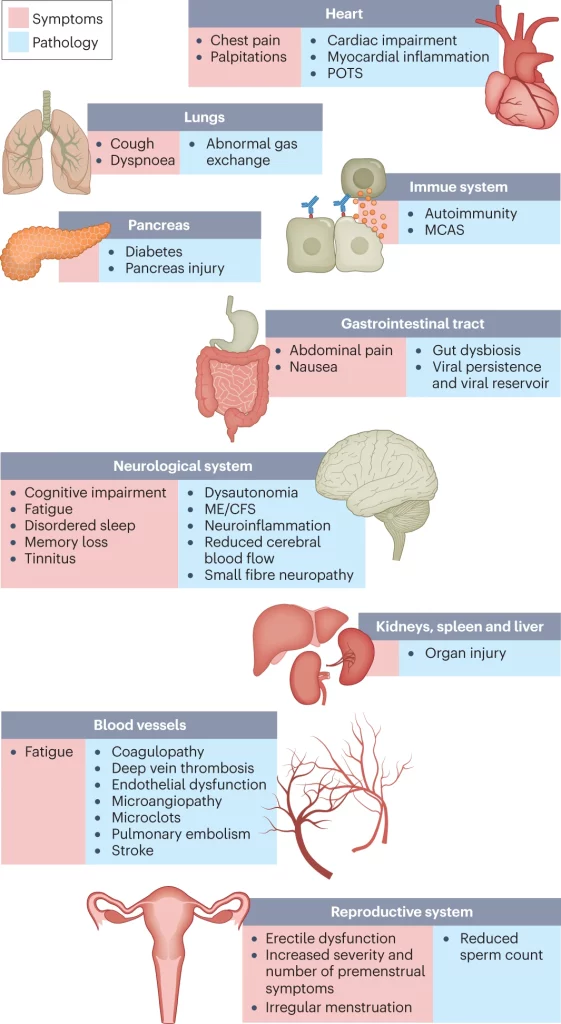
A review of Long COVID highlighted last week includes a summary graphic of Long COVID symptoms and impacts on organs. This may be helpful for Long COVID patients to share with their medical providers to show the range of possible health effects of COVID.

Image with 9 squares, each an organ, with left (symptoms or sym) and right columns (pathology or path) of Long COVID. Heart sym: chest pain and palpitations; path: cardiac impairment, myocardial inflammation, POTS. Lung sym: cough, dyspnea; path: abnormal gas exchange. Immune no sym; pathology: autoimmunity, MCAS. Pancreas no sym; path: diabetes, pancreas injury. GI tract sym: abdominal pain, nausea; path: gut dysbiosis, viral persistence, viral reservoir. Neuro sym: cognitive impairment, fatigue, disordered sleep, memory loss, tinnitus; path: dysautonomia, ME/CFS, neuroinflammation, reduced cerebral blood flow, small fiber neuropathy. Kidneys, spleen, liver with no sym; path: organ injury. Blood vessel sym: fatigue; path: coagulopathy, deep vein thrombosis, endothelial dysfunction, microangiopathy, microclots, pulmonary embolism, stroke. Reproductive sym: erectile dysfunction, increased severity and number of premenstrual symptoms, irregular menstruation; path: reduced sperm count.
Graphic source: Davis H, et al. Long COVID: major findings, mechanisms and recommendations. Nature. 2023.

A new Kaiser report estimates that 5% of adults in the US are experiencing serious limitations from Long COVID. This is yet another example of the impact of sustained community transmission, despite mixed messages from the Biden administration and CDC.

Vaccines: The CDC has confirmed that the bivalent booster is effective against Kraken. If your last vaccine was August or earlier, you’re due for a booster.

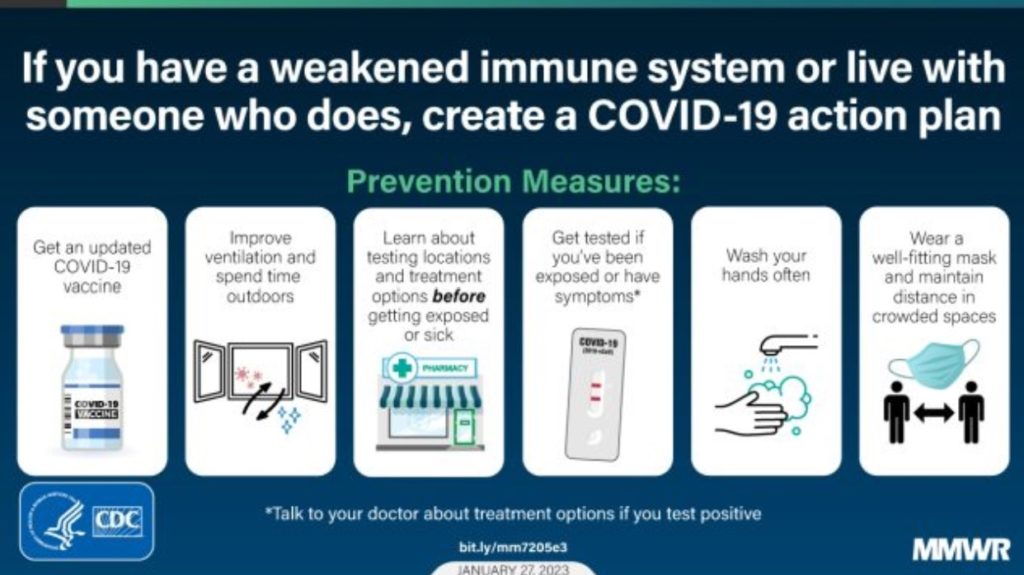
Forecast: The CDC released guidance for immunocompromised people that should apply to everyone, especially given developing research on COVID’s impact on immune systems

Even if someone is capable of following this guidance, material conditions still increase one’s risk of infection. We believe public policy such as mass testing, paid sick leave, and mask mandates are necessary to reduce COVID’s spread.

Image from the CDC MMWR (Morbidity and Mortality Weekly Report), dated January 27, 2023. Heading reads “If you have a weakened immune system or live with someone who does, create a COVID-19 action plan.” It lists prevention measures, including: get an updated COVID-19 vaccine (with an image of a vaccine vial), improve ventilation and spend time outdoors (with image of an open window with bidirectional arrows, red viral particles going out and blue sparkles indicating fresh air coming in), learn about testing locations and treatment options before getting exposed or sick (with image of a pharmacy), get tested if you’ve been exposed or have symptoms (with image of a positive rapid test, and asterisk stating “talk to your doctor about treatment options if you test positive”), wash your hands often (with image of hand-washing), and wear a well-fitting mask and maintain a distance in crowded spaces (with image of a mask and 2 stick figures with a double-head arrow indicating space).
Source: MMWR http://dx.doi.org/10.15585/mmwr.mm7205e3

It is more clear than ever that the Biden administration has no interest in protecting the health of US citizens. While we advocate for a more robust public health approach than a vaccine only strategy, vaccine privatization would further limit access.

Take Action: A new “directory of mental health providers who continue to take you and COVID seriously” is in development. If you’re a mental health provider, you can add info about your practice, including your in-office COVID precautions, to the directory.

Notes: 1) The numbers in this report were current as of 1/27/23. The CDC updates data frequently as it receives refreshed information. Today’s numbers may be slightly different from the data here. 2) Check out the links throughout & see our website for more! https://peoplescdc.org.

Share this:
Translate
Close