
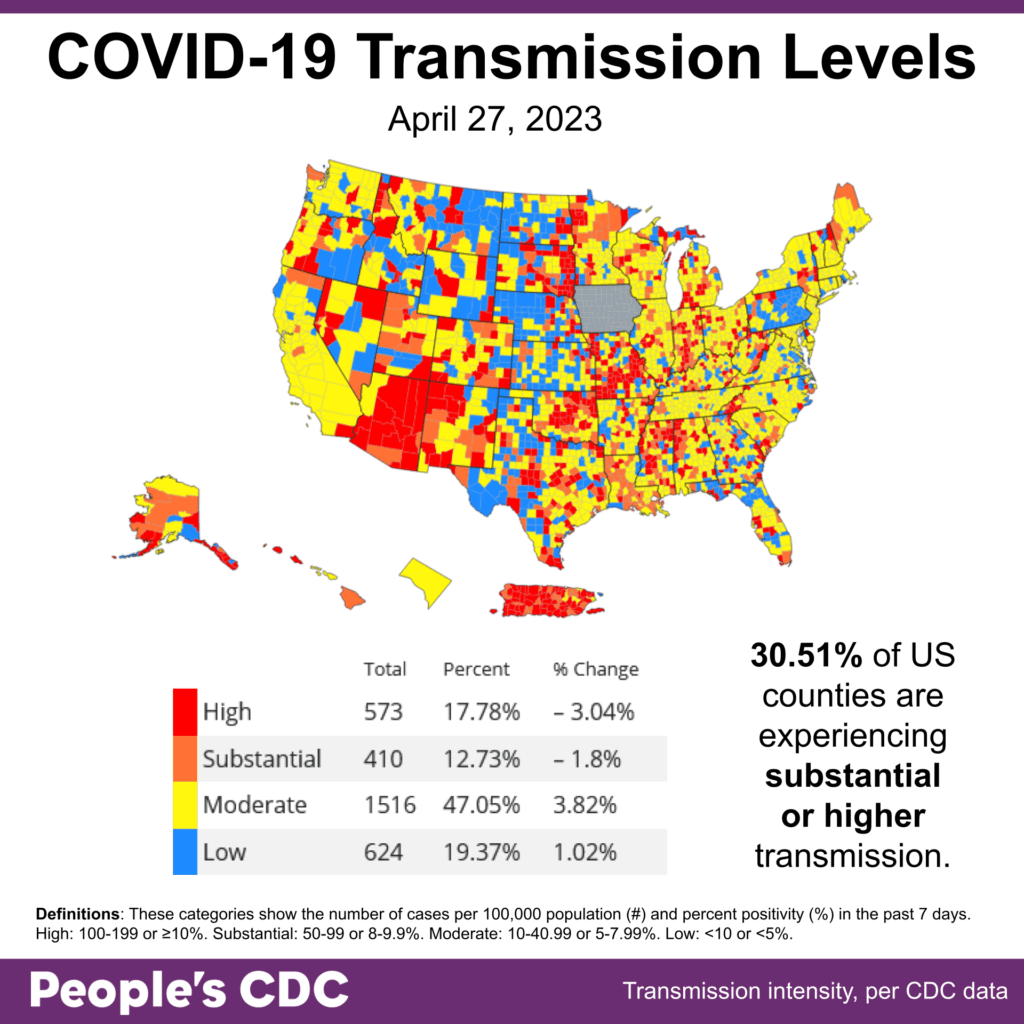
The Weather: As of April 27, about 31% of US counties are experiencing substantial or higher COVID transmission and 47% at moderate transmission based on available data.
Although fewer parts of the country are experiencing high rates of COVID transmission, the current state of the COVID pandemic requires that we remain vigilant in most areas across the US as this trend similarly occurred in the first half of calendar year 2021.
As of April 1, Iowa (shown in gray) no longer reports COVID data to the CDC (Note: More states may appear in gray as the current Biden administration works to end the Public Health Emergency).
WINS
People continue to fight locally and nationally to protect each other from the harms of COVID! This week, we’re continuing to highlight those fighting to #KeepMasksInHealthcare.
With your support, over 400,000 letters were sent to the Chief Executive Officers and Chief Medical Officers of healthcare systems across the country in a push to maintain universal masking. The People’s CDC also organized a phonebank last week to demand legislators preserve protections in healthcare including universal masking in healthcare settings and the continuation of free PCR testing programs.
Our neighbors up north in Vancouver, British Columbia, through @DoNoHarmBC, organized a protest with a mock die-in at the office of their public health officials to express the ongoing severe risk of mortality and demand the return of universal masking in high-risk and healthcare settings.
Overseas, the Health Ministry of Italy announced that they will minimally maintain universal masking in healthcare settings through the end of calendar year 2023, which will keep healthcare settings safer for all.
You can get involved locally or nationally, go to @mandatemasksus to keep up on all sorts of mask-related advocacy no matter where in the country you are!
On Variants
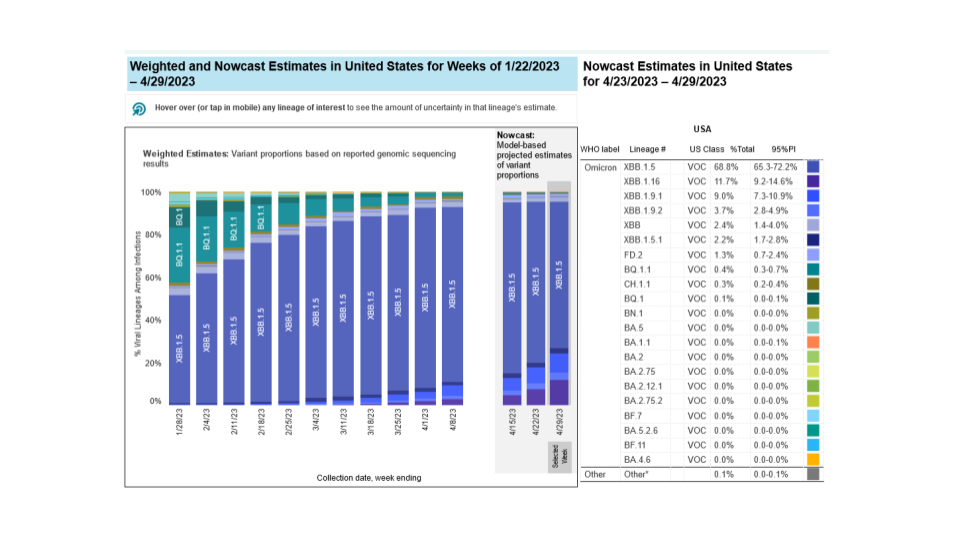
XBB.1.5 (Kraken) remains the most prominent variant in the US, representing 68.8% of cases as of 4/29/2023, a slight decrease from last week.
XBB.1.16 (Arcturus) is dark purple on the CDC’s variant proportion graph and is the second most prevalent variant, representing 11.7% of cases – a slight increase over the last few weeks. XBB.1.9.1 (Hyperion) shows a slight increase to 9.0% as the third most prevalent variant.
Wastewater Monitoring
National wastewater data continues to plateau, with the Midwest, Northeast, and South mirroring that trend, while the Western region of the country actually shows a slight decrease this past week.
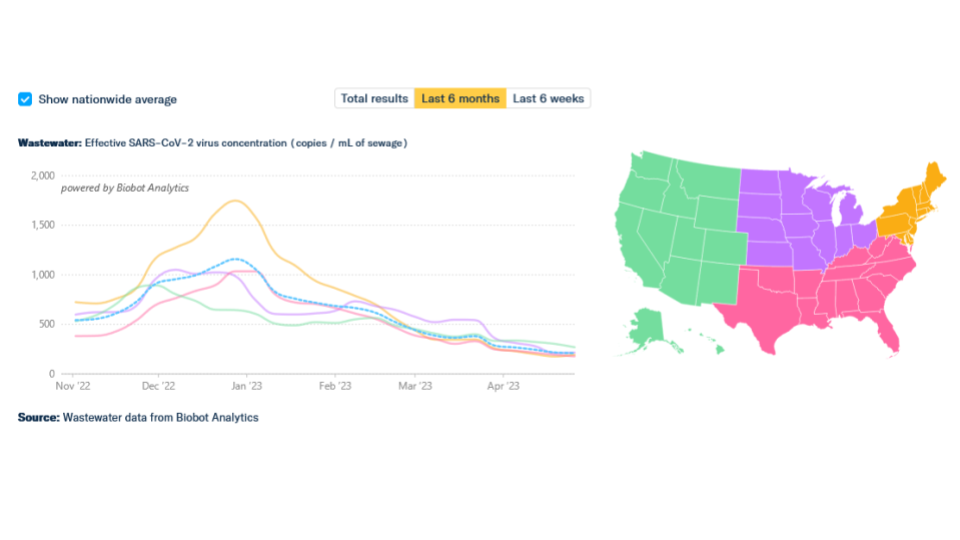
Some regions of the country can get an even closer view of wastewater levels, including Sars-Cov2 and other dangerous pathogens, in their area using: https://data.wastewaterscan.org/
Hospitalizations
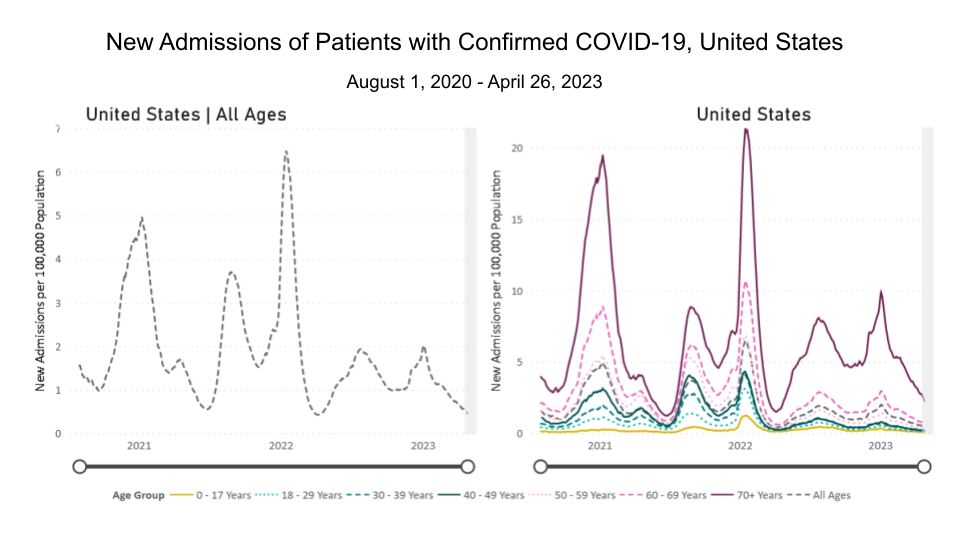
Hospitalizations continue on a downward trend reaching near lows of mid 2021 and early 2022. The national average as of April 26, 2023, was 0.45 new admissions per 100,000 population, and in the 70 years and older age group the hospitalization rate was 2.26 per 100,000 population.
Deaths
For the reporting week ending April 12, 2023, 1,052 Americans died of COVID. Over 1,130,662 Americans have died from COVID since the beginning of the pandemic.
External Review
In the face of on-going and ever increasing political and corporate pressure to return to unsafe pre-pandemic activities despite the growing death toll and millions affected by long COVID and in direct response to the CDC’s own internal review from Spring 2022, the People’s CDC launched our own People’s Review of the CDC.
Titled, “Too Many Deaths, Too Many Left Behind,” it calls on the CDC to implement evidence-based and ethical public health approaches that protect people. Please share the external review with others to demonstrate what is needed to improve public health and demand for a proper response from the CDC in the future.
Reinfection and Long COVID
While the issue is still being studied, repeat COVID infections may put people at higher risk of additional health issues in the future, according to this news article from the Nature Science Journal.
Although some scientists have slightly different views, we still do not completely understand the full extent of the harms caused by a COVID infection/reinfection or the full implications of Long COVID. At this point, the only way to avoid these health complications or Long COVID is to avoid a COVID infection or reinfection altogether.
Get Involved
Policy
#KeepthePHE! Demand that the Biden Administration maintains the Public Health Emergency past May 11, 2023. Sign this letter to voice your support. Call the White House – 202-456-1111!
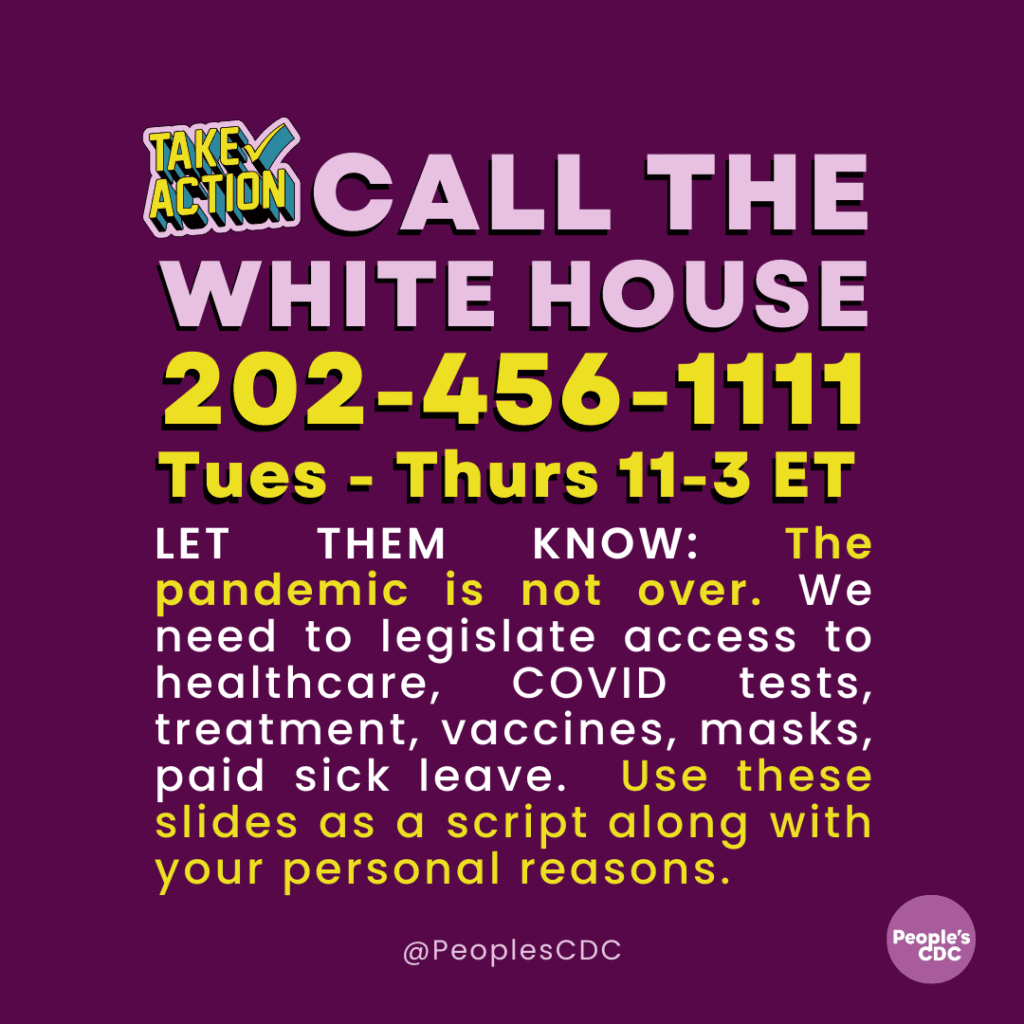
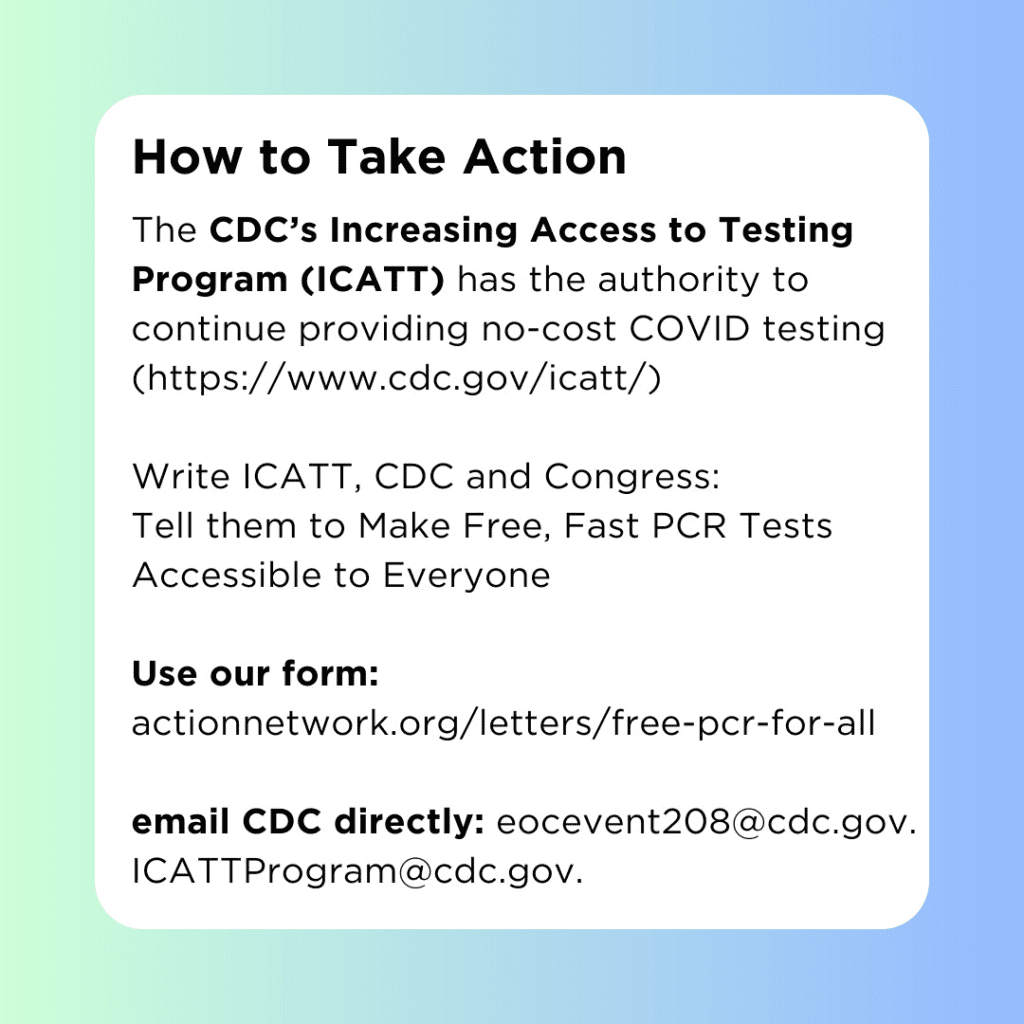
We must maintain free access to PCR testing, COVID vaccines, and the CDC must continue conducting surveillance and publicly report COVID cases across the country at the county and national levels. Learn more about the consequences of the end of the Public Health Emergency here. Take action by following the steps below:
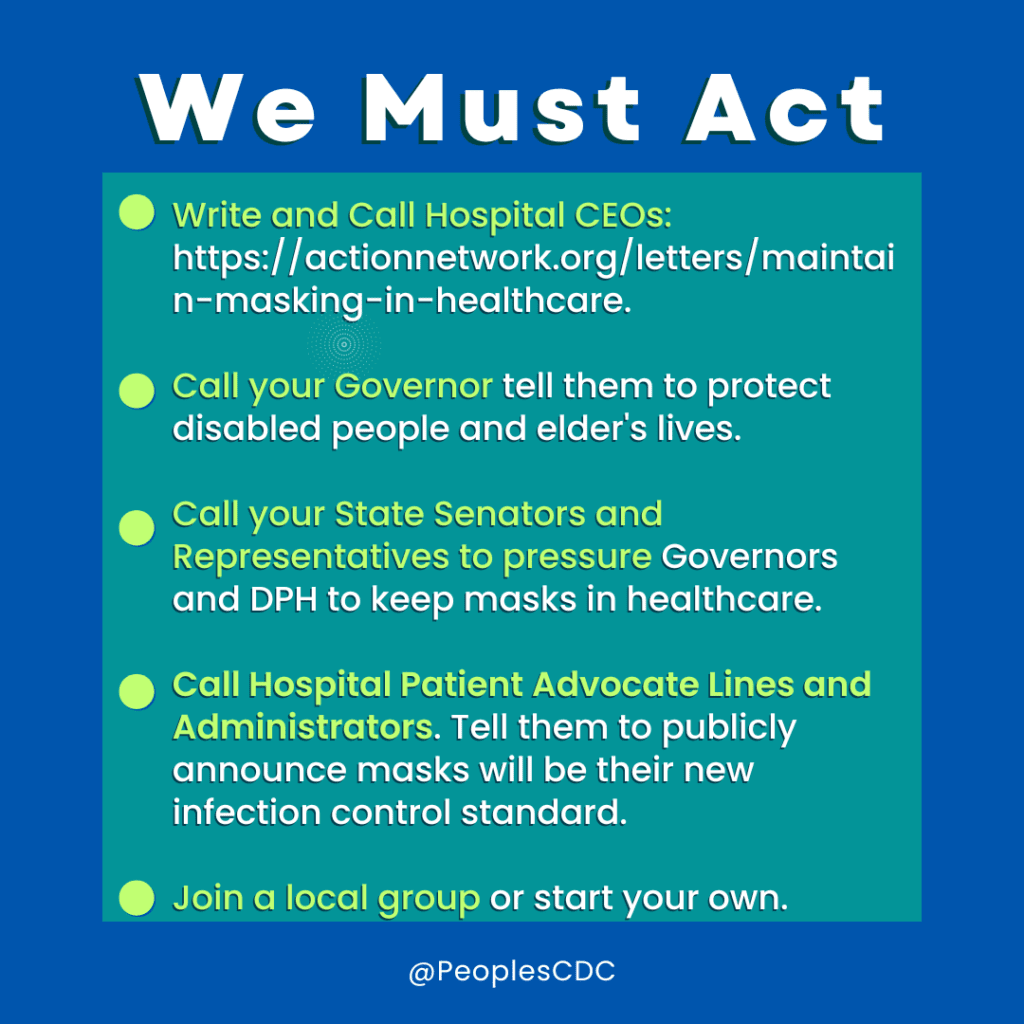
Universal Masking
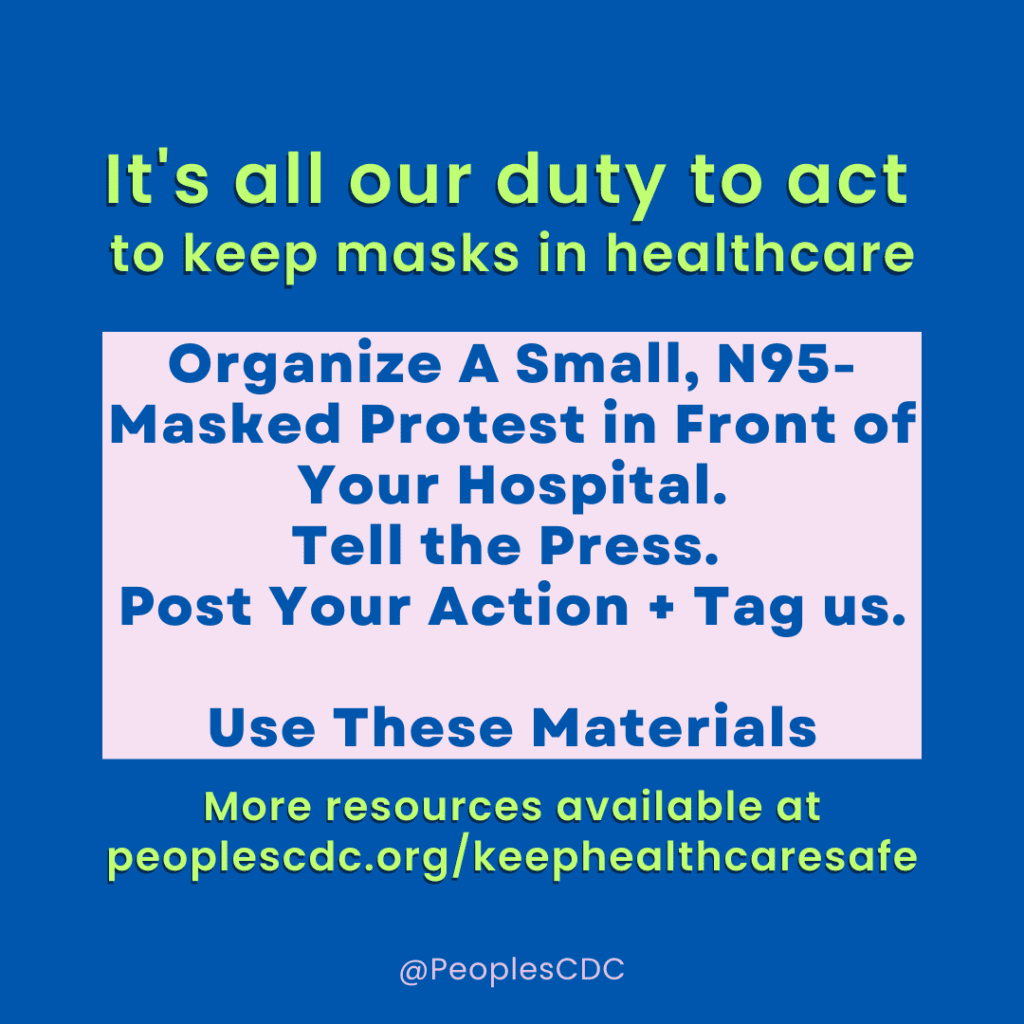
Contact your local healthcare system and demand universal masking in healthcare settings. You can find scripts on what to say and specific contact information for your local hospital here. Consider protesting in front of your local healthcare system, an organization in Maryland successfully accomplished this.
Protect yourself, whatever the weather
Even though the CDC could not prevent their own conference from having a COVID outbreak because they did not implement any layers of protections, there are many layers of protections that you can implement affordably and practically in many different situations and environments to ensure safer in-person gathering.
If you have insurance, make sure to get your monthly 8 rapid COVID tests at your local pharmacy assuming that the current administration continues to end the Public Health Emergency on May 11th.
Notes: 1) The numbers in this report were current as of 4/27/23. Today’s numbers may be slightly different from the data here. 2) Check out the links throughout & see our website for more – https://bej.gbh.mybluehost.me