
The Weather: While over 1,000 people continue to die from COVID each week in the US, this Thursday, May 11, 2023, marks the planned end of the Public Health Emergency (PHE). As part of a major political push to minimize public recognition of the ongoing harm of the pandemic, the end of the PHE marks a drastic reduction in COVID data tracking as well as other resources.
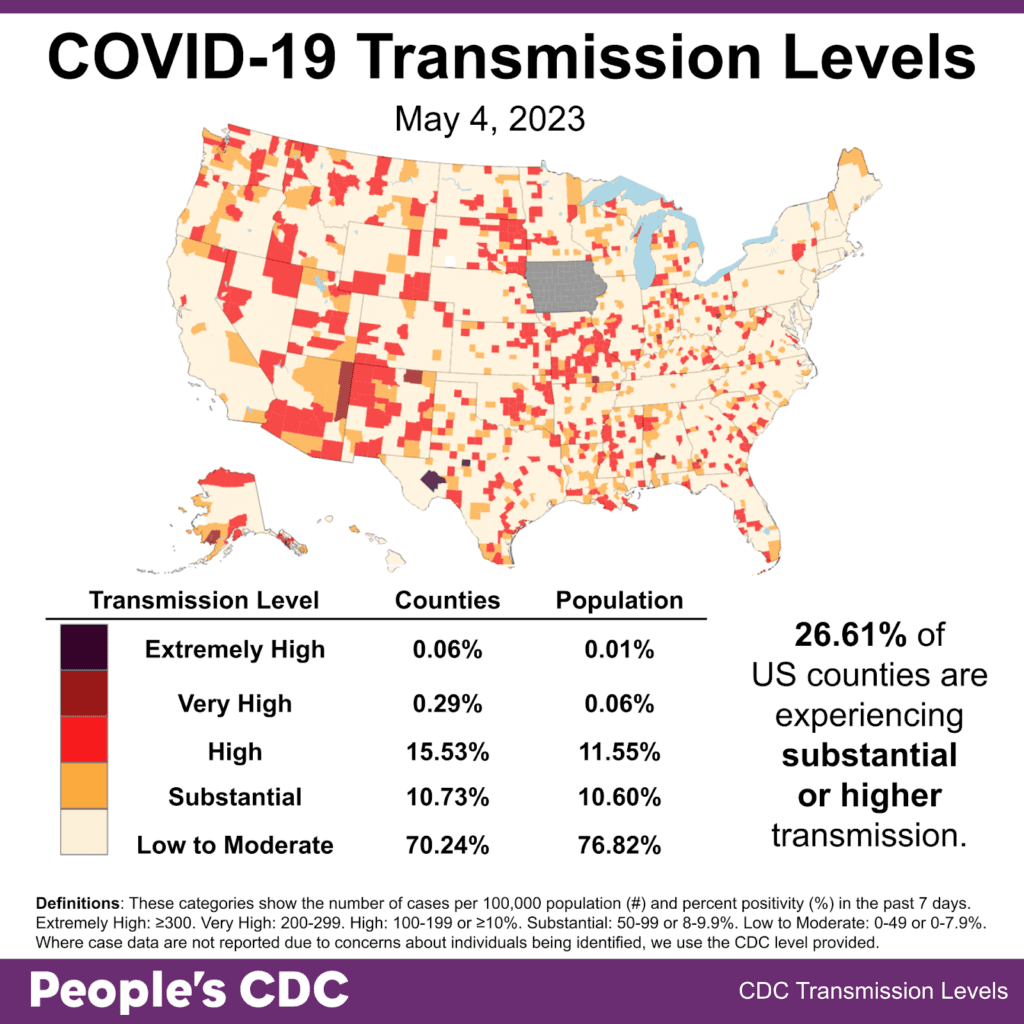
Although the People’s CDC remains committed to educating and informing you about the state of the ongoing pandemic, the COVID transmission map may no longer be available after May 11, 2023, as CDC’s tracking of community transmission (as well as the misleading, pastel-colored community levels) ends with the end of the PHE.
In the US, 26.61% of all counties are experiencing substantial or higher transmission levels based on the available data. This apparent decrease is occurring amid reductions in testing access, with further reductions anticipated with the planned end of the PHE.
CDC Director Rochelle Walensky announced on May 5 that she will resign effective June 30, 2023. Although we do not yet know who the replacement may be, we recommend that the new director read the People’s CDC External Review to learn from the CDC’s past mistakes and to find suggestions to improve the pandemic response going forward.
Meanwhile, the World Health Organization (WHO) ended the COVID Public Health Emergency of International Concern on May 5, 2023. Although the headline versions of this decision continue a disturbing trend toward downplaying the impact of the ongoing pandemic, the WHO full remarks and discussion reveal key recommendations that nations should not downplay the risks of COVID and should not dismantle public health infrastructure.
Wins: On May 4, 2023, more than 30 people showed up for an outdoor, masked, distanced protest to reinstate masking at Massachusetts General Hospital. May 15-21 marks the National Week of Action to Keep Masks in Healthcare. Where leaders have failed us, community members are stepping up to demand protections. Keep reading for more information on healthcare masking at the end of this Weather Report.
High-quality masking was spotted at the Writers Guild of America strike. In solidarity and support, please share the People’s CDC’s tips for safer in person protests with anyone you know who may be out on the picket lines.
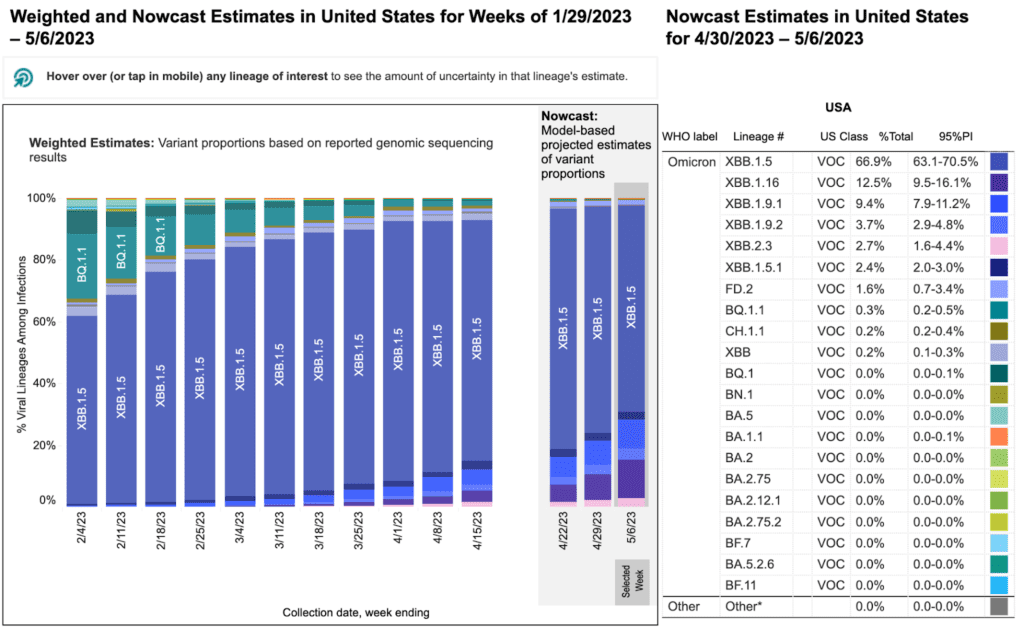
Variants: This week, Kraken (XBB.1.5) continues to predominate, making up 66.9% of cases in the latest week projection for May 6, which is a decrease from last week’s Weather Report. Arcturus (XBB.1.16) continues to increase, now making up 12.5% in the latest week projection.
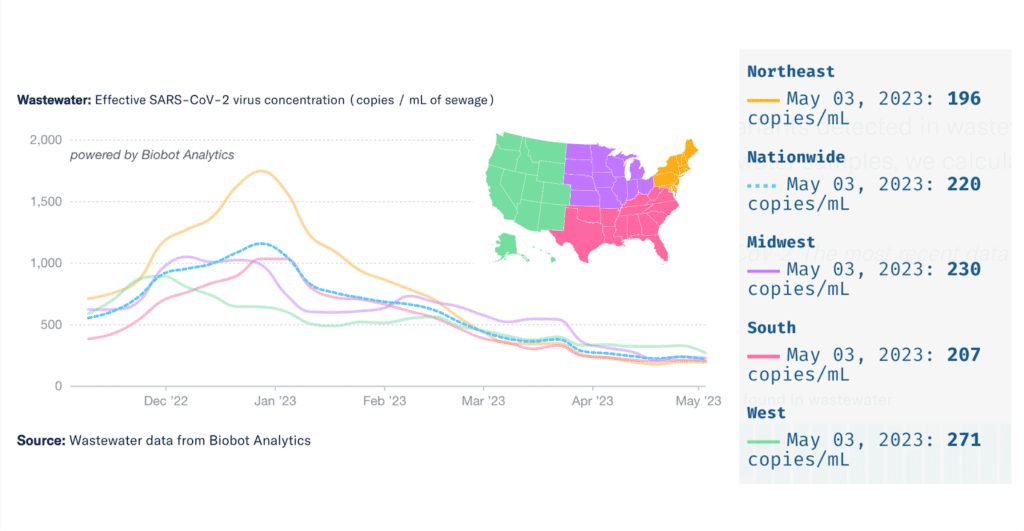
Wastewater Monitoring: Wastewater levels show a recent leveling off to a slight downward trend, regionally and nationally. National and regional wastewater levels are 2-5 times higher than they were at the low point in summer 2021.
Although much of the wastewater surveillance funding is not tied directly to the PHE, future funding is not guaranteed in the long term. Use this letter campaign to tell the White House and your elected representatives that you support funding for wastewater surveillance.
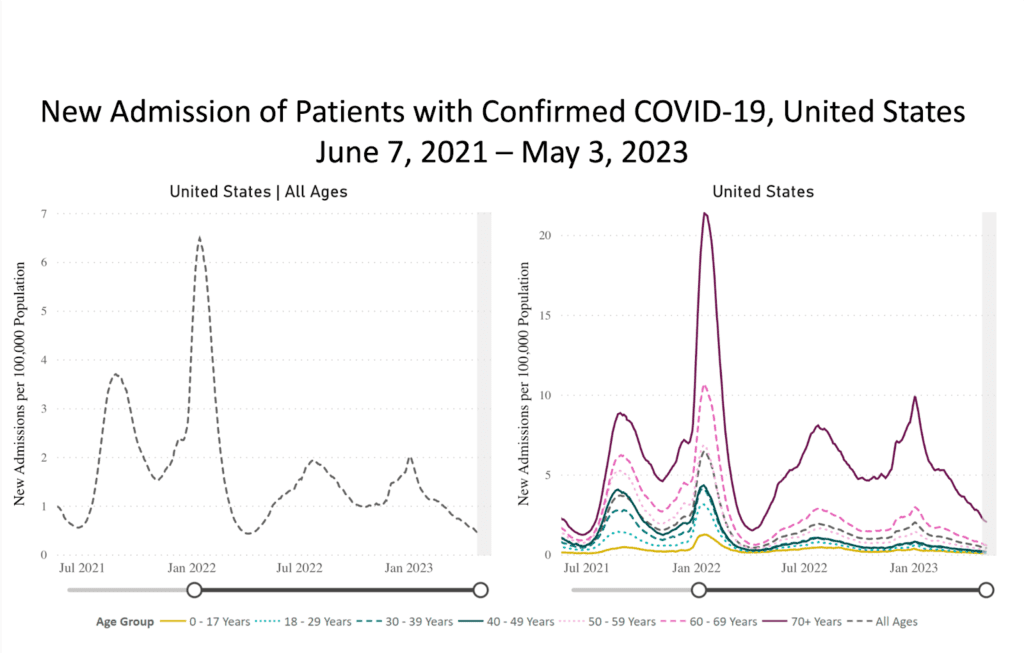
Hospitalizations: Hospitalizations for confirmed COVID cases nationally average 2.05 per 100,000 for ages 70+ and 0.41 per 100,000 for all ages as of May 3, 2023. With the end of the PHE, COVID hospitalization reporting is still required through April 2024. However, frequency will shift from daily to weekly.
Deaths: For the week ending May 3, 2023, 1,109 people died of COVID nationally. At least 1,131,819 people have in total died from COVID in the US.
Forecast: Without large-scale change within the government’s approach to COVID, we are facing significant rollbacks in data tracking and access to COVID-specific support as well as services that support people’s basic needs such as food stamps, Medicaid, and Medicare.
Make sure you take advantage of resources such as getting up-to-date on the latest round of bivalent boosters as well as free rapid antigen tests before the free programs end. Check out our listing of helpful COVID and other essential resources for more information.
Take Action: The widespread dropping of universal masking in healthcare is just the latest example of institutions following the politics rather than protecting people using science-based methods. Join virtual and safer in person actions sprouting up all over the United States to support the National Week of Action to Keep Masks in Healthcare, May 15-21. Check out the People’s CDC’s tips for safer in person protests.
Amid the backdrop of so many disturbing rollbacks of data reporting and protections, we must keep pushing for better protections through collective actions. This means moving beyond venting within echo chambers on Twitter and other social media in order to make our voices heard in ways that rally our communities and reach our elected officials and other leaders.
The People’s CDC stands with you in solidarity as we work toward a better future for all of us.
Notes: 1) The numbers in this report were current as of 5/6/2023. The CDC updates data frequently as it receives refreshed information. Today’s numbers may be slightly different from the data here. 2) Check out the links throughout & see our website for more! https://bej.gbh.mybluehost.me