
The Weather: With the end of the Public Health Emergency you will notice many changes to this week’s weather report, this is not due to an end of the COVID pandemic, but rather due to the further abandonment of public health by the capitalist class.
Changes in data collection and reporting may portray that the COVID pandemic is over, however we at the People’s CDC will continue to analyze the available data to provide you with accurate interpretations.
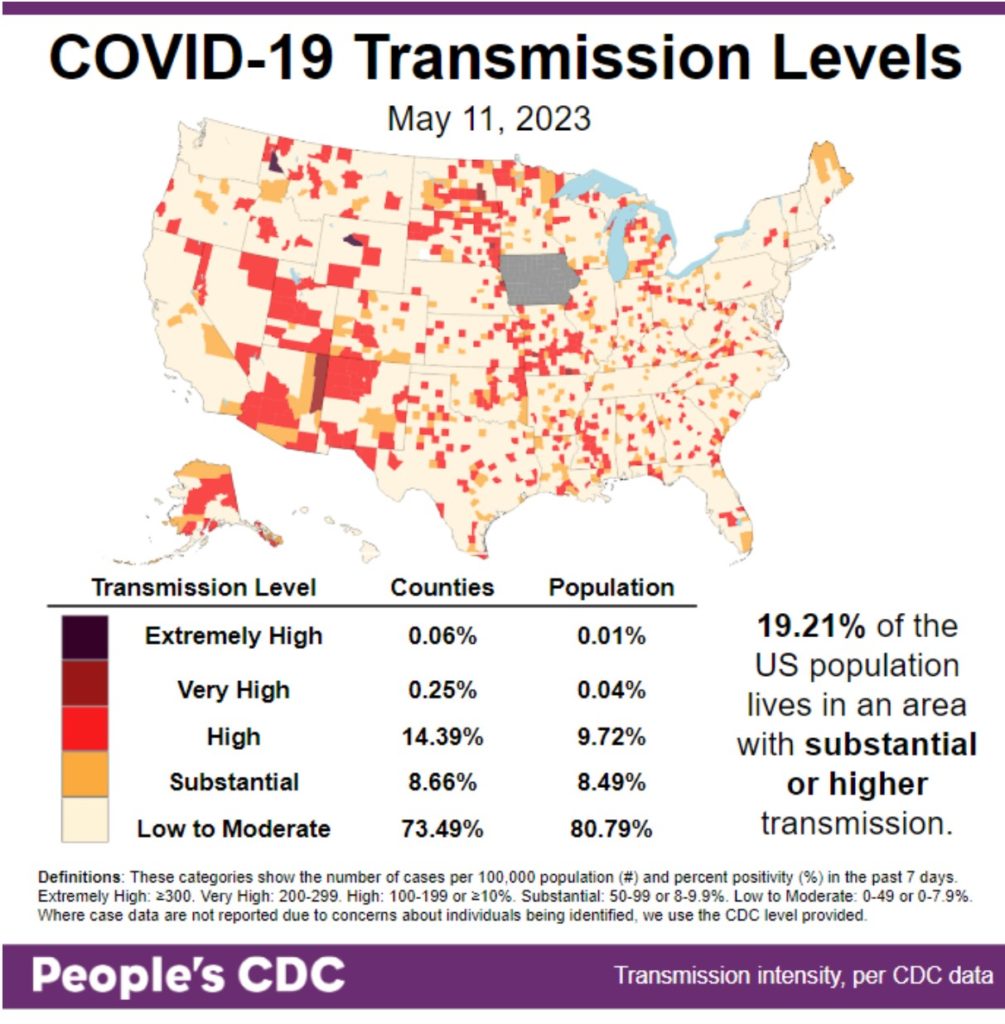
In the US 26.51% of all counties are experiencing substantial or higher transmission levels based on available data. While this is a notable decrease Only 6 months ago 98% of all counties were experiencing substantial or higher transmission.
It seems the Biden regime is taking the former president’s advice “If we stop testing right now, we’d have very few cases, actually“. This dramatic decrease in transmission in the past 6 months is a symptom of privatization of testing and abandonment of tracking and tracing measures, rather than an accurate portrayal of the current state of COVID in the US.
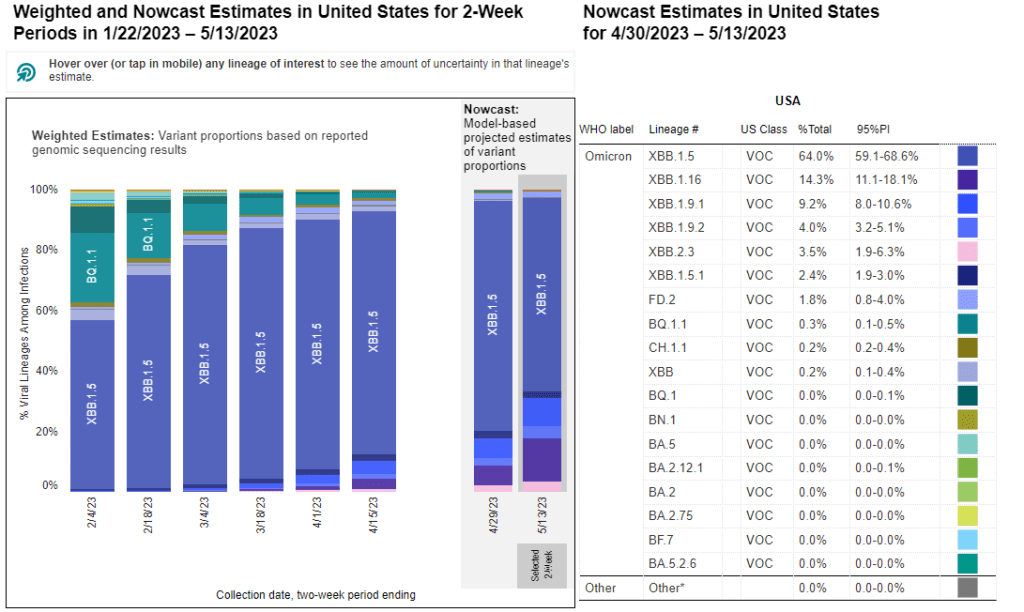
Variants: Variant data will now be reported bi-weekly, Kraken (XBB.1.5) continues to predominate, making up 64% of cases in the latest week projection for May 13. Arcturus (XBB.1.16) continues to increase, now making up 14.3% in the latest two week projection.
Delays in reporting variants marked by the end of the PHE have the potential to delay preventative measures for emerging variants.
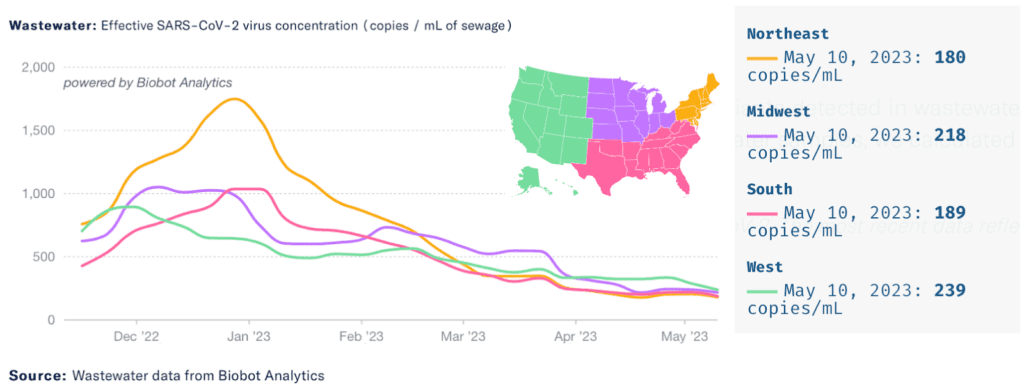
Wastewater Monitoring: Wastewater levels remain relatively the same since last week showing a recent leveling off to a slight downward trend, regionally and nationally. National and regional wastewater levels are 2-5 times higher than they were at the low point in summer 2021.
Wastewater monitoring, while underfunded, will remain in place after the end of the PHE.
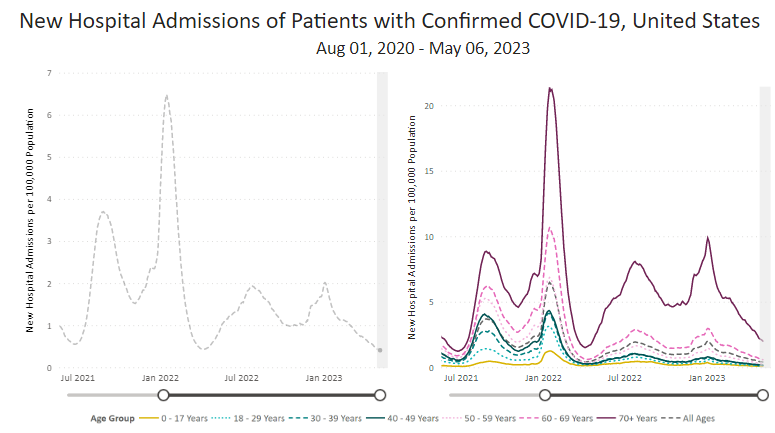
Hospitalizations: With the ending of the PHE, reporting has shifted from daily to weekly. For the week ending on May 6th hospitalizations for confirmed COVID cases nationally average 2.0 per 100,000 for ages 70+ and 0.41 per 100,000 for all ages.
Deaths: Major changes to death data reporting due to the end of the PHE: The CDC has switched to Provisional Deaths from the CDC’s National Center for Health Statistics (NCHS) National Vital Statistics System (NVSS).
The CDC notes that data during recent periods are incomplete because of the lag in time between when a death occurs and when a death certificate is completed, submitted to NCHS, and processed for reporting. This delay can range from 1 week to 8 weeks or more, depending on the jurisdiction. One former Center for Health Statistics employee turned member of the People’s CDC notes that final data were typically delayed by 18 months.
For the week ending in May 6, 2023 the CDC reports that 323 died of COVID. To examine the difference we look back to the week ending in May 3, where CDC had reported that 1,109 people had died.
While Biden claims that his approach has “brought down COVID deaths by 90%”, we know that forcing people back to work didn’t bring down COVID deaths but under-reporting did.
Forecast: Title 42, a rule tied to the PHE that allowed rapid expulsion for migrants and asylum seekers, is also set to expire. However, Alejandro Mayorkas has already stated that over 24,000 border agents are at the southwest border and anyone arriving at the border will be presumed ineligible for asylum.
It is important to fight back against these injustices, public health’s purpose is to care for people not terrorize people.
Take Action: The widespread dropping of universal masking in healthcare is just the latest example of institutions following the politics rather than protecting people using science-based methods. Join virtual and safer in person actions sprouting up all over the United States to support the National Week of Action to Keep Masks in Healthcare, May 15-21. Check out the People’s CDC’s tips for safer in person protests.
The People’s CDC stands with you in solidarity as we work toward a better future for all of us.
Notes: 1) The numbers in this report were current as of 5/12/2023. The CDC previously updated data frequently as it received refreshed information. Today’s numbers may be slightly different from the data here. 2) Check out the links throughout & see our website for more! https://bej.gbh.mybluehost.me