
Wins: The National Week of Action to Keep Masks in Healthcare from May 15 to May 21 saw actions across the country. In New York, images and text supporting masking in healthcare were projected on the outside wall of a hospital that had recently dropped masking protections. In California, over a dozen people participated in a phone banking event over Zoom to keep or bring back masking in healthcare. In Wisconsin, a community informational session over Zoom provided scientific support for masking in healthcare as well as time for community questions and answers.
These are just a few examples from wide-ranging events from the National Week of Action. Check out the resources from the week and hashtag #KeepMasksInHealthcare for inspiration and ongoing efforts. Keep reading for additional actions under the “Take Action” section in this report, and let’s keep this momentum going!
Public Health Critique: In an unfortunate example of its own ineffective policies, the CDC’s recent Epidemic Intelligence Service (EIS) Conference (#CDCEIS23) saw an outbreak of at least 181 COVID cases at its conference with approximately 1,800 in person attendees April 24-27 in Atlanta, Georgia.
Although no hospitalizations have been reported yet among attendees, the CDC’s vaccine-only approach was lucky rather than good, as vaccination reduces but does not eliminate the risk of severe disease. Of those who tested positive, 27% received antiviral medications. The risk of further spread into attendee’s communities as well as the risks of long COVID for the attendees directly (approximately 18 people based on a 10% estimated risk of long COVID following infection, see the “Long COVID” section later in this report) make such an outbreak utterly irresponsible for a public health authority.
We have a few suggestions for the CDC to prevent future outbreaks. The CDC’s emphasis on individual choice is insufficient to protect people. As highlighted in the People’s CDC External Review, “CDC guidance pushes individual choice over a population health approach to protect everyone.” The ineffective you-do-you approach appears to apply to both CDC’s hosted in-person events as well as public policy.
Based on the CDC’s survey of attendees, only 30% of attendees reported wearing a mask at the conference, despite presumed high levels of education and interest in public health among attendees. Universal masking policies are an important component of multilayered protections that are necessary for safe and inclusive in-person events.
Approximately 400 people attended the virtual format of the CDC EIS conference, avoiding the outbreak entirely. In addition to bypassing COVID risks, strong virtual options for conferences are important for accessibility for disabled folks as well as for those who can’t travel. Check out this article “Ten simple rules to host an inclusive conference” in PLOS Computational Biology for additional tips to build on lessons learned from the ongoing pandemic.
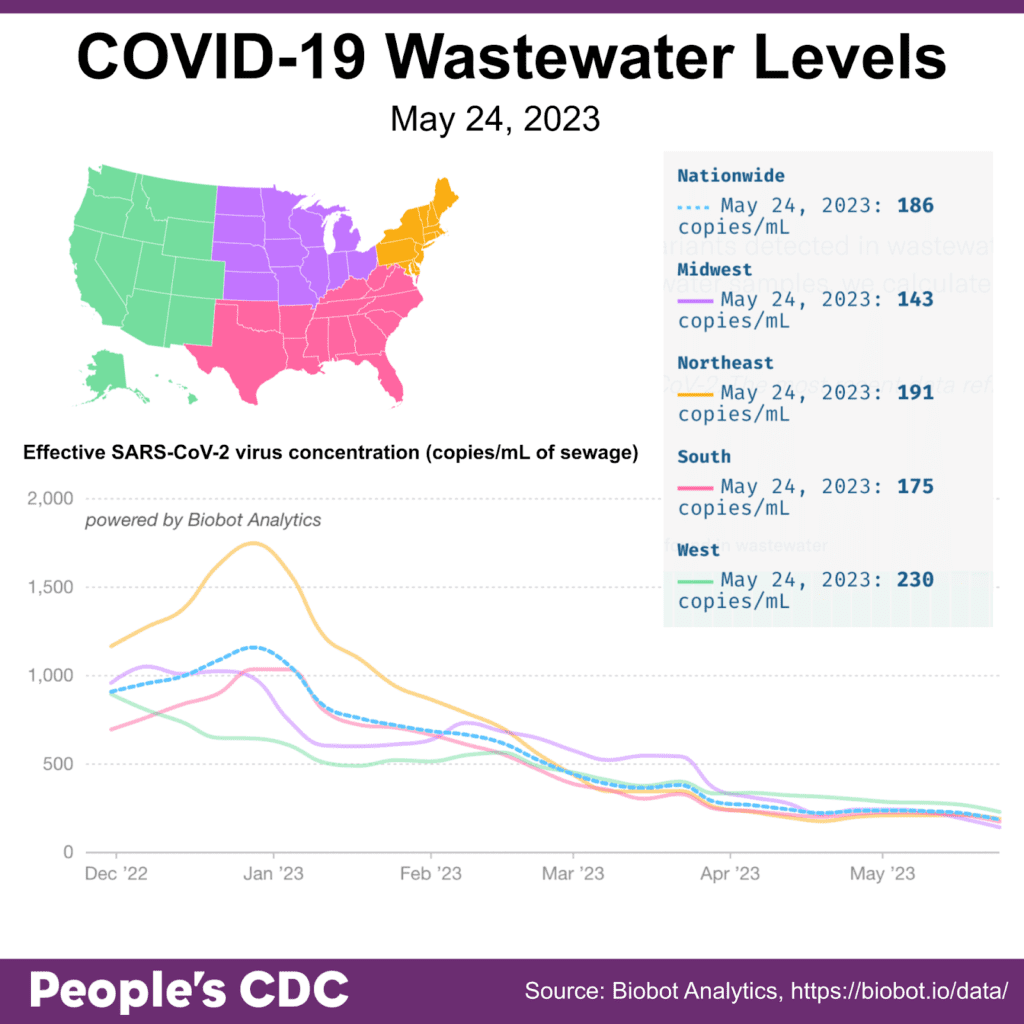
Wastewater Monitoring: Wastewater testing as reported by Biobot continues to show a leveling off to slight decrease, both nationally and regionally. The national average as of May 24 is 186 copies/mL, which remains about 4.6 times higher than the previous low point of 40 copies/mL on May 26, 2021.
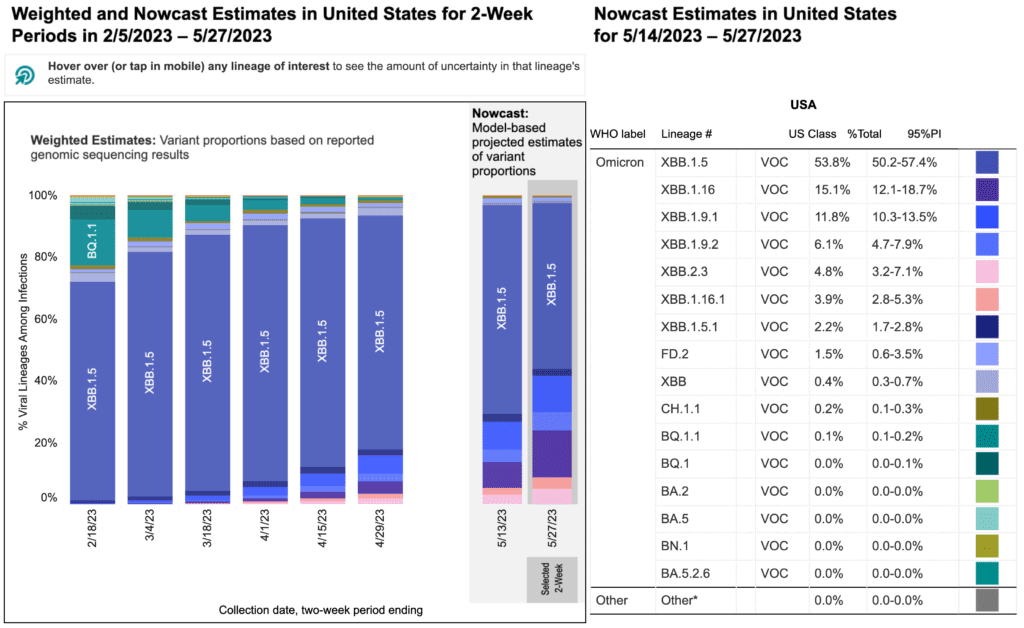
Variants: Variant data is now reported bi-weekly, and the data quality is likely impacted by reduced testing access and the end of the federal public health emergency. Kraken (XBB.1.5) continues to predominate, making up 53.8% of cases in the latest projection for May 27, down from 64% in the previous projection for May 13. Arcturus (XBB.1.16) continues to increase, now making up 15.1% in the latest two week projection.
Long COVID: This week, early results of the RECOVER long COVID study were published in JAMA. Long COVID is also known as post-acute sequelae of COVID (PASC). Unlike many previous studies that utilized existing data such as medical records, this large study gathered new data via surveys about symptoms every 3 months as well as clinic visits. This study shows an overall rate of long COVID of 10% at 6 months following Omicron-era infections, a finding that is within range of previous estimates of long COVID prevalence.
The following results are listed for patients who enrolled within 30 days of infection during the Omicron-era (denoted “acute Omicron” in the study); additional results can be found in the article. Long COVID was more frequent following reinfection–20% in reinfected patients as compared to 9.7% with a single infection. Vaccination reduced the risk of long COVID, with 17% of unvaccinated patients experiencing long COVID compared to only 9.7% of fully vaccinated patients.
The RECOVER study joins a growing body of evidence supporting two key conclusions: vaccination reduces (but does not eliminate) the risk of long COVID and repeated infections increase the risk of long-term consequences of infection. Sharing this information with people and communities who may be interested in reducing their risk of infection can be an effective way to support incorporating multilayered COVID precautions.
It is important to note that the RECOVER study represents a significant yet early effort to characterize long COVID–there are several proposed mechanisms of long COVID that may contribute to the disease, and there is not yet an objective laboratory test for long COVID. We thank all of the participants in long COVID studies for their contributions to our understanding of this disease.
Forecast: Amid the backdrop of ongoing COVID threats, loss of federal funding for many pandemic resources, and widespread loss of universal masking protections in healthcare, we recognize that threats to public health are inextricably tied to injustices across marginalized communities in the forms of anti-trans legislation, ableism, and systemic racism, just to name a few. For further reading, check out this blog post from the Disability Visibility Project featuring perspectives from disability justice organizers.
Take Action: Our featured actions this week continue our focus on COVID risks in healthcare settings. Sign on to National Nurses United’s letter to urge the CDC and the Healthcare Infection Control Practices Advisory Committee (HICPAC) to recognize airborne COVID transmission and institute appropriate airborne control measures, including respiratory protection with N95 respirators and improved ventilation.
Join us in supporting masking in healthcare and reporting requirements for healthcare-acquired COVID infections by submitting public comment to the Centers for Medicare & Medicaid Services (CMS), the branch of the Department of Health and Human Services that administers Medicare, oversees Medicaid, and establishes many standards within healthcare. The deadline to submit your public comment is June 9.
After you’ve submitted your comment to CMS, also send a letter to your senators encouraging them to support universal masking in healthcare and reporting of healthcare-acquired COVID infections.
Thank you for all that you do to protect yourself and your community. 😷
Notes: 1) The numbers in this report were current as of 5/27/2023. 2) Changes in testing access as well as data reporting have led many federal data sources to become less reliable. Fewer federal data sources may be included in current and upcoming Weather Reports, and we will do our best to provide context regarding the representativeness of limited data. 3) Check out the links throughout & see our website for more! https://bej.gbh.mybluehost.me