
Public Health Critique on Vaccine Recommendations:
The CDC’s vaccine recommendation committee, the Advisory Committee on Immunization Practices (ACIP), met June 21-23. Many community members submitted public comments to support access to COVID boosters at least every six months, as well as updated boosters for all ages including children. Thank you to all who submitted a comment!
While there is much to critique from the CDC’s ACIP meeting, we will summarize a few highlights. Long COVID was neglected in the discussions of COVID’s impact, which centered on COVID hospitalizations. This is a significant misstep, as we know that vaccination reduces the risk of Long COVID by approximately 30% to 50%.
The CDC committee’s vaccine work group supported a potential single-dose annual primary vaccination strategy for children aged 2 and older, while keeping the multidose primary series approach for kids aged 6 months to 2 years due to increased hospitalizations in the younger age group. A once-a-year vaccination strategy is likely not adequately protective at any age due to waning immunity in the months following vaccination.
Wastewater Testing:
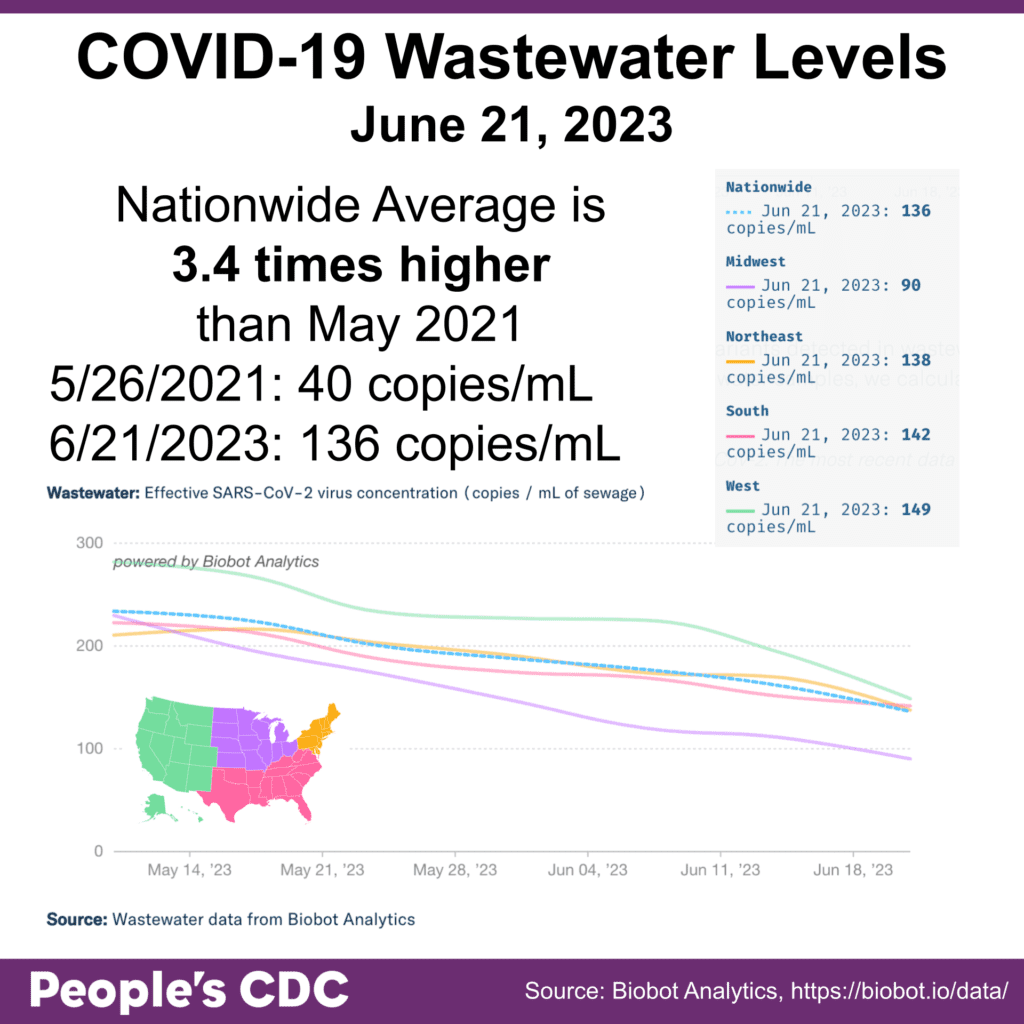
This week, Biobot shows a plateau in the South and slight decreases across other regions, including a slight decrease nationally. This is not a reason for complacency, though. Nationwide wastewater levels remain about 3.4 times higher than the previous low point in May 2021 (40 copies/mL May 26, 2021 and 136 copies/mL June 21, 2023).
Deaths:
You may have noticed that we haven’t been including data on COVID deaths recently. With the end of the federal Public Health Emergency on May 11, 2023, there was a significant change in death reporting which caused an artificial decrease in death counts. We already know that COVID deaths are relatively undercounted, but this change was particularly misleading.
Since the end of the Public Health Emergency, CDC is now reporting deaths in two ways. First, on the CDC’s main data tracker, COVID deaths are reported as a percentage of total deaths. A percentage is particularly difficult to interpret, as total deaths in the US (pre-pandemic) were known to vary seasonally.
Next, we have CDC’s provisional death counts for COVID. This tracker is based on death certificate data, which depends on a suspicion for COVID infection before death or on autopsy. Given continued rollbacks in testing access, it is likely that COVID deaths are undercounted by an even wider margin than in the past.
Without well-established diagnostic criteria or objective laboratory testing for Long COVID, deaths from long-term consequences of previous COVID infections are likely also not adequately captured, despite CDC’s addition of Long COVID guidance in death certificate reporting.
All current COVID data, including deaths, are clouded by “survivorship bias.” Survivorship bias can cause us to overlook the fact that there have been changes in characteristics of the population over time due to deaths of groups of people earlier on. Unfortunately, far too many people died earlier in the pandemic, including those who were high risk and immunocompromised, and are no longer part of the susceptible population.
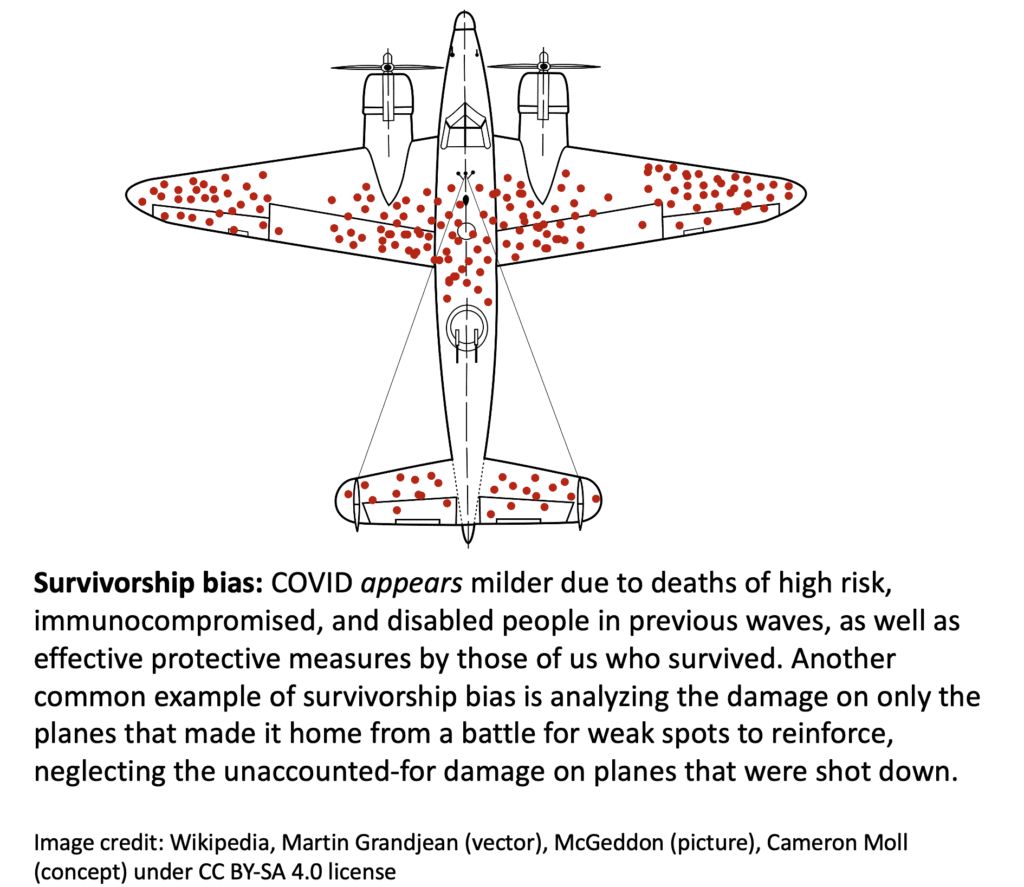
Misleading claims that COVID is now “mild” and deaths are “rare” point to analyses that ignore the fact that many people died in earlier waves, and many of the rest of us have drastically changed our lives to add layers of protection and avoid exposure. In this context, even “low” levels of continued preventable deaths due to COVID signify ineffective public health responses rather than inherent properties of viral variants.
Variants:
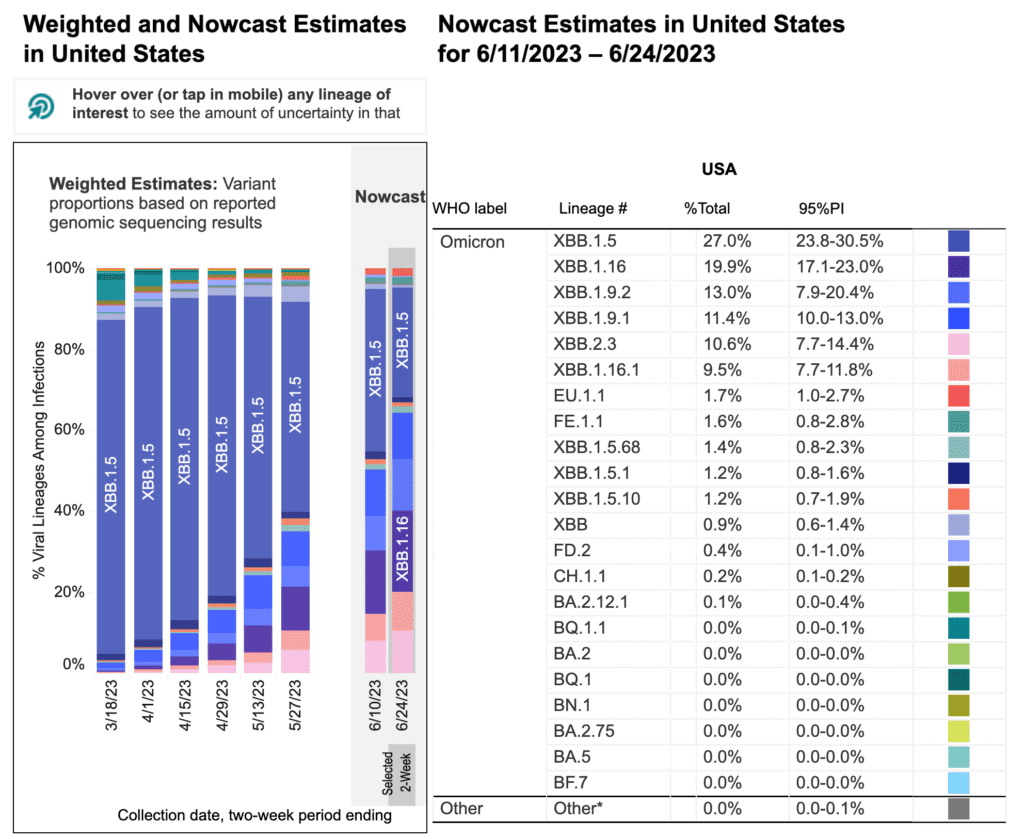
Kraken (XBB.1.5) continues to decline at 27% in the current projection, as Arcturus (XBB.1.16) increases to 19.9%. Further down the list, lineages EU.1.1 and FE.1.1 are also XBB descendants. We are also keeping an eye out for another XBB descendant FU.1, which isn’t delineated on the CDC’s variant tracking yet but can be found on the US COVID-19 Variant Dashboard by Raj Rajnarayanan.
Long COVID:
The book “The Long Covid Survival Guide” by Fiona Lowenstein won an award in the Foreword Reviews Indies Book of the Year Awards. If you aren’t familiar with Long COVID, you can check out this interview with the author, available in audio or transcript formats. Consider requesting this book at your local library (print, eBook, or audio format) or donating a copy.
Wins:
We would like to highlight an excellent op-ed supporting continued COVID protections in healthcare, written by Kevin Kavanagh, a retired physician and patient advocate. Kavanagh lays out a multilayered approach to infection control including vaccination, universal masking, and preadmission testing. Sobering data on Long COVID impacts in the healthcare workforce are presented. Notably, headlines are often written by editors–COVID levels are not as low as the mainstream narratives would have us believe (see “Wastewater Testing” above).
Take Action:
Use our letter template to demand free PCR testing and better data tracking from Congress and the CDC. The loss of testing resources and data reporting affects decisions on every level, from personal to national. There can be no informed consent without accurate information. Let’s bring better quality data back.
As we mark the official start of summer, we hope you are staying safe and healthy. By wearing a mask and protecting yourself and others from COVID, you are showing more leadership than most of our elected leaders and public health authorities. Thank you. 😷
Notes: 1) The numbers in this report were current as of 6/24/2023. 2) Changes in testing access as well as data reporting have led many federal data sources to become less reliable. Fewer federal data sources may be included in current and upcoming Weather Reports, and we will do our best to provide context regarding the representativeness of limited data. 3) Check out the links throughout & see our website for more! https://bej.gbh.mybluehost.me