
The Weather
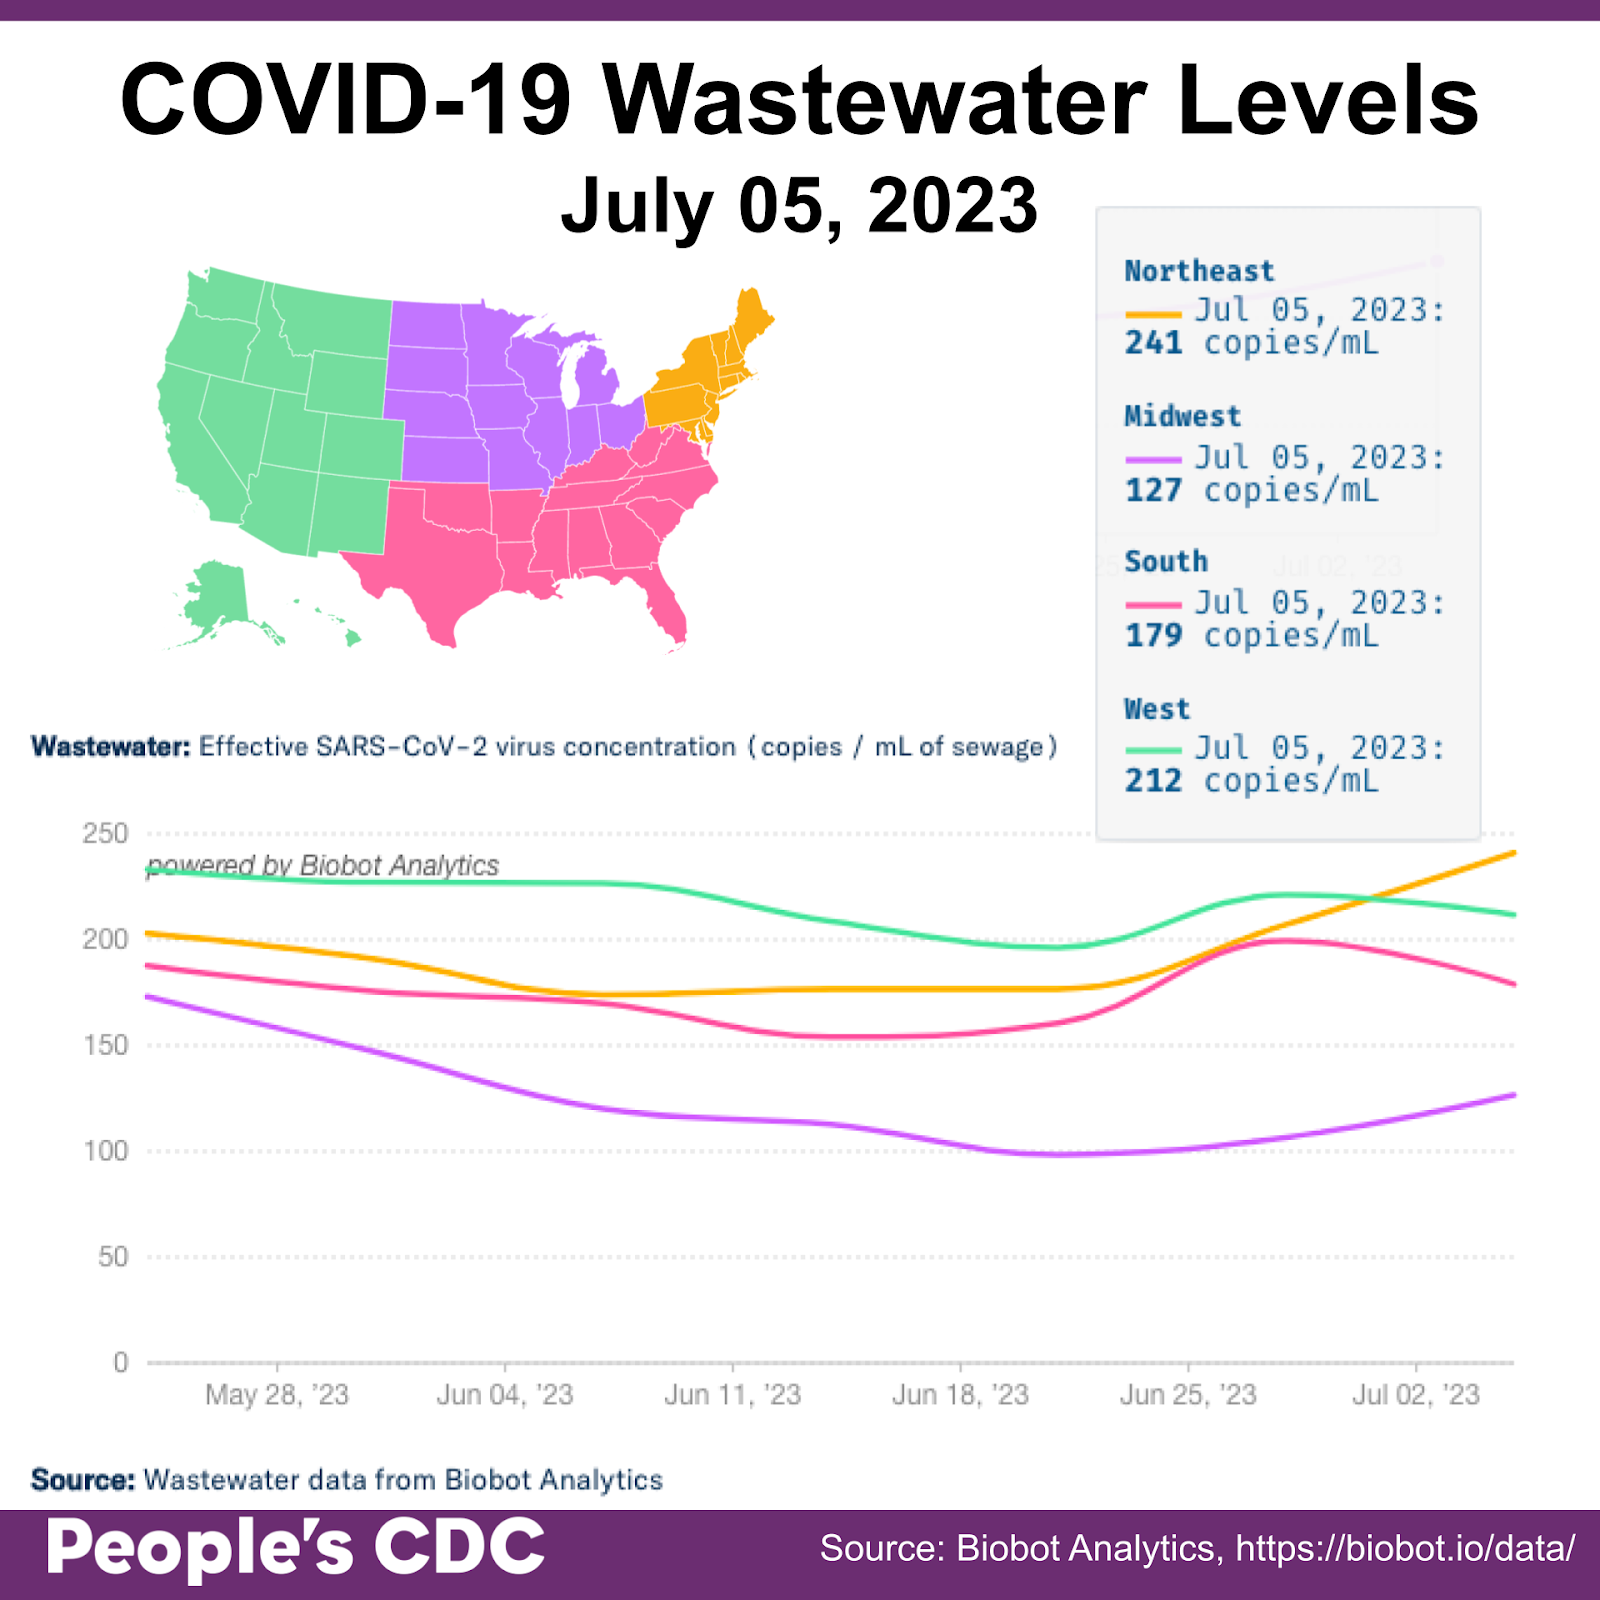
Wastewater levels are increasing in the Northeast and Midwest and are relatively stable elsewhere.
Looking at wastewater in specific locations highlights the value of checking into your local wastewater data. For example, Alleghany County, VA, and Lafayette County, MS, are experiencing rapid increases in levels. Juneau, AK, and Kauai County, HI, have been persistently higher than national average throughout most of the year.
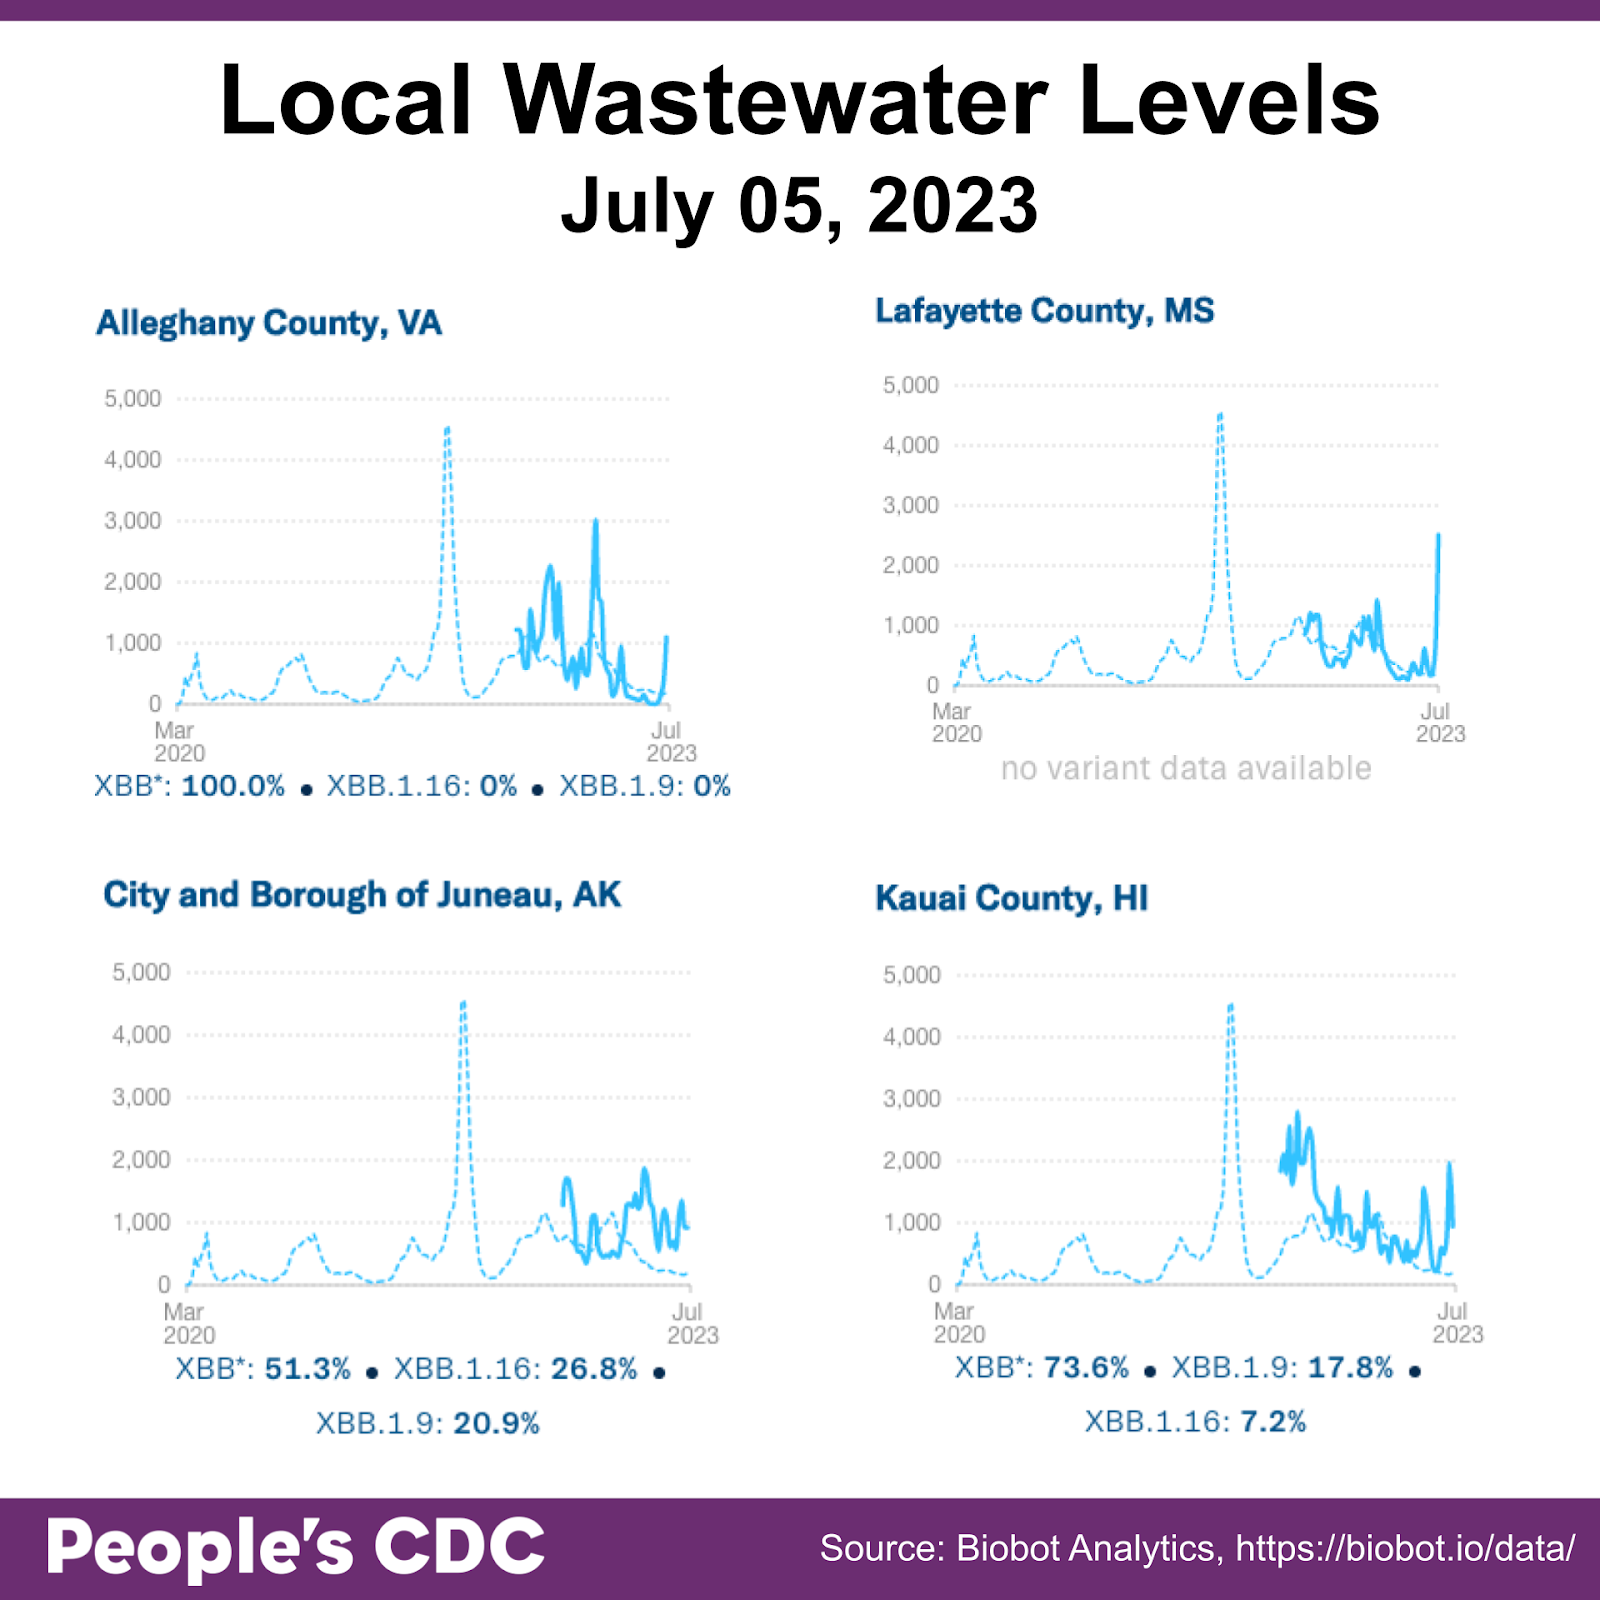
You may be able to find your local wastewater data through biobot or The WastewaterSCAN Dashboard.
Wins:
Readercon will hold a conference this week in Boston requiring vaccination and high-quality masking. We want to celebrate organizers for recognizing that the pandemic is not over. It is still possible to implement universal masking policies for large gatherings, and more organizations should do it! Our safer gatherings guide is a helpful resource for creating policies.
Since the end of the Public Health Emergency, we have sent over 16,000 letters demanding free PCRs and made hundreds of calls through our phone banking session. During that time, rather quietly, HHS and Walgreens rolled out a program at 1000 sites to provide people with no-cost PCR testing. Visit www.walgreens.com/PCRpickup to see this program. This shows that under public pressure, HHS is capable of making PCR testing free – and they must create more accessible options for #FreeFastPCR for all.
We want to recognize that this win is *obviously* insufficient, inaccessible and confusing. When did it actually start? Why is it not being promoted? Both the HHS and CDC websites give mixed information about the availability of free testing and ultimately navigate you to an error message. Let’s keep up the collective pressure on our public health agencies. Call your Governor and state departments of public health and tell them to bring back free PCR testing. And send an email to the CDC’s ICATT program directly: ICATTProgram@cdc.gov
This Week’s Critique:
In this post-data period of guessing about levels of transmission, hospitalization, and death, the CDC released a report characterizing patterns of reinfection from a different era: September 2021 to December 2022. They noted that reinfections were increasing during that period, represented an estimated 12% of all infections, and were most common among those aged 18-49. They highlighted that reinfections were expected to increase as first-infections increased and as the virus mutated to escape immunity. They neglected to note the impact of the administration’s failure to do basic public health education and mitigation. They also did not comment on their inability to do work like this going forward as a result of their ending meaningful surveillance.
A note on framing: Policymakers often use one of two (overlapping) strategies to justify the repeal of COVID mitigation measures and the withdraw of the previously expanded social safety net:
- They ignore the well-documented harms of Long COVID.
As you read this report from the CDC above, we suggest you turn a critical eye to the framing of COVID as an acute disease only. When they mention “severe outcomes,” they are not referring to those attributable to Long COVID. Studies continue to come out showing that this approach is short-sighted and wrong.
Just last week, JAMA published a systematic review and meta-analysis showing that the pandemic has also brought higher levels of diabetes in children and adolescents, a finding already well established in adults.
We know that Long COVID can damage every organ in the body. It’s been shown to increase rates of stroke, heart attack, diabetes, dementia, infertility, and a whole host of other problems.
Last month, the CDC itself hosted a presentation recognizing that 18% of those with Long COVID have not returned to work, contributing to a labor shortage. And, recently released U.S. Bureau of Labor Statistics data shows that there are millions more disabled people now compared to pre-pandemic. All of this shows the urgent need for a system that values our intrinsic worth as people, our ability to care for one another and our environment.

- They argue that newer variants are less harmful than the older strains.
Our last Weather Report explained why survivorship bias influences this perspective, and we suggest you check that out if you’re starting to believe the “it’s just a cold” hype.
This week, the Journal of Infectious Diseases published a study that used all case data collected in Hong Kong throughout 6 waves to calculate the intrinsic severity (how severe the effects of the strains would be if they were to infect the same exact people at the same exact time) and effect severity (what we see the effects are in the real-world – based on vaccination status, who the virus is infecting, previous infections, etc). It concluded, “Omicron has comparable intrinsic severity to the ancestral Wuhan strain, although the effective severity is substantially lower in Omicron cases due to vaccination.”
In other words, COVID is still harmful, and we should all do what we can to avoid getting and spreading it to others – and that includes continuing to demand more from policymakers.
On Long COVID
Some new research found increased herpes virus (including HSV-1 and EBV, the virus that causes mono) reactivation in Myalgic Encephalomyelitis / Chronic Fatigue syndrome (ME/CFS) and Long COVID. It also suggests some biomarkers that may provide insight into the mechanism by which SARS-CoV-2 is causing Long Covid.
Forecast:
In bad (but unsurprising) news, California Court rules that workers cannot sue their employers for COVID spread to households. In its decision, the court said that a victory for the worker and his wife would mean “dire financial consequences for employers.”
Read this thread from Pantéa Javidan, JD, PhD to better understand why HIV and SARS-CoV-2 are treated so differently by the courts.
Take Action:
If you haven’t yet, please sign this letter from National Nurses United to Urge the CDC and HICPAC to Fully Recognize Aerosol Transmission and Protect Health Care Workers and Patients. The next CDC HICPAC meeting is August 22, and registration will open sometime in July.
Long COVID Justice created a Direct Action Toolkit that we’re all really excited about! Check it out here!
A few more must-reads this week:
Tithi Bhattacharya, a leading scholar of Social Reproduction Theory, authored a personal reflection on the pandemic in Truthout. In the end, she says, “COVID has yielded the most stunningly pervasive gaslighting phenomenon in recent history. Willing and eager governments worldwide are abandoning citizens to a debilitating disease by one simple trick: saying it no longer exists.”
Sam Friedman, a research professor and People’s CDC volunteer, scribed a review of The COVID Crisis Group’s Lessons from the COVID War: An Investigative Report. In the review, he puts forth solutions that go beyond those offered in the book. What is needed, he says, is “for workers to organize their power and their collective willingness and ability to strike effectively regardless of what the law says and even regardless of what union leaders say”; and “for neighborhoods and larger communities of poor people, racially or otherwise oppressed people, and working people to develop organizations of mutual solidarity and aid, and a willingness and ability to take direct action to defend themselves and to meet their needs regardless of what employers or governments say.”
Let’s keep ourselves and each other safe this week.
The pandemic isn’t over.
Notes: 1) The numbers in this report were current as of 7/8/2023. 2) Changes in testing access as well as data reporting have led many federal data sources to become less reliable. Fewer federal data sources may be included in current and upcoming Weather Reports, and we will do our best to provide context regarding the representativeness of limited data. 3) Check out the links throughout & see our website for more! https://bej.gbh.mybluehost.me