
We want to start with a programming note: because of the US Labor Day holiday on September 4, 2023, we will not be publishing a Weather Report next week. We will return to regularly scheduled COVID Weather Reports on September 11, 2023. We urge everyone to take care organizing Labor Day gatherings this year. All indications are that we are currently experiencing a COVID surge. This makes COVID precautions during in-person gatherings all the more important. Please see our safer in-person gatherings guidelines for tips on COVID safety.
The Weather
Wastewater levels continue to rise in most of the country. In keeping with the procedure we debuted on August 9th, we will report on wastewater from the previous week, August 16th, treating the August 23rd data as subject to change. We made this change in how we present the Biobot data after noticing that post hoc adjustments Biobot makes to its data can change the appearance of wastewater trends significantly (for example, from upward to downward trends and vice versa). Differences can also be caused by changes in wastewater site reporting practices, or from errors in the mathematical models used to create the reported value.
Using August 16th data, all regions show an increase since July 19, continuing an overall increasing trend since mid-June. The Midwest region appears to now be showing a downward trend in wastewater data, though this is subject to change as Biobot updates its data.
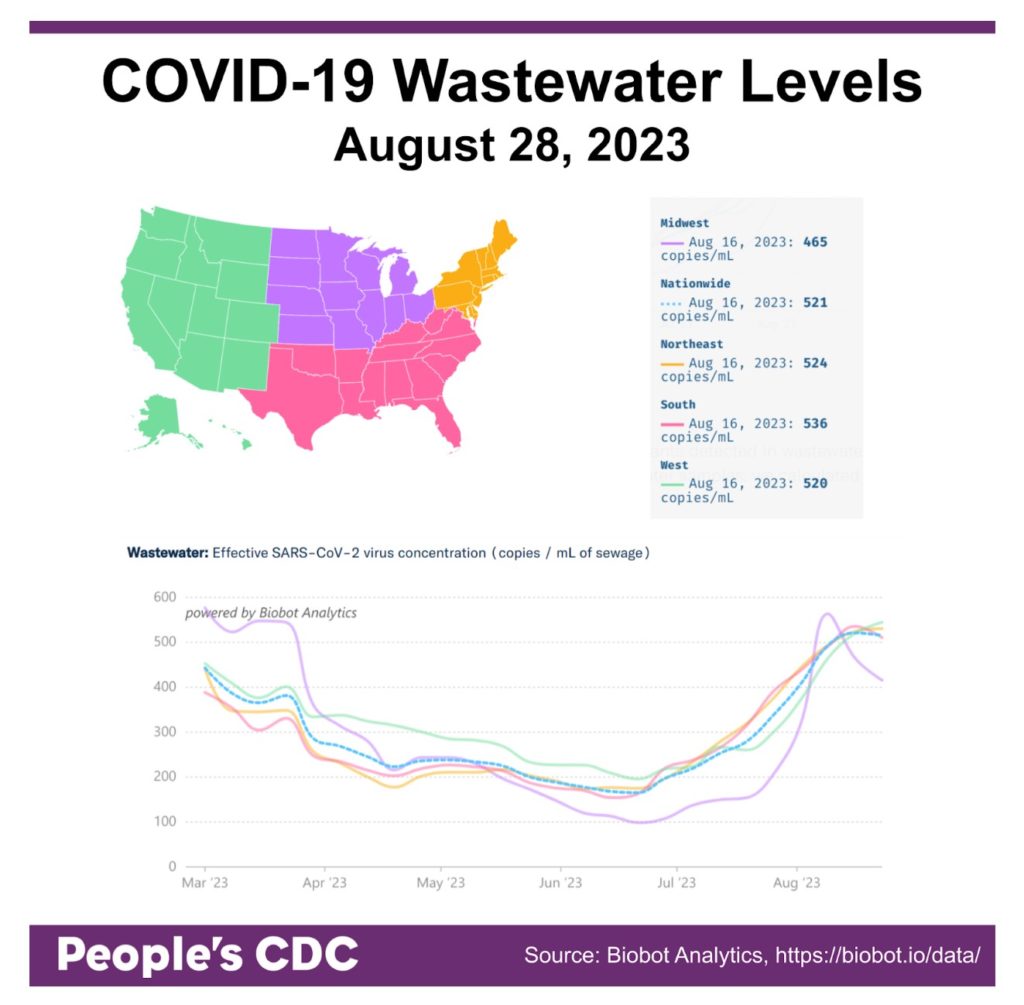
As always, remember that local wastewater levels, if they are available to you, will give you a much better sense of what’s happening where you are than the national data.
You can look for your local wastewater information at Biobot Analytics, The Wastewater SCAN Dashboard, or CDC’s National Wastewater Surveillance System. You can also contact your local representatives requesting the data be collected, if you do not see it for your local community.
Hospitalizations:
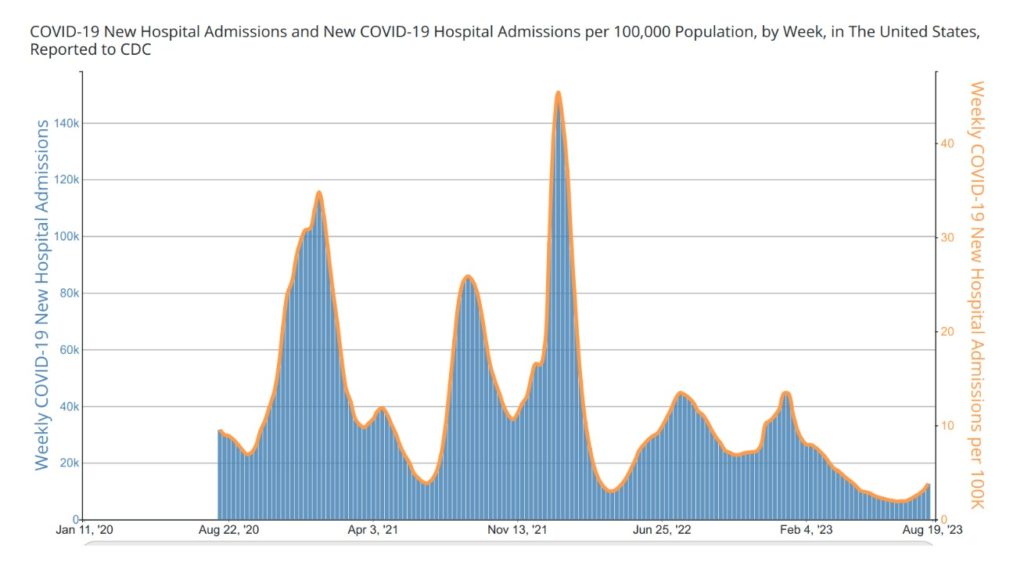
Nationally, COVID hospitalizations continue to increase. According to CDC data, 12,613 people were hospitalized nationwide due to COVID last week. This is an almost a 22% increase over the previous week.
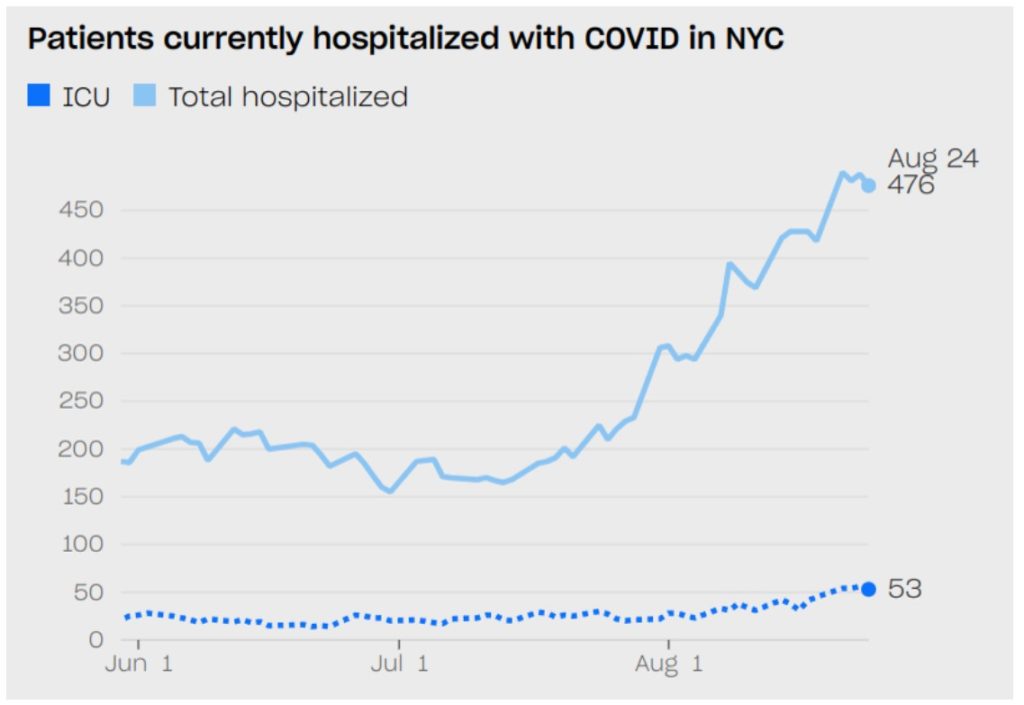
Again, it’s important to check out what’s happening locally to better understand your individual and communal risk. In New York, for example, where The City continues to report on the local COVID situation, we see continued (though possibly slowing) increases in COVID hospitalizations.
Variants:
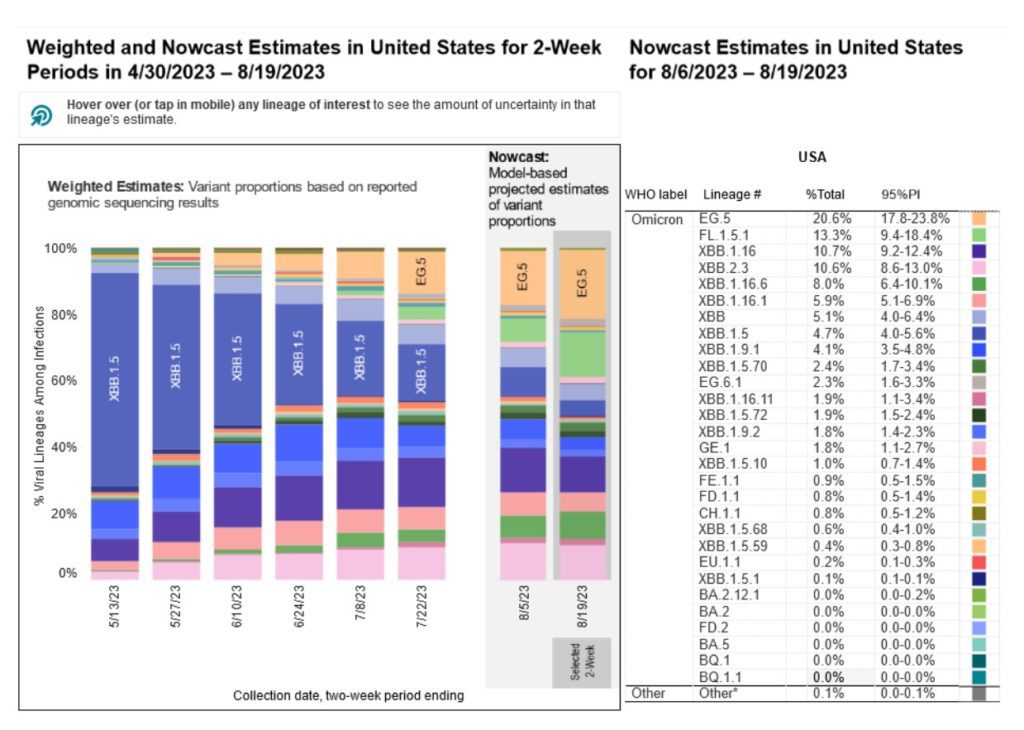
The current variant landscape remains a mix of nearly equally dominant strains since the last variant update we gave on August 7th (CDC now updates every 2 weeks). In the most recent Nowcast estimates, EG.5, “Eris,” a descendant of XBB, remains the dominant strain at 20.6% while FL.1.5.1 “Fornax” has risen from fifth at 8.6% to the second most dominant strain at 13.3%. XBB.1.16 has dropped to third, representing 10.7% of infections. Due to local health departments being no longer obligated to share data as a result of the end of the public health emergency, the CDC has limited its regional-level reporting of variant proportions through its Nowcast estimates, currently available for only three out of ten regions.
There is a new COVID variant of interest being tracked by the WHO and CDC, which does not yet appear on the variant tracker. The new variant, designated BA.2.86 and commonly called Pirola, has >35 mutations on the spike protein compared to XBB.1.5currently circulating variants. That’s as big of a difference as there was between the original virus and the Omicron variant identified in November 2022.
Notably, although the fall boosters from Moderna, Pfizer, and Novavax are based on the Omicron XBB.1.5 lineage more similar to other XBB derived subvariants such as Eris (EG.5), these new boosters are still Omicron BA.2-based, as XBB is a recombinant subvariant derived from two BA.2 subvariants. The updated XBB-based boosters will be a much better match to current variants than previously available vaccines. It will be important for those who are eligible to get the updated boosters when available to reduce the risk of severe outcomes in the context of waning immunity. It is unclear yet whether Pirola’s appearance will lead to an outbreak as severe as the one Omicron precipitated.
Wins:
On August 22, the CDC’s Healthcare Infection Control Practices Advisory Committee (HICPAC) met to discuss isolation precautions relevant to COVID and other airborne infectious diseases. Although public comment was severely time limited, it included powerful testimony from members of the public, patients, healthcare workers, public health professionals, and others, all in support of improving and broadening airborne precautions (public comment begins at time 1:40:26 on the YouTube video. Stay tuned for further updates as we prepare for the next meeting in November, when the CDC’s new infection control guidelines will go to a vote.
As it becomes more and more clear we are in a COVID surge, more and more organizations, including and especially health care facilities, are bringing back masking.
- Several health systems in New York and California including Kaiser Permanente for its Santa Rosa area facilities as well as UMass Memorial Medical Center in Massachusetts reinstates COVID-19 mask mandate amid spike in cases among employees and patients.
- Morris Brown College in Atlanta has also reinstated a mask mandate on its campus
GeekGirlCon 2023, which celebrates and honors the legacies of under-represented groups in science, technology, comics, arts, literature, game play, and game design, has good COVID policies that employs layers of protection, including proof of vaccination, masking, and additional suggested actions to take to minimize everyone’s risk. GGC’23 runs October 7 and 8, 2023.
In a big win for public health in NYC, COVID Advocacy NY (formerly Mask Mandate NY) announced that free KN95 masks were added to NYC’s public health vending machines along with other important harm reduction supplies. Pressure works!
Last but not least, Care Not COVID MA advocates in Massachusetts showed up to protest Ashish Jha as he spoke at Boston University’s School of Public Health last week. Don’t let Jha do his work to obscure the realities of COVID: let him know we won’t forget!
Long COVID:
A new study in Nature Medicine shows Long COVID symptoms linger even after two years. From the study: “People who endured even mild cases of COVID-19 are at heightened risk two years later for lung problems, fatigue, diabetes and certain other health problems typical of long covid, according to a new study that casts fresh light on the virus’s true toll.” The Washington Post has also covered this study. It is yet another confirmation that repeat COVID infection–and the associated risk of Long COVID–should be avoided whenever possible. We also know that many people, especially early in the COVID pandemic, were not diagnosed with COVID but developed Long COVID; these folks deserve access to treatment and care.
Forecast:
Leaders in public health and medicine published an opinion piece in the Annals of Internal Medicine arguing for universal masking as the new standard in healthcare.
Treatment:
We continue to recommend that you seek treatment after testing positive for COVID. Paxlovid as well as Lagevrio (molnupiravir) are both options that may help treat this infection. You can get access to treatment and find places for access through the “Test to Treat” program. Here is a helpful Twitter thread on how to obtain Paxlovid and if you do not have Twitter, an alternative link. You can find testing locations through the CDC’s no-cost testing search tool or HHS’s tool for finding community-based testing sites.
Take Action:
As COVID rates continue to increase, and as we’re seeing some hospitals make the change to reinstate making, you can call your local hospitals and healthcare systems to demand masking be reinstated in healthcare settings. We previously provided resources with some additional language.
Despite impactful public comment supporting improved healthcare protections at CDC’s August 22nd HICPAC meeting, we are skeptical about whether this group will heed those comments and improve infection control practices for airborne infectious diseases rather than weakening them. Although public comment has now closed, we can still let Congress know that this committee needs additional oversight to ensure that healthcare system profits are not prioritized over the health and safety of patients and workers.
Wastewater monitoring data is critical at many levels for the understanding of COVID risk. Wastewater data collection needs to be funded at all levels. Write to your local state and federal representatives and demand that they support funding this important infrastructure
If you don’t have local wastewater data, call or write your representatives and tell them you want it! According to Dr. Marc Johnson (PhD in molecular biology and immunology), “if you let them know that this is important, then usually they’re perfectly happy to keep doing it.”
Notes: 1) The numbers in this report were current as of 8/26/2023. 2) Changes in testing access as well as data reporting have led many federal data sources to become less reliable. 3) Check out the links throughout & see our website for more! https://bej.gbh.mybluehost.me