
The Weather:
Amid rising COVID wastewater levels and hospitalizations, First Lady Jill Biden tested positive for COVID on September 4. Despite his exposure to the First Lady over the Labor Day weekend, Joe Biden has waffled on masking, first saying he would mask around others, then unmasking in close proximity to an 81-year-old Vietnam veteran during an indoor ceremony bestowing the Medal of Honor, flouting even the minimal CDC quarantine guidance. We wish the president would use his bully pulpit to support public health rather than undermine it.
Wins:
Socialism 2023, recognizing the multidimensional harms of COVID-19, used layers of protection to protect conference goers. From their site, “We aim to make the Socialism Conference accessible to anyone looking to share organizing lessons, learn from radical history, and build community, and—to the maximum extent possible—to ensure that no one leaves the conference having contracted Covid or another illness and suffering the resulting health and economic consequences.”
Amid the current surge in New York state, the state is making tests and masks available to school districts and BOCES (Boards of Cooperative Educational Services) by request. It’s not clear how this will impact access at schools just yet.
University of Michigan grad students won a historic victory last month which included health and safety protections for workers including that Graduate Student Instructors may request students wear masks and may request to teach remotely due to health and safety concerns. Check out this summary of their wins.
Wastewater:
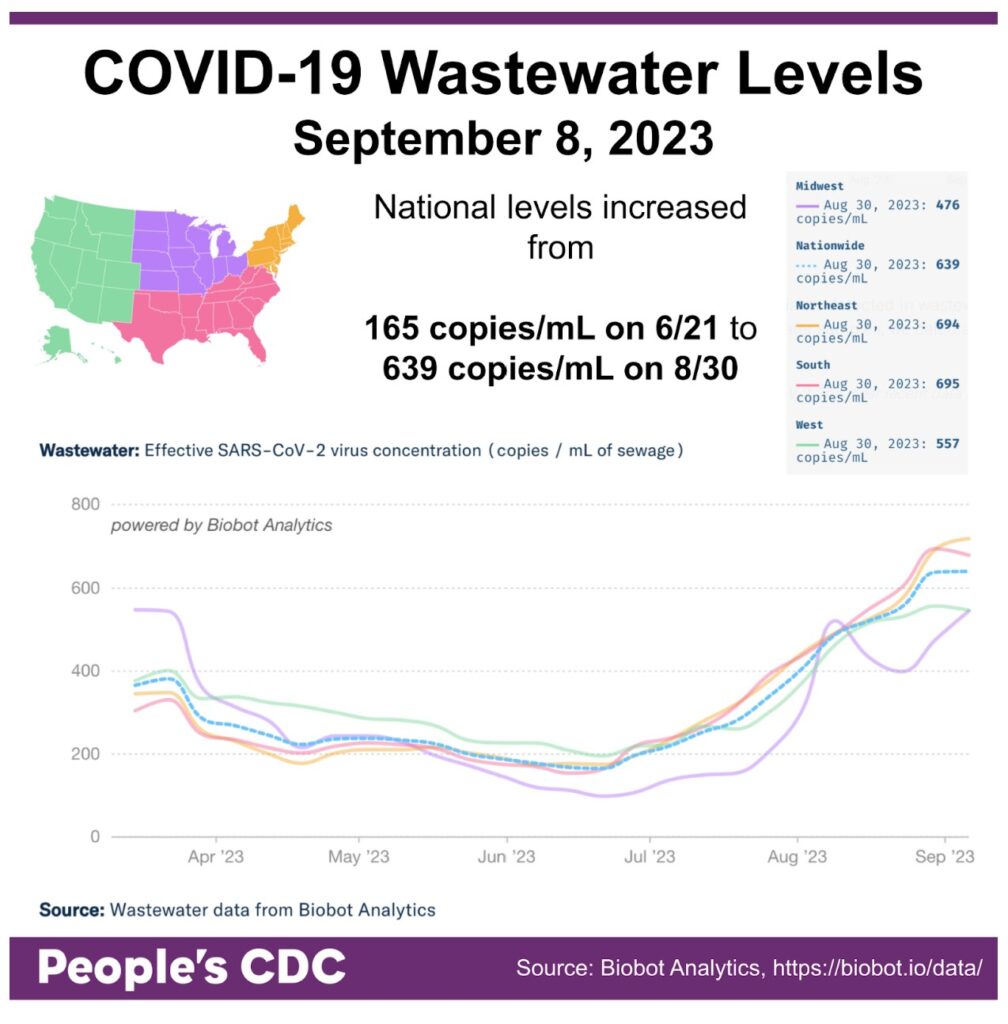
Wastewater levels continue the multiweek increasing trend across all regions, with the national average almost four times the level back in June (August 30: 639 copies/mL vs. June 21: 165 copies/mL). Notably, Biobot data has shown data updates over time in more than just the most recent week’s data, likely due to variation in the timing of reporting across wastewater sites, so be sure to check the website directly for the most up-to-date information.
Variants:
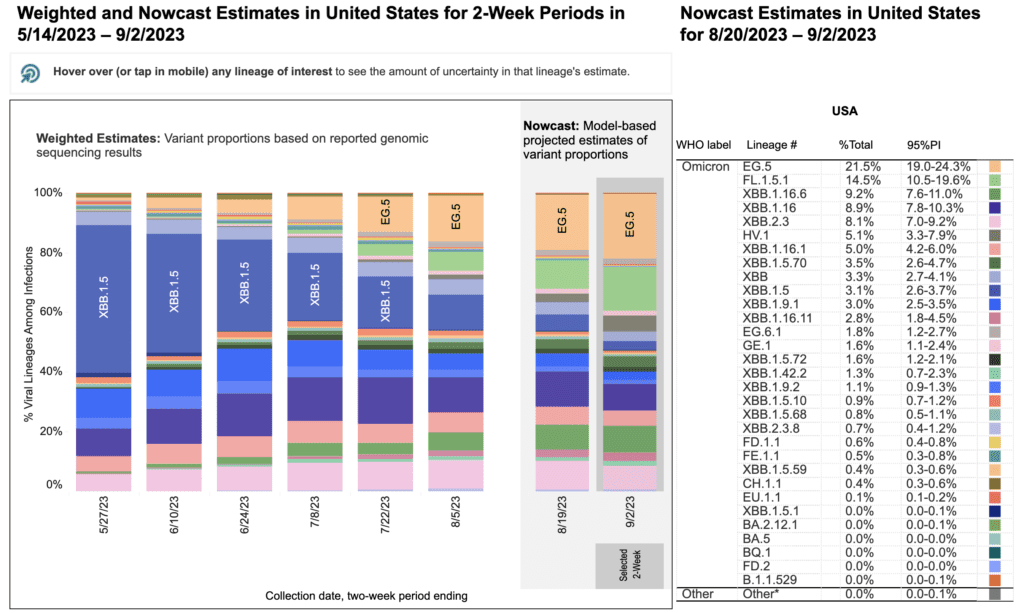
EG.5 (Eris) is the most common variant, making up 21.5% of the most recent Nowcast estimates. FL.1.5.1, another XBB-based variant, is in second place at 14.5%. The other remaining variants are predominantly XBB-based as well. Notably, BA.2.86 (Pirola) is not yet represented. An update on BA.2.86 was published by the CDC on August 30, noting that the variant had been identified in 4 states via individual testing or wastewater. Although reports may speculate about the severity of the new variant, it is clear that all COVID variants warrant multilayered precautions. See “Vaccines” below for information on BA.2.86 and the updated vaccines.
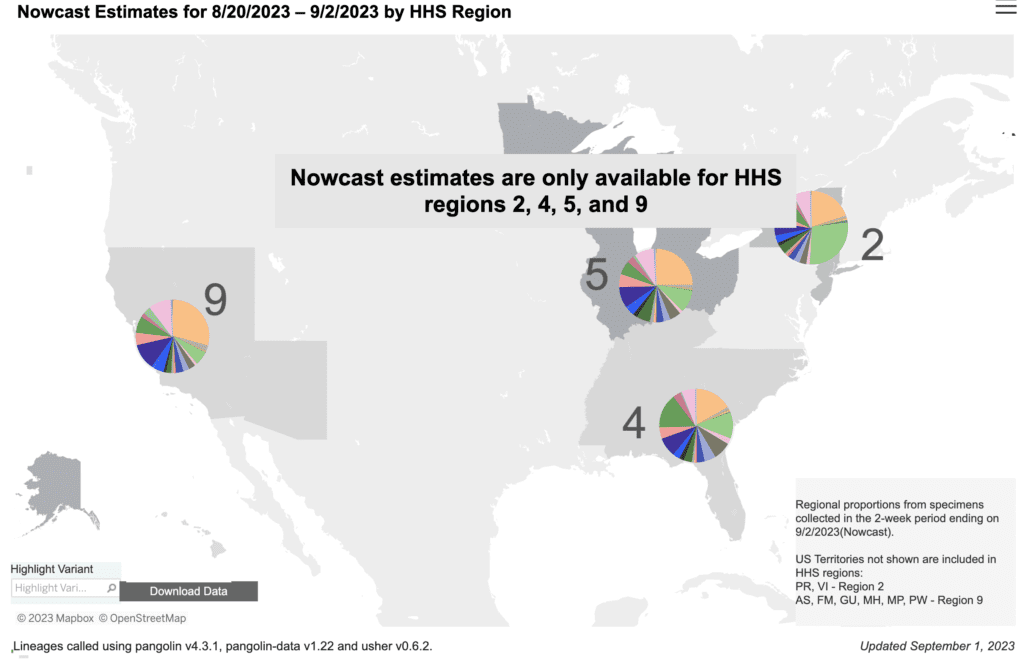
Regional variant reporting is now only available for 4 out of 10 HHS regions (regions 2, 4, 5, and 9), presumably because of the reduction in PCR testing, which provides the necessary samples for sequencing, and loss of other federal resources. The CDC’s explanation of variant sequencing plans following the end of the public health emergency noted, “As fewer specimens and sequences become available, a system that is scaled sufficiently to allow for regional estimates will be established in collaboration with the network of public health laboratories that have participated in the National SARS-CoV-2 Strain Surveillance program.” We hope that this effort is forthcoming. Regardless, you can support access to PCR testing and data reporting via our Action Network letter campaign.
Vaccines:
Moderna released early results from a clinical trial showing that their updated vaccine generates a strong immune response against BA.2.86. We hope that the CDC’s ACIP, scheduled to meet on Tuesday 9/12, will vote to make the updated vaccines from Pfizer, Moderna, and Novavax available for all ages, and we encourage everyone to get the updated vaccines when they come out.
Take Action:
Americans, including people under 75, need access to vaccine boosters more than once a year. For those that missed the comment period for the ACIP meeting, it’s not too late to make your voice heard. You can use this action network template, created by Chloe Humbert, to write to The White House to demand data-driven and ethical access to vaccines.
Republican Senator J.D. Vance of Ohio intends to introduce S. 2738, a bill he’s calling the “Freedom to Breathe Act” in order to ban mask mandates in schools and on airplanes. He intends to push for a vote on it as early as Thursday September 14th. Call your Congressperson and tell them that you support COVID mitigation measures. Reach the US Capitol switchboard at (202) 224-3121. h/t @COVID_Advocacy
Notes: 1) The numbers in this report were current as of 9/8/2023. 2) Changes in testing access as well as data reporting have led many federal data sources to become less reliable. 3) Check out the links throughout & see our website for more! https://bej.gbh.mybluehost.me