
The Weather
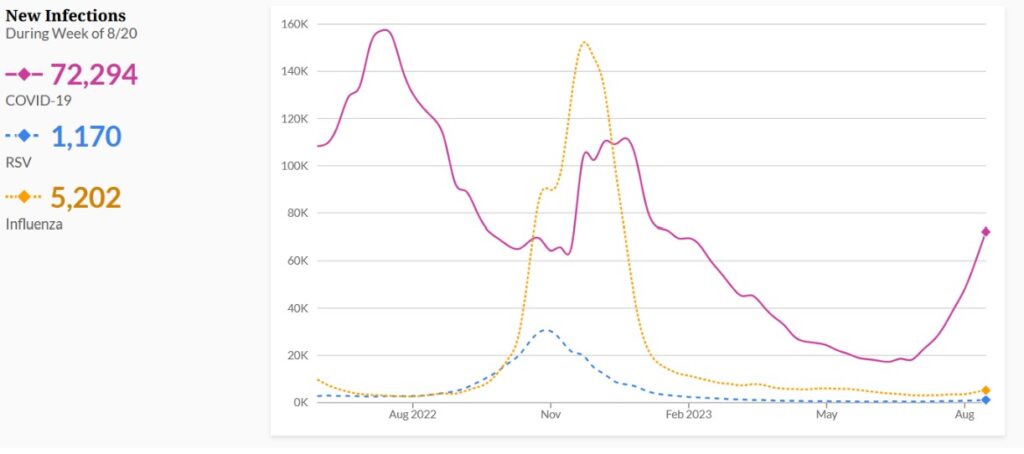
The truth cannot be obscured forever–it has a funny way of revealing itself eventually, even when there are growing efforts to suppress it. For example, Epic Research has been publishing data on COVID infections, positivity rate, emergency department visits, and hospitalizations from June 2022 to August 20, 2023, showing sharp increases in all four stats since June of this year. This data further cements that we have indeed been in a COVID surge this past summer–and we still are.
Policymakers’ failure to protect our rights to live healthy lives means further caution is needed in hospitals. A recent study has found that during the first three years of the pandemic (2020-2022) that at least 4.4% of cases came from hospital-acquired infections (HAIs). It also found that every 10% increase in local transmission corresponded to a 178% increase in HAIs. In other words, lots of community spread leads to lots and lots of spread within hospitals: an alarming finding given that the current surge is happening without mask mandates in hospitals.
Yet the CDC may further weaken protections for healthcare workers and patients: their draft guidance indicates that loose-fitting surgical masks and N95 masks are equivalent in certain healthcare settings when their own data shows that they very clearly are not.
If you find yourself or a loved one in a situation where you need to go to the hospital, please wear an N95 respirator to protect yourselves and others. Additionally, you can request that your providers wear N95 masks as a reasonable accommodation under the ADA. These are helpful accommodations request templates from Massachusetts Coalition for Health Equity. Please refer to our guidance on requesting hospitals implement universal masking to keep you and your loved ones safe during hospital visits.
Wins
The FDA approved updated vaccines from Moderna and Pfizer/BioNTech for people 12 years of age and older and authorized under emergency use for individuals aged 6 months to 11 years old. The updated FDA guidelines state that babies and young children ages 6 months through 4 years who have not been vaccinated against COVID are eligible to receive three doses of the updated Pfizer/BioNTech shot or two doses of the updated Moderna booster. For those in that age group who have been vaccinated, the number and timing of doses depends on the doses they’ve previously received.
People aged 5 and older, regardless of previous vaccination status, will be eligible for a single dose of the updated vaccine at least two months after their last dose of any COVID vaccine. Most people with health insurance will be able to get the vaccine with no copay. People without insurance may get the vaccine through the CDC’s Bridge Access Program. To find a place to book an appointment for your updated booster, use the Vaccines.gov tool. If you have questions about cost or vaccine availability near you, we suggest calling your local pharmacy.
We are also delighted to know that protestors against Cop City in Atlanta are including masking protections in their plans for their marches on Nov 10-13. As we fight to protect our communities from police violence it is critical that we also fight to protect our communities from deadly and debilitating viruses to ensure that we retain the good health necessary to keep fighting until we get our rights.
Wastewater
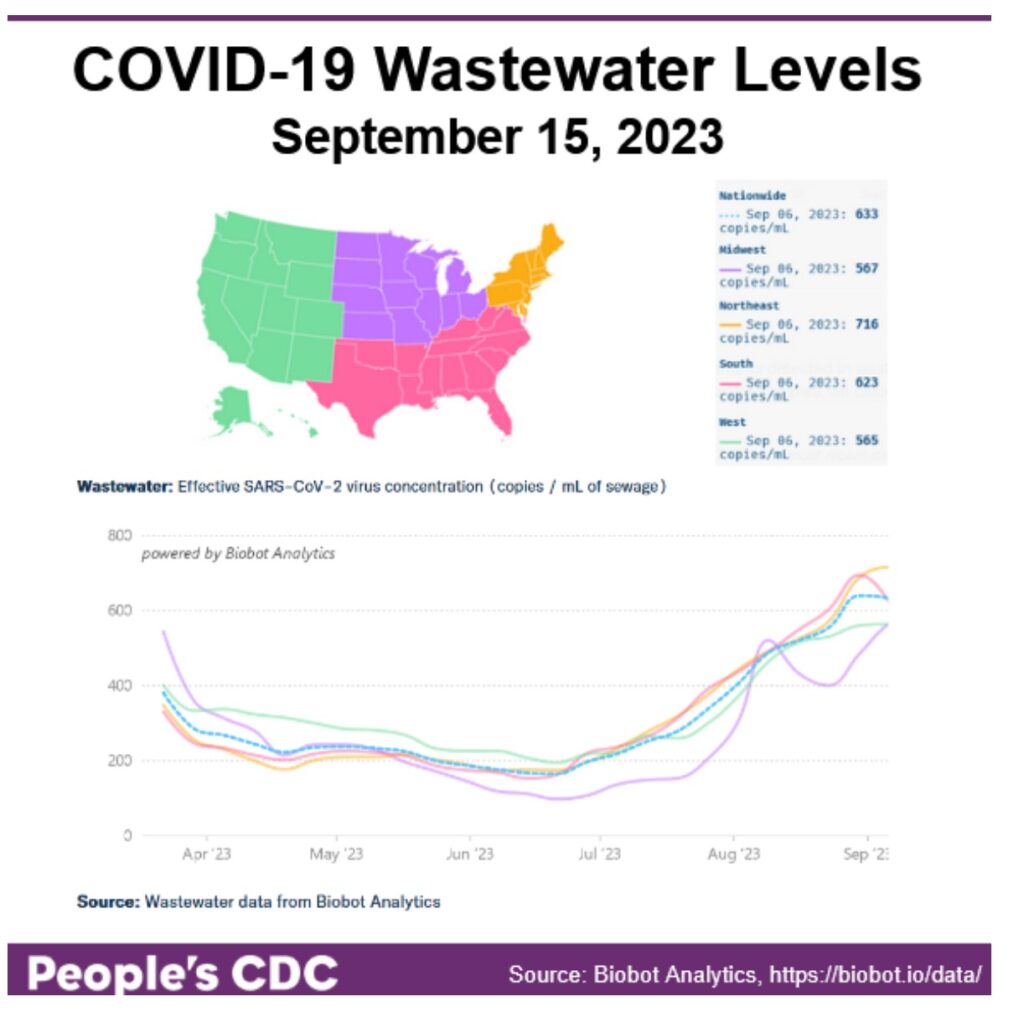
Wastewater levels are still very high, though they are beginning to drop a bit nationally. This is primarily due to a sharp drop in levels in the South. Meanwhile there appears to be a leveling off in the West and Northeast while levels continue to rise in the Midwest. We caution that just because levels appear to be leveling off or dropping in 3 out of 4 regions that does not mean that will last forever–keep in mind, the Midwest just recently exhibited a drop for a few weeks in August before rising again to the even further increased levels that we are currently experiencing.
As mentioned in previous reports, Biobot data has shown retroactive data updates in reports published up to several weeks prior, likely due to variation in the timing of reporting across wastewater sites. We have reached out to Biobot to better understand these changes, and are considering using another source for reporting wastewater, so stay tuned. In the meantime, to account for retroactive fluctuation, we will continue to report the previous week’s wastewater data as it appears to fluctuate significantly less than the most recent findings. Note that the “September 15” date refers to the “data collection date” rather than the last data point reported (September 6).
Variants
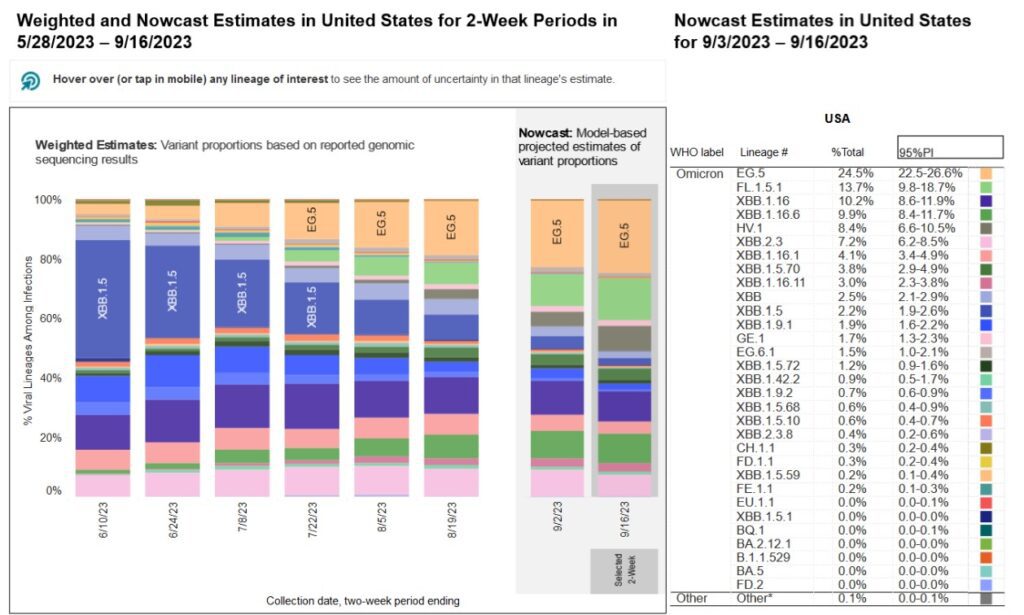
EG.5 (Eris) continues to grow as the most common variant, making up 24.5% of the most recent Nowcast estimates. FL.1.5.1, another XBB-based variant, is in second place at 13.7%. HV. 1 has gone from 4.8% to 8.4% over the past two weeks.
So far, BA.2.86 (Pirola) is not represented, even as we know it is already circulating in several countries and that it has 30 additional mutations as compared with other currently circulating strains, giving it additional potential for bypassing bodily defenses. Although reports may speculate about the severity of the new variant, it is clear that all COVID variants warrant multilayered precautions.
Long COVID
A study published this week found that of 301 participants, 25% had impaired pulmonary function up to one year after COVID infection. The percent of participants with impaired pulmonary function ranged from 11% for those with mild infections, to 48% with severe or critical infections. While the study also reported that older age and comorbidities correlated with higher risk for impaired pulmonary function, we stress that the risk is not zero for everyone else.
A Medpage Today opinion piece authored by three people involved with the RECOVER Long COVID initiative highlights ongoing Long COVID research and emphasizes that the pandemic is not over. The RECOVER Project, beginning as a patient-led push for researchers to study Long COVID, has contributed many insights to the field. As research continues, the world around us is changing. The ending of public health emergencies and the continuing evolution of the virus must drive us to further collective action. In all spheres, public and private, we need to continue to advocate for layers of protection and widely accessible public health for the people.
Media Access
Media censorship of COVID search terms continues to be an ongoing issue. For example, the new Threads app shows no search results for COVID-related information. We have also heard anecdotal reports of censorship of COVID search terms in other social media such as Twitter and Instagram. We encourage you to point these issues out as they come up, and we hope that as a light is shined on this kind of censorship and that these sites are eventually forced to undo this harmful obscuring of important information.
Take Action
This school year, mass illness and death appears to be the policy in place, and Oregon is one of the fronts of this fight. The Oregon Health Authority (OHA) is proposing to no longer list COVID as a restrictable disease, making it possible for people to come to workplaces and schools sick with COVID. They have already given the go-ahead to asymptomatic COVID-positive students to go to school and spread it to others. The OHA is holding a hearing on 9/18 at 3 pm PST and accepting public comments until 9/21 at 5 pm PST. We urge you to support Pan End It’s effort to stop this by submitting public comments and sending a letter to them denouncing these inhuman policies.
We thank everyone who came in support of COVID safety in hospitals at the Healthcare Infection Control Practices Advisory Committee (HICPAC) meeting on August 23. We have more action steps after this meeting to continue the fight. For example, the CDC opted against accepting public comment on the Federal Register this time, instead opting to accept email comments which they promised to post publicly after 60 days. It is still up in the air whether these will ever be posted, so we at the People’s CDC have created our own People’s Register to post comments. Please, forward your email comments to us, and we will post them. We additionally encourage you to write to your legislators about the impacts of the HICPAC decisions on your life.
As mentioned earlier in the report, if you find yourself or a loved one in a situation where you need to go to the hospital, please wear an N95 respirator to protect yourselves and others. Additionally, you can request that your providers wear N95 masks as a reasonable accommodation under the ADA. These are helpful accommodations request templates from Massachusetts Coalition for Health Equity. Please refer to our guidance on requesting hospitals implement universal masking to keep you and your loved ones safe during hospital visits.
Curiously, Democracy Now! continues to be silent on efforts to get COVID protections in hospitals. We encourage you to write to them asking them to cover these efforts so we can increase media coverage to reveal the truth about what is happening. Democracy Now! is a particularly vital outlet as most mainstream outlets are not reporting on these efforts at all and Democracy Now! is known for its efforts to deliberately highlight important social causes and issues that mainstream media will not cover.
Notes: 1) The numbers in this report were current as of 9/15/2023. 2) Changes in testing access as well as data reporting have led many federal data sources to become less reliable. 3) Wastewater data appears to be retroactively updated months after it is initially reported by Biobot. No official explanation for this has been given. 3) Check out the links throughout & see our website for more! https://bej.gbh.mybluehost.me