
The Weather:
As the first COVID uptick since the end of the national emergency continues, this week’s Gallup polls show that 1 in 4 Americans view the COVID situation in the US as worsening. Additionally, public concern about catching COVID has increased for the first time since July of 2022.
Still, despite the increase in cases, heightened pessimism, and decrease in widely accessible resources, few Americans report regularly wearing a mask when they leave home. As we move towards the Fall/Winter season and the anticipated return of last year’s “tripledemic”, here is a reminder that if you are one of the newly anxious, but have long stopped masking in public and communal spaces, now might be the time to even gradually re-introduce masking into your day-to-day routine.
University students at Harvard, Princeton, and Howard express their frustration with a lack of clear guidelines and support for the influx of COVID infections at a time when campus case counting, PCR testing, and solitary isolation space have been largely phased out. Though isolation policies still exist on the books, the responsibilities of creating an isolation plan, securing separate housing, obtaining food while sick, and keeping up with classes on campuses with few remaining Zoom options all seem to fall directly on the sick student and their new dormmates. Without direct support from the universities, many students are finding it difficult to take the space they need to heal and access basic resources such as food and medicine.
Meanwhile, on the primary school front, a Gothamist article on how to track the back-to-school surge in NYC reinforces that “because of changes in how officials and clinics test for and track the virus, old standbys — cases, test positivity, and community transmission levels — don’t mean as much as they once did.” In the absence of adequate data, readers are encouraged to be conscious of upticks in their social circles via positive tests that they witness on social media. Epidemiology professor Denis Nash at the CUNY Graduate School of Public Health says in the article “It’s important to pay attention to what’s going on around you…if people in your workplace, social circle are getting sick, that means it’s around you and it’s time to think about taking certain precautions in social situations.” He also recommends taking precautions if you are in regular contact with school-age kids. In the same article, Dr. Wafaa El-Sadr, a professor of epidemiology at Columbia University’s Mailman School of Public Health and principal investigator at the city’s Pandemic Response Institute reminds us that “Now it’s a lot more complicated than it used to be…We have to find ways we can pull together all these different metrics into an analysis that helps people think about what they should do tomorrow.”
Across the border in Alberta, Canada in the week of September 5 – 12th, acute care COVID outbreaks have jumped with 146% more healthcare workers and 55% more patients testing positive for COVID.
Wins:
On November 1st, healthcare workers in several California Bay Area counties such as Contra Costa, Alameda, Sonoma, San Mateo, and Santa Clara will be required to wear masks in patient care settings in anticipation of continued COVID transmission as well as the wider respiratory virus season.
An article co-written by the Peoples CDC’s own Dr. Lara Jirmanus and Dr. Andrew Wang was released this week via CNN outlining the true toll of hospital-acquired COVID infection and the means that the American system undertakes in order to downplay COVID’s impact on increased hospital-acquired disability and death, largely for monetary interests.
Starting September 25th, US households can once again place an order to receive 4 more rapid antigen tests delivered directly to their homes free of charge.
When using your new rapid antigen tests this Fall, it is important to take into account that due to vaccines and previous infections, our immune systems may recognize the virus and begin to respond faster, resulting in symptoms on days 1 and 2 post-exposure, but rapid antigen tests are made to detect the virus at levels that are present on day 5 post-exposure. So if you are early in your COVID infection or experiencing an asymptomatic infection, you may very well still test negative on a rapid antigen test. With rapid antigen tests, the FDA recommends serial testing in 48-hour intervals. A government-funded study from Winter 2021-2022 found that when symptoms were present, RATs detected COVID infection 60% of the time with a single test, and 90% of the time during repeat testing 48 hours later. In asymptomatic cases, a single test only caught positive cases 9% of the time, a second test after 48 hours detected COVID 62% of the time, and a third test after another 48-hour interval (or 4 days later) was able to detect COVID 75% of the time.
Testing:
When using rapid tests to attend events, to exit quarantine, or in other situations where one may be experiencing asymptomatic or presymptomatic COVID, it is especially important to take at least 2 tests over a 48-hour period and to use a high-quality mask (such as an N95, KN95, or KF94) in public and communal spaces until at least a second or third test is cleared. It also remains important to take samples from both the back of throat and the nose for maximum detection rate.
If quicker results are needed in situations where the test subject is asymptomatic, a more sensitive, PCR test could be the better option.
If you are in need of PCR testing, the CDC’s ICATT program is still in effect to provide no-cost access to rapid antigen tests and PCR testing for those who are uninsured and can verbally confirm that they are experiencing symptoms or have been in close contact with someone who has recently tested positive. For treatment options, the NIH’s Home Test To Treat Program allows the uninsured and underinsured to receive free telehealth services and antiviral treatment if they can confirm test positivity and/or current COVID symptoms. Remember to also check for local resources that could be more readily available to you, such as New York City’s express testing centers and the 212-COVID-19 Paxlovid hotline.
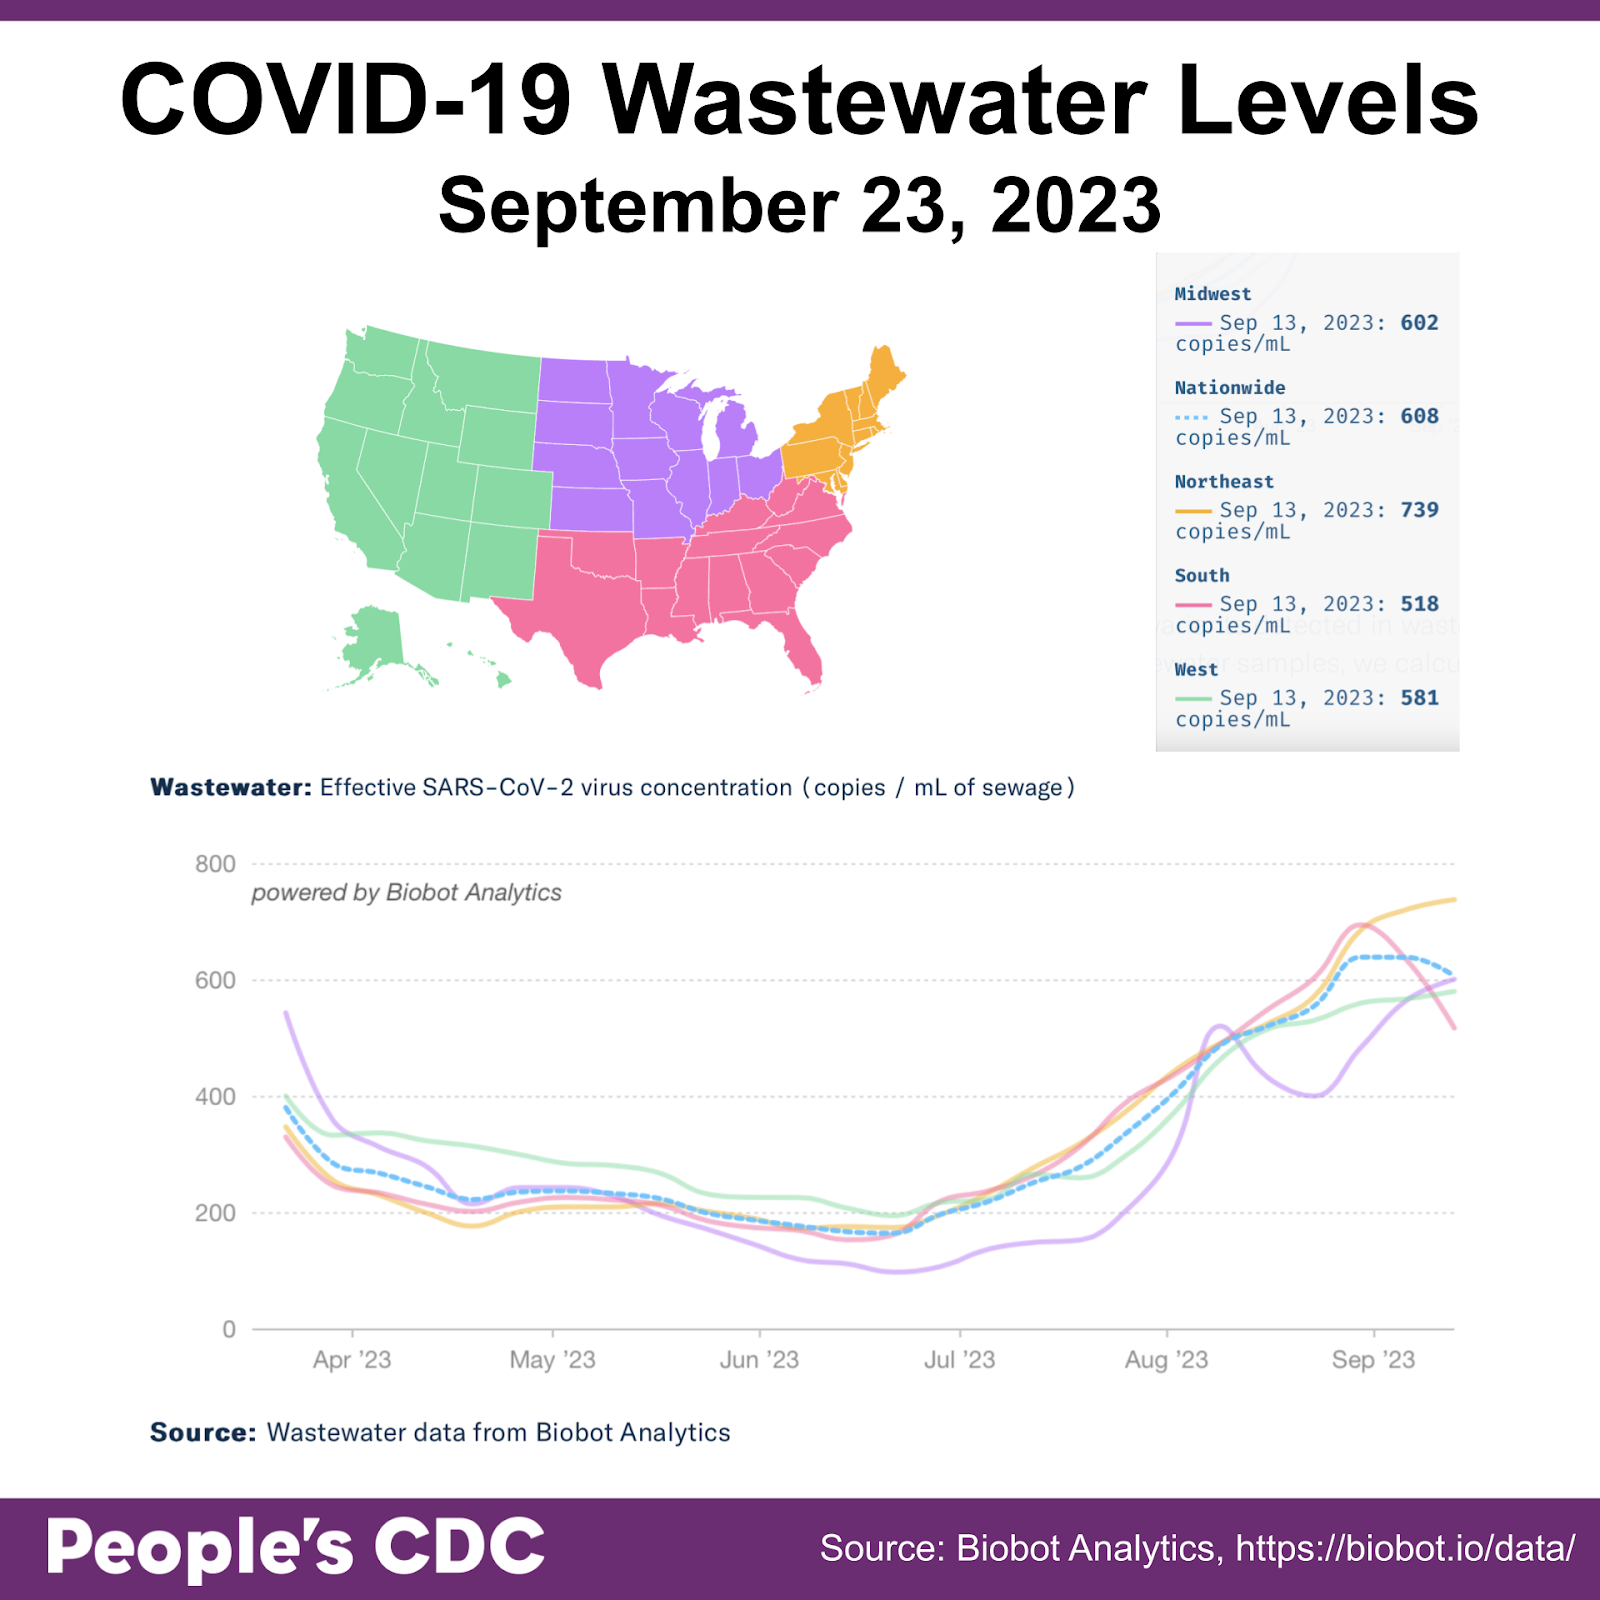
Wastewater:
Wastewater levels continue to rise in the West, Midwest, and Northeast regions. The national average decreased again slightly for the second week in a row, from 640 to 639 copies/ml between August 30th and September 6th and from 639 to 608 copies/ml from September 6th to the 13th, due to levels in the South which continue their sharp outlier of decrease. We are reminded that when looking at wastewater data, it is important to study your own region and county to estimate your current level of risk. It is also important to track sharp decreases over a few weeks instead of adjusting behavior based on the data from the previous week or two, to account for retrospective updates in levels.
As mentioned in previous reports, Biobot data has shown retroactive data updates in reports published up to several weeks prior, likely due to variations in the timing of reporting across wastewater sites. We have reached out to Biobot to better understand these changes, and are considering using another source for reporting wastewater, so stay tuned. In the meantime, to account for retroactive fluctuation, we will continue to report the previous week’s wastewater data as it appears to fluctuate significantly less than the most recent findings. Note that the “September 23” date refers to the “data collection date” rather than the last data point reported (September 13).
Variants
EG.5 (Eris) continues to grow as the most common variant, making up 24.5% of the most recent Nowcast estimates. FL.1.5.1, another XBB-based variant, is in second place at 13.7%. HV. 1 has gone from 4.8% to 8.4% over the past two weeks.
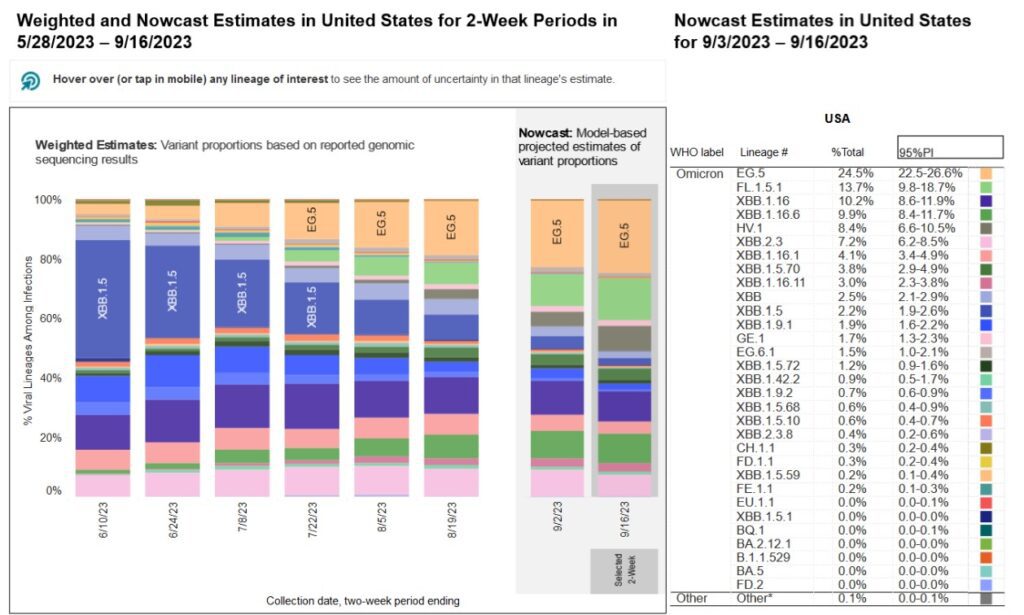
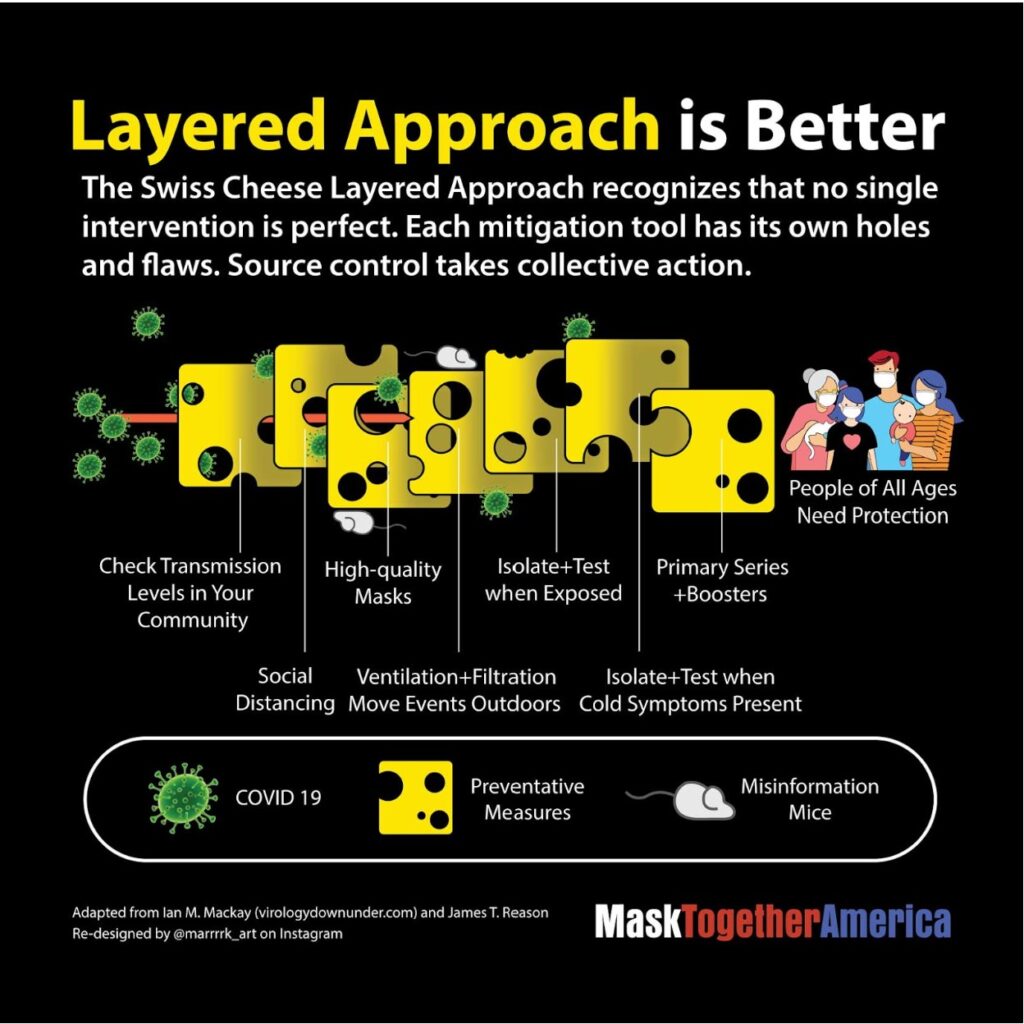
So far, BA.2.86 (Pirola) is not represented, even as we know it is already circulating in several countries and that it has 30 additional mutations as compared with other currently circulating strains, giving it additional potential for bypassing bodily defenses. Although reports may speculate about the severity of the new variant, it is clear that all COVID variants warrant multilayered precautions. This graphic from MaskTogetherAmerica illustrates each layer of protection as different slices of swiss cheese.
Long COVID:
A study published this week in the NRHA Journal of Rural Health found that “the prevalence of long COVID (defined as self-reported SARS-CoV-2 infection with symptoms >28 days) among farmworkers with a suspected or test-confirmed infection was 61.8%”. Farmworkers suffer from greater susceptibility to Long COVID, attributed to denied access to healthcare, disability benefits, paid time off, or social safety nets due to low pay rates and undocumented status. They also suffer from repeat infections due to crowded working and living conditions, which over time can limit their ability to continue to perform physically taxing work. A targeted response must be formulated to address the needs and vulnerabilities of this specific community.
A StreetsBlog USA article examines the effect of Long COVID on sustainable transportation. In this article, Kea Wilson interviews John Bolecek, who built his career in bicycle and pedestrian planning for the state of Virginia on how a relatively mild COVID infection in 2022 eventually led to ME/CFS that now forces him to get around mostly by car. Wilson discusses his development of Long COVID despite being “fit, vaccinated, and boosted”, having to take medical leave from his job, and the difficulty of generating political advocacy and clinical trials for Long COVID in a world where officials believe that “before they [get] the trails up and running, everyone with long Covid will have gotten better by that point. And it’s just not true.”
Deaths:
The Economist publishes a global excess death tracker that uses total mortality data from 84 of the world’s 156 countries with a population of at least 1 million people and then applies a machine-learning model to correct for inconsistencies in available data to calculate the true toll of the COVID pandemic. “How many people have died because of the Covid-19 pandemic? The answer depends both on the data available, and how you define “because”. Many people who die while infected with Sars-CoV-2 are never tested for it…And what about people who died of preventable causes during the pandemic, because hospitals full of Covid-19 patients could not treat them?”
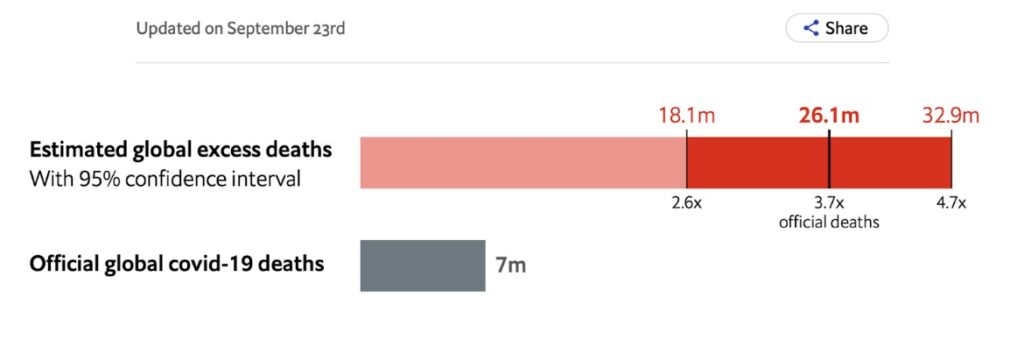
Although the official number of worldwide deaths caused by the ongoing COVID pandemic is now 7 million, as of September 23rd The Economist’s tracker estimates that the actual toll in terms of worldwide excess deaths is closer to 26.1 million people, with a 95% chance that the true value lies between 18.1 million and 32.9 million excess deaths compared to pre-pandemic numbers.
A World Socialist Web Site article written in response to this data describes the 26 million excess death milestone means that there have been 161,741 excess deaths in the US and 4.5 million globally in the past year since US President Biden falsely declared an end to the pandemic on September 18, 2022, giving license to other countries to adopt the same rhetoric. The article details an interview with biologist Arijit Chakravarty from July where he stresses that despite the global propaganda detailing the end of the pandemic and the downplay in COVID surveillance numbers, the pandemic is actually still in its beginning stages. And “by creating the impression that the pandemic is over in the face of rampant viral spread and continuing rapid viral evolution, we are essentially sticking our chin out and asking the virus to do its worst”.
The CDC has announced that they will discontinue their Excess Deaths Associated with COVID-19 tracker for the US as of this Wednesday, September 27th.
Note: On September 24th The Economist’s Excess Death calculator was updated to reflect a new total of 29.3 million worldwide excess deaths, with a 95% chance that the true value lies between 17.9 and 31.8 million worldwide excess deaths. The updated estimate is 4.2x the official global COVID death count of 7 million, which remains unchanged.
Take Action
NYC, save the date! The New York City Council Subcommittee on COVID Recovery & Resiliency and Committee on Health are holding a hearing on Wednesday, October 4, 2023, at 10 AM at NYC City Hall and via Zoom, on “Oversight: Analyzing the Summertime Surge in Covid-19 Cases”. Show support for the important bill Int 1020-2023, which will provide free masks, other PPE, and rapid tests through the mail to NYC residents. Call on NYC to put in place stronger COVID prevention efforts including reinstating mask requirements in healthcare and more. Sign up to testify virtually, in person, or submit written testimony.
Additionally, there will be another NYC City Council Hearing next Wednesday, September 27th, at 1:00 PM on “Oversight — Protecting New Yorkers from Heat and Air Quality Emergencies”. Sign up to testify virtually, in person, or submit written testimony for that hearing here.
For more specific questions on organizing surrounding the above two topics or to get regular updates surrounding COVID advocacy and the NYC City Council, email COVIDAdvocacyNY@gmail.com or visit COVIDAdvocacyNY.org.
Additionally, sign COVID Advocacy Initiative’s petition to The White House for free N95 respirators available nationwide via the mail where those who need them do not have to venture into drug stores without mask requirements to seek them out!
Sign MaskTogetherAmerica’s petition to the CDC Director Dr. Mandy K. Cohen demanding that she employ a multi-layered approach to preventing COVID and Long COVID.
We thank everyone who came in support of COVID safety in hospitals at the Healthcare Infection Control Practices Advisory Committee (HICPAC) meeting on August 23. We have more action steps after this meeting to continue the fight. For example, the CDC opted against accepting public comment on the Federal Register this time, instead opting to accept email comments which they promised to post publicly after 60 days. It is still up in the air whether these will ever be posted, so we at the People’s CDC have created our own People’s Register to post comments. Please, forward your email comments to us, and we will post them. We additionally encourage you to write to your legislators about the impacts of the HICPAC decisions on your life.
As mentioned in previous reports, if you find yourself or a loved one in a situation where you need to go to the hospital, please wear an N95 respirator to protect yourself and others. Additionally, you can request that your providers wear N95 masks as a reasonable accommodation under the ADA. These are helpful accommodations request templates from the Massachusetts Coalition for Health Equity. Please refer to our guidance on requesting hospitals implement universal masking to keep you and your loved ones safe during hospital visits.
Curiously, Democracy Now! continues to be silent on efforts to get COVID protections in hospitals. We encourage you to write to them asking them to cover these efforts so we can increase media coverage to reveal the truth about what is happening. Democracy Now! is a particularly vital outlet as most mainstream outlets are not reporting on these efforts at all and Democracy Now! is known for its efforts to deliberately highlight important social causes and issues that mainstream media will not cover.
Notes: 1) The numbers in this report were current as of 9/24/2023. 2) Changes in testing access as well as data reporting have led many federal data sources to become less reliable. 3) Wastewater data appears to be retroactively updated months after it is initially reported by Biobot. No official explanation for this has been given. 3) Check out the links throughout & see our website for more! https://bej.gbh.mybluehost.me