
The Weather:
Wastewater levels appear to have dropped slightly in the West, Midwest, and South regions. The national average decreased, from 608 copies/ml to 509. However, wastewater levels remain higher than the past six months and as high as this past Winter of 2023. Until we see a significant drop, the risk for a COVID infection ranges between substantial to high. As an important reminder, when looking at wastewater data, it is important to examine your own region and/or county to estimate your current level of risk. Check your county or state for local information. Another source for wastewater tracking is SCAN.
As mentioned in previous reports, Biobot data has shown retroactive data updates in reports published up to several weeks prior, likely due to variations in the timing of reporting across wastewater sites. In the meantime, to account for retroactive fluctuation, we will continue to report the previous week’s wastewater data as it appears to fluctuate significantly less than the most recent findings. Note that the “September 30” date refers to the “data collection date” rather than the last data point reported (September 20).
Since the CDC stopped providing a national COVID transmission map, the People’s CDC has been working on something to replace it. The People’s CDC is building a new COVID transmission map that will be measured at the state level. We look forward to potentially sharing it in the near future.

Wins
Many healthcare settings continue to enact masking in some aspects of their care as a result of increased rates of COVID among patients and their workforce. We applaud healthcare systems implementing universal masking as this remains one of the key layers of protection from infection especially in healthcare settings as highlighted in the recent piece by members of People’s CDC published in CNN.
This is a reminder that US households can place an order to receive 4 more rapid antigen tests delivered directly to their homes free of charge.
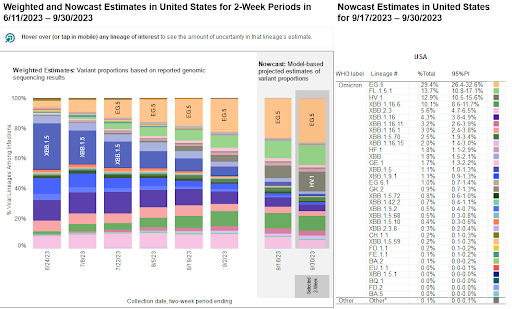
Variants:
EG.5 (Eris) remains the most common variant, making up 29.4% of the most recent Nowcast estimates. FL.1.5.1, another XBB-based variant, is in second place at 13.7%. HV. 1 has increased from 8.4% to 12.9% over the past two weeks. XBB.1.16.6 now is at 10.1%.
Treatment and Long COVID:
A recent study in JAMA Network Open reminds us of the importance of therapeutics showing the effectiveness of Paxlovid (Nirmatrelvir) and Lagevrio (Molnupiravir) for treating a COVID infection by preventing hospitalization and death. The study demonstrated that these therapeutics among this cohort of patients were even more effective in preventing death than hospitalization.
According to a September 2023 CDC report using 2022 data from the National Health Interview Survey extrapolated from their survey of 27,651 adults, at least 6.9% of adults have or have had Long COVID, while those with lower incomes were more likely to have Long COVID. It is important to be aware that symptoms that persist after a COVID infection are highly likely a result of Long COVID.
In understanding the biological aspects of Long COVID, a study in the Nature Journal examined potential biological features associated with this condition. A set of patients were compared to examine “biomarkers” for Long COVID, and the study found a set of immunological and hormonal factors that may better predict who will have Long COVID. This coming November 1st, a virtual conference hosted by Health Watch USA will be discussing the impact of Long COVID on health and society.
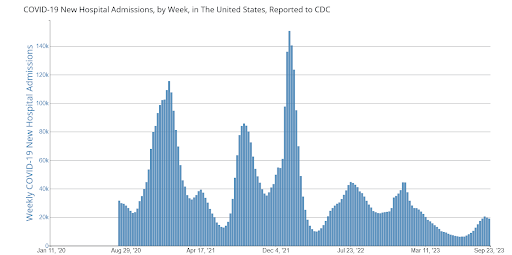
Hospitalization
New weekly hospitalizations associated with COVID have increased, reaching a new peak of over 19,000 during the week of September 9, 2023. This number is nearly 3 times the total number of hospitalizations since July 1, 2023, in which there were over 6,000 hospitalizations. More recently, there has been a slight decrease in new hospitalizations.
Take Action
It is important to take action both nationally and locally. We recently encouraged followers to submit a comment by September 29th to the federal registry to tell Occupational Safety and Health Administration (OSHA) to ensure the implementation and protection of COVID precautions in workplace settings. You can still watch the meeting being held by OSHA on October 19th at 1 pm eastern (in listen-mode only) via webex, a teleconference system hosted by the Department of Labor. Continue to monitor this newsletter and our social media for other similar opportunities in the future to voice your support of layers of protection. Participating in local groups can be impactful as well and you can find ways to participate in these local groups categorized by state.
Disappointingly and not surprisingly, the rollout for the updated COVID vaccines has resulted in limited access for many people, in particular vulnerable populations and those in younger age groups. There have been reports that limited supply and poor planning by insurance companies have resulted in access and financial barriers.
Some Americans have chosen to opt into their pharmacy’s waitlist notification system about newly available appointments to get their Covid vaccine. Others have found success getting the updated vaccine by calling their local pharmacy directly to see if doses are available.
Another way to access the vaccine is by contacting your local public health authorities about free vaccine clinics they may be hosting. Click the link below to learn more about the Bridge Access Program, an effort by the US Dept of Health and Human Services (HHS) to connect uninsured and underinsured adults to local, free vaccine resources.
More information is available on Getting No-Cost COVID-19 Vaccines Near You.
Notes: 1) The numbers in this report were current as of 10/1/2023. 2) Changes in testing access as well as data reporting have led many federal data sources to become less reliable. 3) Wastewater data appears to be retroactively updated months after it is initially reported by Biobot. No official explanation for this has been given. 3) Check out the links throughout & see our website for more! https://bej.gbh.mybluehost.me