
The Weather (according to Wastewater)
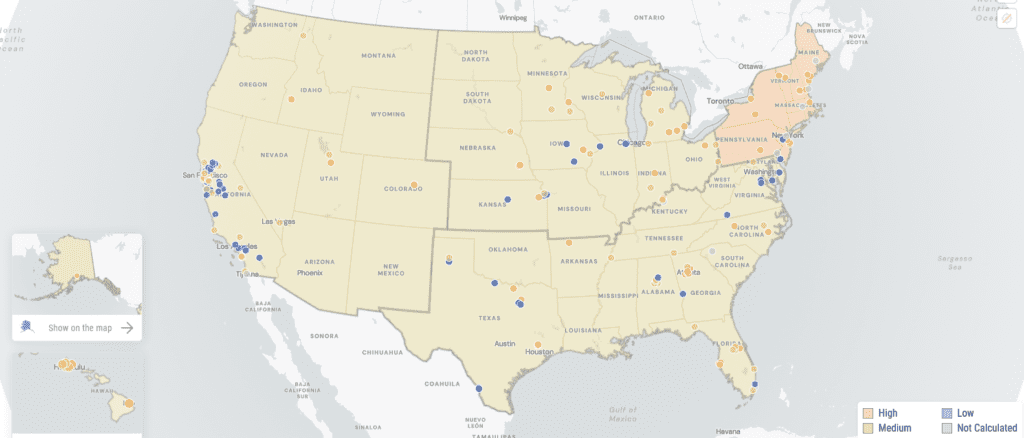
Wastewater levels reported by Biobot have ended on September 25, 2023, due to their contract with the CDC’s National Wastewater Surveillance System (NWSS) coming to an end. The CDC has entered a new, 5 year contract with the research organization, Verily (a subsidiary of Alphabet Inc, the tech conglomerate that owns Google). In the meantime, while we wait for the CDC and Verily to make this transition, we will use the map below. WastewaterSCAN, another source for wastewater surveillance, has been providing a national map of COVID levels divided into four major regional areas since early October 2023.
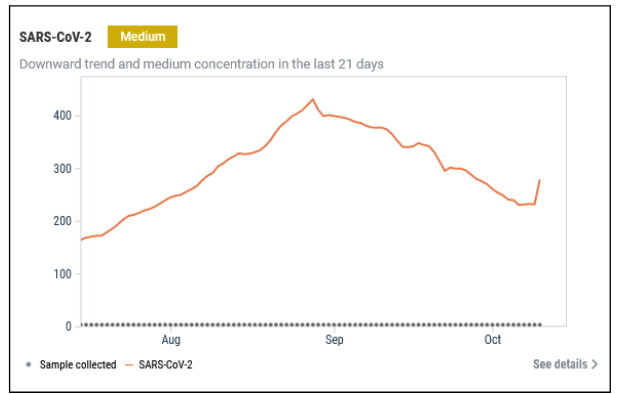
According to WastewaterSCAN, nationally, COVID wastewater levels are at medium while the Northeast is high since their last update from October 10, 2023. Across the US, COVID wastewater levels are at 278.4 PMMoV Normalized on October 10, 2023, down from a peak of 430.5 PMMoV Normalized on August 28, 2023. PMMoV normalization differs from how Biobot normalizes data, so the raw numbers are not directly comparable with Biobots. Also note that WastewaterSCAN has fewer wastewater test sites than Biobot and there are some other technical factors that give us reason to be a little skeptical of WastewaterSCAN’s data. Only time will tell whether it will improve.
We continue to wait on the Verily to finish their visualizer dashboard and to provide both regional and national wastewater surveillance levels. As mentioned last week, we repeat our calls for thorough, transparent, and timely gathered and analyzed COVID data to help everyone make safe choices.
Wins
The Biden Administration is proposing a rule update to the US Department of Health & Human Services’s (HHS) interpretation of Section 504 of the Rehabilitation Act of 1973 that would cause healthcare facilities to be liable for denying health care to and discriminating against people with disabilities. This is a huge win, as it strengthens the case of anyone who is denied access to safe health care due to lack of COVID protections such as universal masking. ‘Pan End It’ has a nice guide with more information about this rule change, as well as how to submit public comment by November 13th to let the HHS know our experiences with being discriminated against for our need for universal masking in healthcare.
Variants
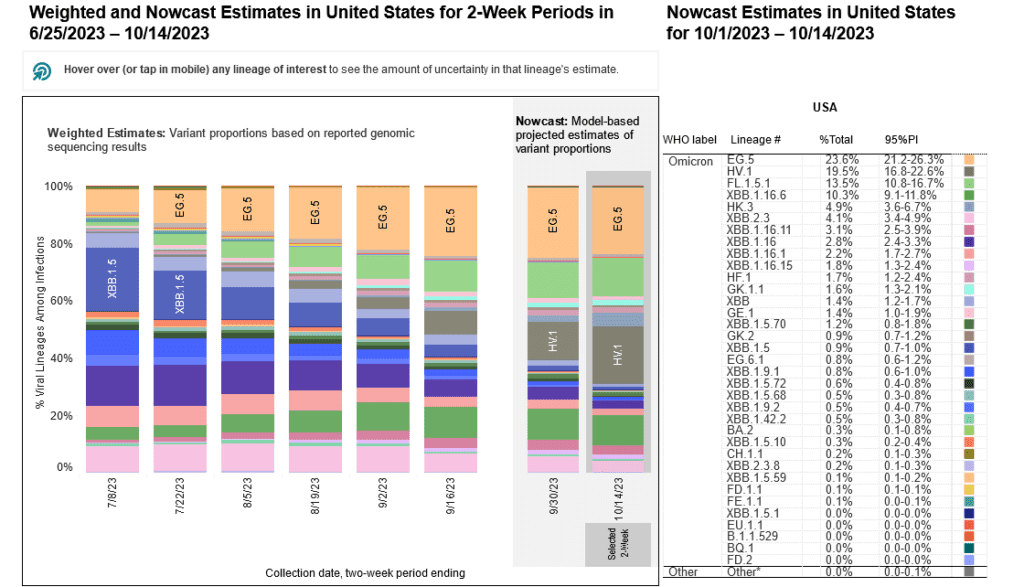
EG.5 (Eris) continues to remain the most common variant, making up 23.6% of the most recent Nowcast estimates. HV. 1 appears to be increasing, having now risen to being the second most common variant, up from 12.9% to 19.5% over the past two weeks. FL.1.5.1, another XBB-based variant, now is third at 13.5%. XBB.1.16.6 now is at 10.3%.
Hospitalizations and Deaths
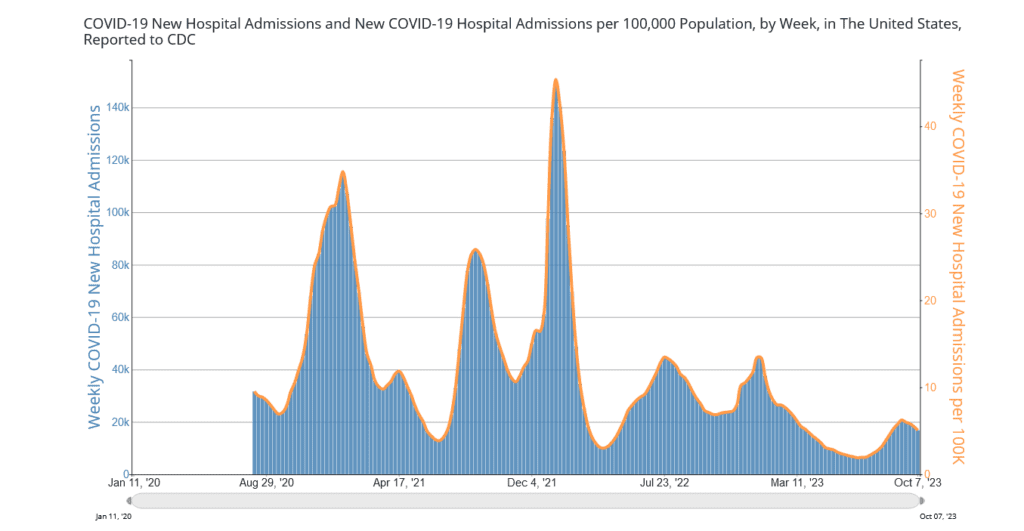
New weekly hospitalizations associated with COVID have slightly dropped, from a recent peak of 20,706 during the week of September 9th to nearly 17,000 during the week of October 7, 2023. According to the CDC’s COVID Data Tracker, there have been at least 4,000 reported deaths from COVID in the past month.
These are 4000 tragedies we should not continue to accept as “normal.” Every single one of these people had a name, a story, and loved ones who now miss them dearly. We want to remind people what is at stake here: the lives and livelihoods of everyone in our entire society. Keep your expectations high even as society continues to miss them and even worse normalize the most atrocious of circumstances, because it is only when we continue to keep demanding better that we actually will get better.
Vaccines
We continue to encourage everyone 6 months and older to get an updated vaccine, and we recommend getting any of the options available to you, without delay: Pfizer, Moderna, or Novavax. Stay tuned to People’s CDC for a more robust vaccine explainer in the weeks ahead!
We want to remind everyone that you deserve and are entitled to good healthcare. Anyone with health insurance continues to have no-cost access to these vaccines. Those without insurance, through programs like the Bridge Access program, may be able to get no-cost access as well. Be sure to check for local options for no-cost vaccines as well, such as the Vaccine Finder for residents of NYC, in case those options are more accessible for you.
Long COVID
The NIH is sponsoring a seminar on October 16th at 4 pm Eastern in examining Long COVID and children. Register to get the recording for this free NIH sponsored seminar to learn more as it will discuss signs, symptoms, and things caregivers can do if their child has Long COVID. Miss the event? A recording will be made available, so look out for some updates on that!
Resources
For some, traveling is a necessity due to an entire set of reasons. One approach to ensure access to layers of protection is ensuring ventilation while staying in hotels. This resource lists hotels with rooms that allow access to better ventilation through openable windows or doors to outside air. Please be sure to directly call these places to ensure the information is correct before booking your stay.
Take Action
HICPAC, the federal committee that advises the CDC and DHHS on infection control practices in healthcare (or the lack thereof), will meet again on November 2 and 3. A recent update from the union National Nurses United (NNU) shared responses to their FOIA/FACA (freedom of information/public requests). You can read the summaries and NNU’s take here. These findings demonstrate a further need to let HICPAC know that high quality respirators and other layers of protection are necessary in healthcare settings. Previously HICPAC has prioritized employer costs and profits over health, using shoddy science and “expert opinion” shortcuts to justify reducing instead of maintaining or advancing infection prevention efforts.Join National Nurses United in demanding that, prior to voting in the November meeting, the HICPAC/CDC release a draft guidance, to hold public meetings, and to fully recognize the reality of aerosol transmission of infectious disease. Consider sharing an oral comment during the virtual November HICPAC meeting here. Requests are open for one more week until October 23rd, 2023.
Last, local groups are a key opportunity to impact your community. Get involved locally by finding a group to plug into.
Notes: 1) The numbers in this report were current as of 10/16/2023. 2) Changes in testing access as well as data reporting have led many federal data sources to become less reliable. 3) Wastewater data are being sourced from WastewaterSCAN and no longer from BioBot due to the end of the contract with the CDC. 3) Check out the links throughout & see our website for more! https://bej.gbh.mybluehost.me