
The Weather (according to Wastewater)
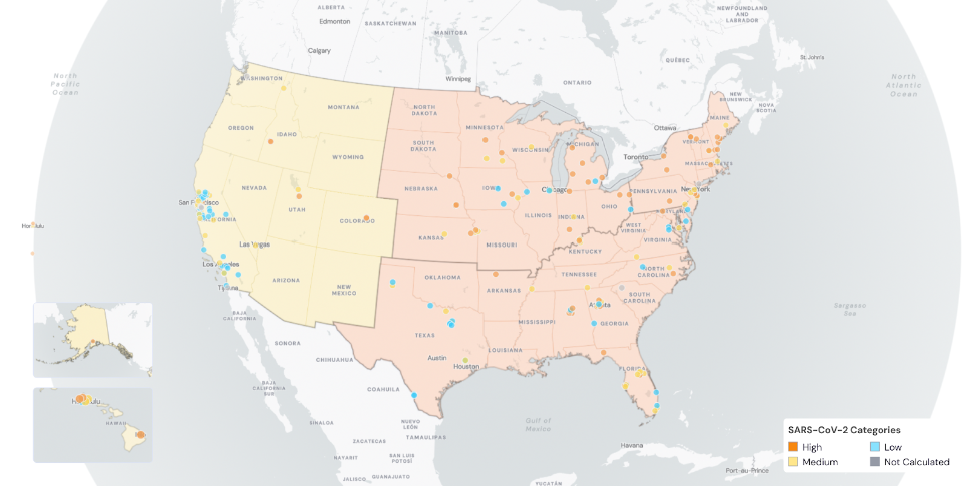
SARS-CoV-2 levels in wastewater are being reported by Biobot again as they file an appeal with the CDC. For now, we will use the map below from WastewaterSCAN, another source for wastewater surveillance. One quarter of the nation’s wastewater testing sites remain shut down while the appeal is being processed, creating an overall gap in data reliability that we could continue to experience for several months to come. We anticipate releasing another COVID map depicting transmission levels developed by the People’s CDC in the coming weeks.
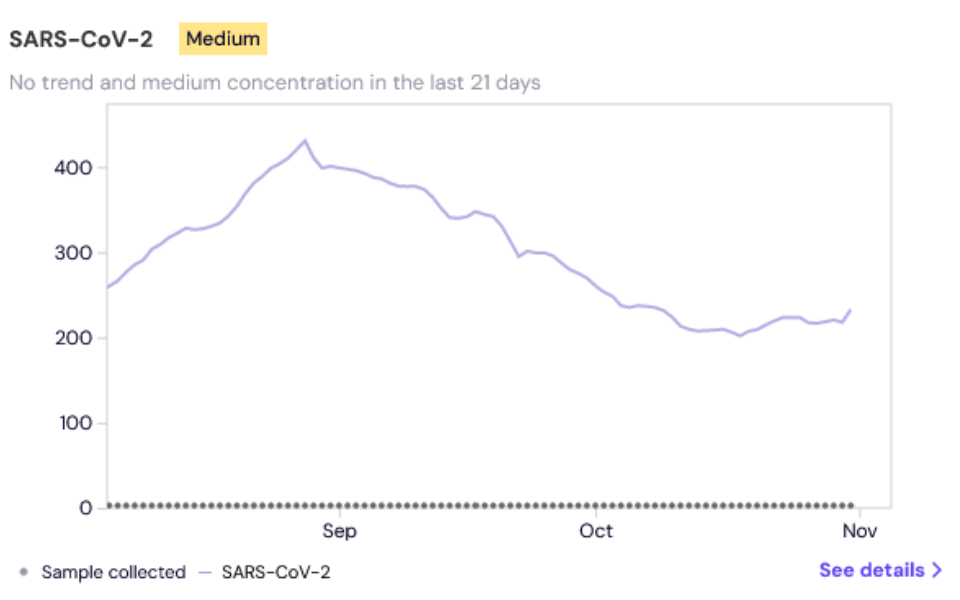
According to WastewaterSCAN, nationally, COVID wastewater levels are at medium while the Northeast, Midwest, and the South are high since their last update from October 31, 2023. Across the US, COVID wastewater levels are at 239.7 Pepper mild mottle virus (PMMoV) Normalized on October 31, 2023, down from a peak of 430.5 PMMoV Normalized on August 28, 2023, but slightly up from 201.8 PMMoV Normalized on October 18, 2023. PMMoV normalization differs from how Biobot normalizes data, so the raw numbers are not directly comparable with Biobot’s.
Wins
On October 27-29, #namingthelost hosted a memorial at St Mark’s Church in-the-Bowery in NYC in order to name, honor, and mourn the individuals that we have lost and continue to lose due to COVID and COVID-related complications. On their homepage, #namingthelost states “We know it didn’t have to be this way, that our country’s leaders made choices that risked our lives. We know we can choose a different way forward that is about caring for all of us.”
Variants
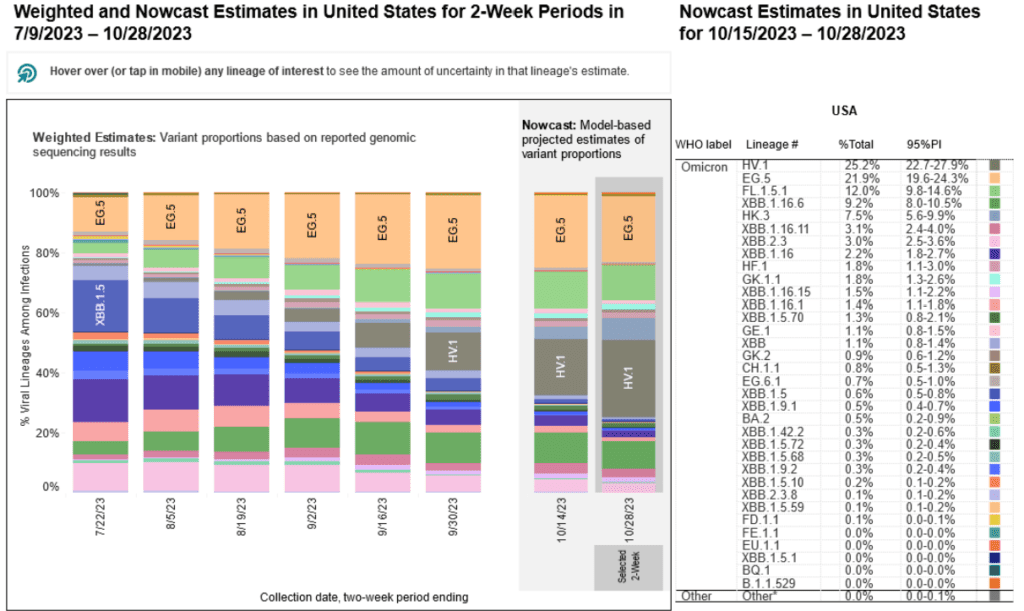
HV.1, a variant of EG.5 (Eris) is now the most common variant, making up 25.2% of the most recent Nowcast estimates. EG.5 has dropped to being the second most common variant, down to 21.9% over the past three weeks. FL.1.5.1, another XBB-based variant, remains at third at 12.0%. XBB.1.16.6 has dropped slightly below 10.0% at 9.2%.
Hospitalizations and Deaths
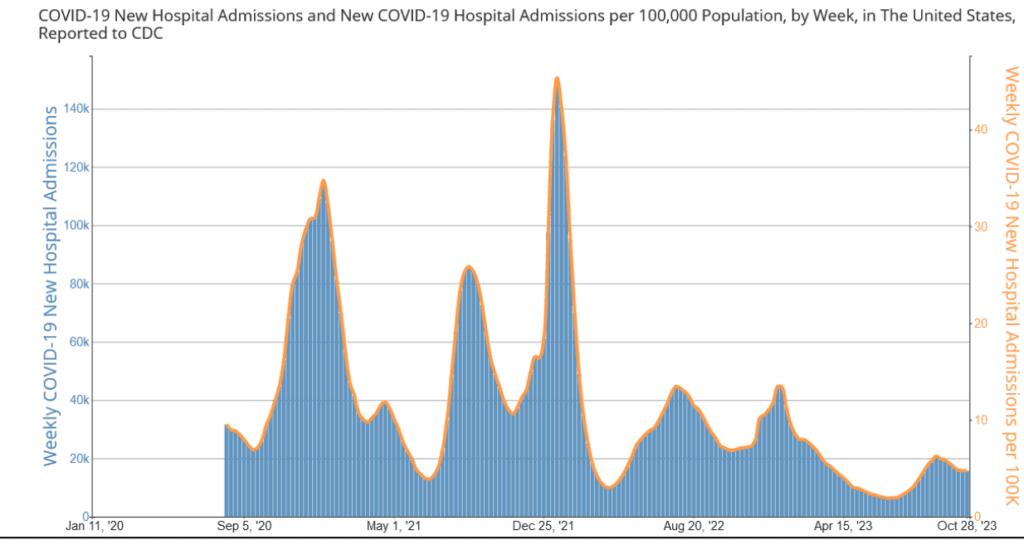
New weekly hospitalizations associated with COVID have stopped dropping, staying at a constant of over 15,000 hospitalizations for the past three weeks including the week of October 28, 2023. According to the CDC’s COVID Data Tracker, there have been another 4,000 reported deaths from COVID in the past month of October. We mourn these 4,000 individuals as this is not “normal.” A reminder that the lives and livelihoods of everyone in our entire society continue to remain at stake. Do not lower your standards as many in society, especially those in the business sector, normalize this ongoing atrocity as they demand for a return to on-site work even though most people prefer the option of remote work. Continue to demand layers of protection such as high-quality masking, ventilation, filtration, and testing, in all settings to prevent ongoing COVID infections, hospitalizations, Long COVID, and death.
Vaccines and Treatment
Do not wait to get an updated COVID vaccine for those 6 months and older! Multiple options are available including Pfizer, Moderna, or Novavax. Access continues to be challenging especially for those with certain health insurance plans or who are uninsured. Lack of interest and access difficulties have likely all contributed to a low uptake of only 3.5% of Americans receiving the most recent and updated COVID vaccine. The Bridge Access program ensures no-cost access and you can find a location as determined by the federal government, but be sure to call ahead and ask to ensure local participation.
Similarly, federal funding for COVID treatment options, such as Paxlovid and Lagevrio, have transitioned from the federal government to health insurance plans on November 1, 2023. Individuals with Medicare or Medicaid will have access through the end of 2024 and those uninsured will have access at least through the end of 2028 via the federal government, but limited information has been provided. Test to Treat locations continue to provide no-cost access to those without insurance while Pfizer’s Patient Assistance Program can also provide no-cost access to Paxlovid (Nirmatrelvir–Ritonavir). If your health insurance plan does not cover COVID treatments such as Paxlovid, you can participate in the Co-Pay Savings Programs offered by Pfizer, which drops the cost out-of-pocket down to 140 dollars.
Long COVID
The scientific understanding of Long COVID continues to grow with a recent study demonstrating that viral persistence may potentially affect some individuals resulting in Long COVID. However, another study that compared Long COVID outcomes among patients who received Paxlovid at the Veterans Health System did not observe lower rates of Long COVID after treatment. A guaranteed treatment for Long COVID remains to be determined while the primary approach in avoiding this is to employ layers of protection such as consistently using a high quality mask or respirator in order to lower the risk, ultimately preventing a COVID infection.
Take Action
HICPAC, the federal committee that advises the CDC and DHHS on infection control practices in healthcare, met on November 2-3 and voted on draft documents, which continue to fail to protect patients and healthcare workers from COVID infections. We provided a nationwide virtual space to protest the CDC HIPCAC meeting on Thursday, November 2nd. Multiple members of the People’s CDC were recognized to provide public comments to members of HICPAC during the meeting. We also submitted the following official statement this week as our comment. We provide instructions and ask you to also submit a comment to them using our recommendations in response to their terrible decision via email to HICPAC@CDC.GOV by 11:59 pm on Monday, November 6th to include in their meeting minutes. The next steps of their process will include the publication of draft documents in the Federal Register, which can be reviewed and commented on by the general public.
Lastly, local groups are a primary opportunity to impact your community. Get involved locally and join a local group.
Notes: 1) The numbers in this report were current as of 11/4/2023. 2) Changes in testing access as well as data reporting have led many federal data sources to become less reliable. 3) Wastewater data are being sourced from WastewaterSCAN. 3) Check out the links throughout & see our website for more! https://bej.gbh.mybluehost.me