
The Weather
The CDC has finally released their own wastewater dashboard with state-level and regional trends. After public pressure to expand wastewater surveillance in September, including from all of us, it’s great to see some progress.
The CDC’s National Wastewater Surveillance System (NWSS) landing page now includes dashboards to check national wastewater viral activity for COVID and Mpox. Additional dashboards for National and Regional trends, State and Territory trends, a wastewater viral activity map, and variants in wastewater are available.
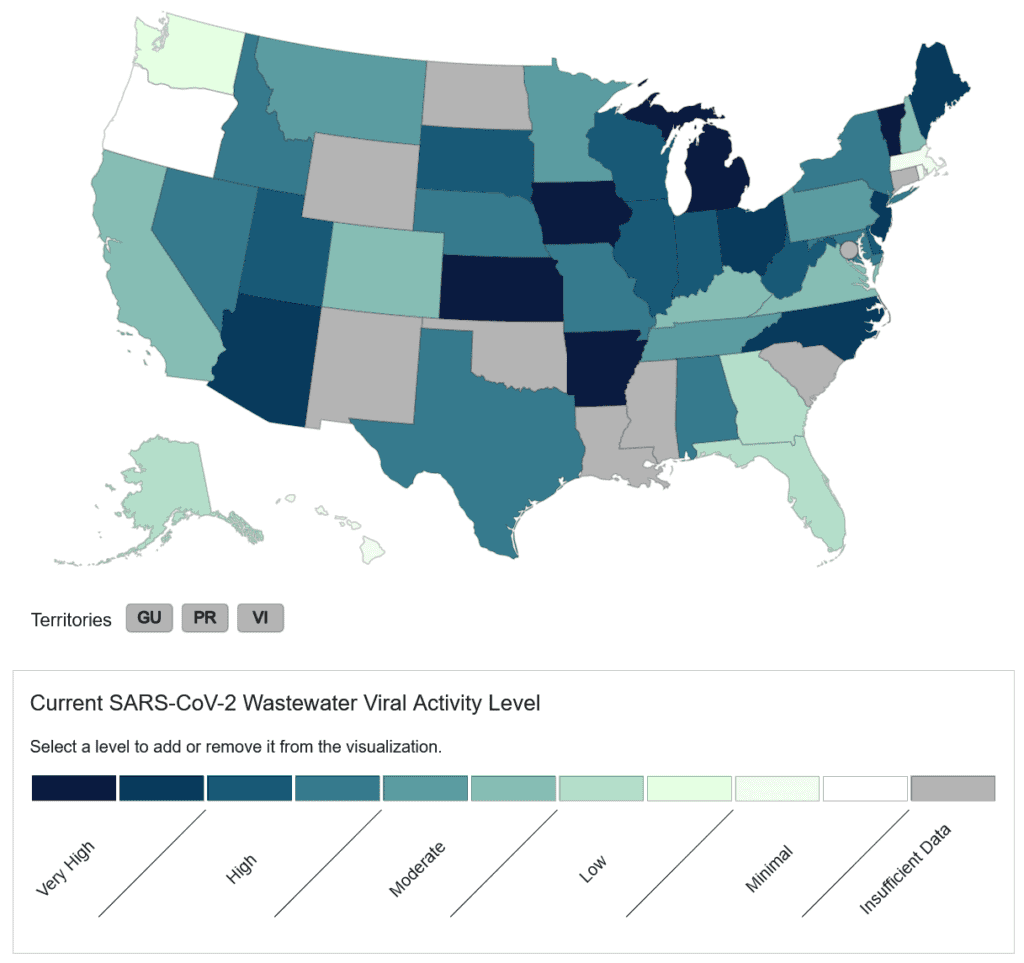
As of 11/25/23, the Current Wastewater Viral Activity Map shows viral activity by state. Many states are reporting high to moderate COVID levels with very few reporting low levels. Approximately 350 sites delayed testing since September 15, 2023. After these sites have resumed testing for six weeks, their data will be added to the dataset. However, we’d suggest the CDC reconsider its color choices, as the calming blue shades they’ve chosen for “high” COVID transmission are misleading at best. They can refer to our red-shaded transmission map for reference.
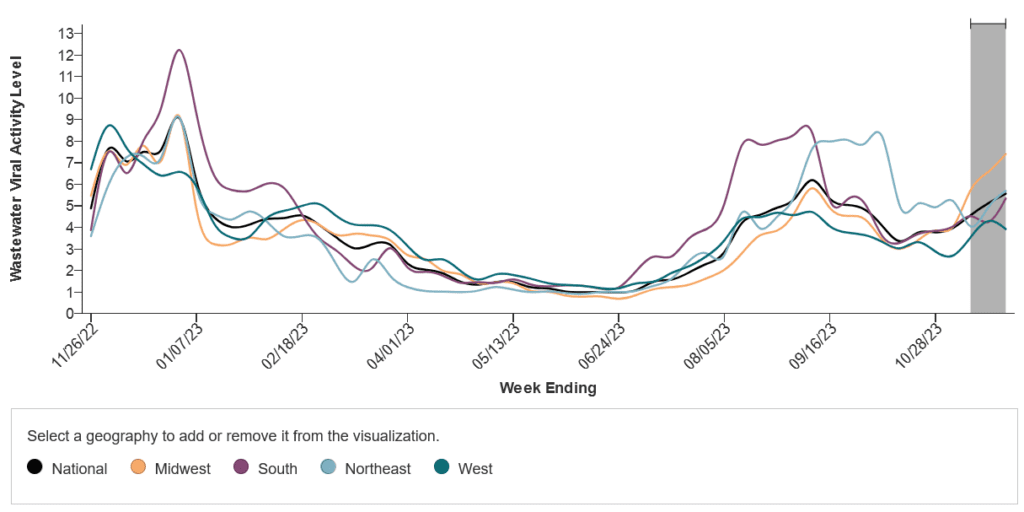
Also updated 11/25/23, the national wastewater viral activity level is high and seems to be trending upward. The West is in decline while the Midwest, South, Northeast and National levels are at an incline. As with Biobot data, the most recent two weeks (indicated by gray shading on the graph) are subject to change due to reporting delays. Trends mentioned in this text are based on the areas before the shaded area shown in the graph.
As we enter the cold and flu season, many in-person gatherings are held. We encourage you to continue monitoring local reports for a more accurate measure of levels. Also, please continue to, and support others in using, layers of protection. And as we continue to report on advocacy successes, remember that our actions and voices can enact change!
Variants
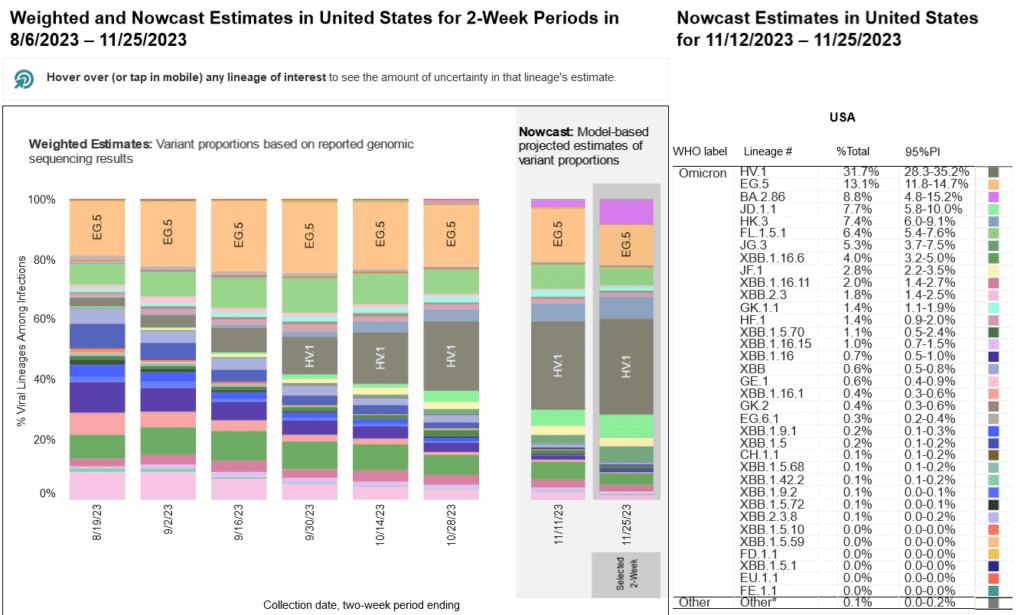
HV.1, a variant of EG.5 (Eris) is now the most common variant, making up 31.7% of the most recent Nowcast estimates. EG.5 has dropped to being the second most common variant, down to 13.1%. BA.2.86 is now in third at 8.8%, followed by JD.1.1.
Hospitalizations
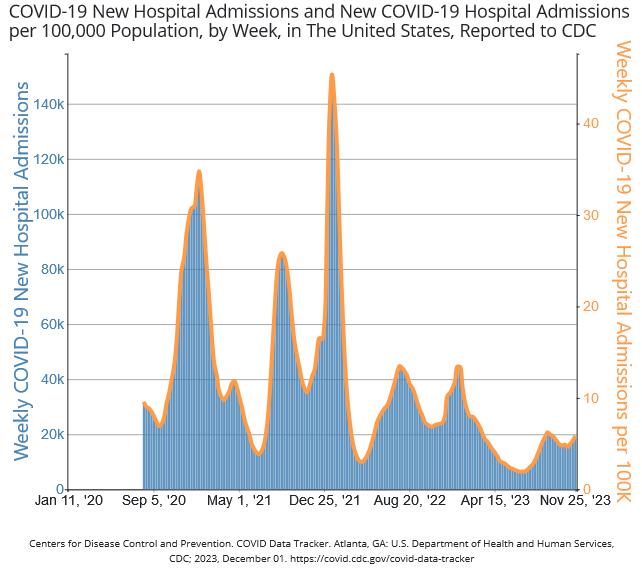
Weekly hospitalizations are trending upward in the last three weeks according to the CDC’s COVID data tracker, with over 19,000 weekly admissions reported 11/25/23. Since we last reported deaths on 10/28/23, there have been an additional 3731 deaths reported, for an average of almost 750 deaths per week. Remember that these numbers are an undercount related to reporting delays in place since the Biden Administration ended the Public Health Emergency. Remember also that COVID deaths follow hospitalization numbers, so we expect these numbers to increase in the weeks to come.
COVID remains the third leading cause of death according to the CDC in the US. We mourn all those who have died due to COVID, and in that mourning, call you to take measures to prevent death and disablement for yourself, your loved ones, and your communities.
Wins
Early this month, school districts across the United States will be able to order free Covid-19 rapid tests from the national stockpile to be distributed to schools with the HHS encouragement to share them with, “students, staff, family members and others in the community.” While this school project of the Biden Administration feels long overdue, we hope new access to free tests aids in preventing the spread of Covid-19, if used correctly.
If your household has not placed a new order for more rapid tests from the federal government through covidtests.gov, you can still place an order for 4 free rapid covid tests here.
The Horward Zinn Book Fair this weekend is requiring masks indoors, and outdoors, within 15 feet outdoors of the venue. Increasingly progressive groups in this country are connecting the dots between our governments’ attempts to erase the ongoing pandemic in an effort to restore business as usual and the necessity of centering public health and disability justice in our social movements. Send them a note of thanks here.
Take Action
We urge you to take a moment to read and sign on to this letter, authored by public health and medical professionals, demanding CDC Director Mandy Cohen reject HICPAC’s (Healthcare Infection Control Practice Advisory Committee) Guideline for Isolation Precautions: Preventing Transmission of Infectious Agents in Healthcare Settings.
Current draft guidelines are incredibly insufficient, inappropriate, and fail to protect both patients and healthcare workers.
Letter can be found HERE.
You also still have time to sign on to the National Nurses United letter urging the CDC “to reject HICPAC’s weak draft and create a new one that protects health care workers and their patients!”
Sign-on deadline for both letters is this Friday, December 8, 2023.
Notes: 1) The numbers in this report were current as of 12/1/2023. 2) Changes in testing access as well as data reporting have led many federal data sources to become less reliable. 3) Check out the links throughout & see our website for more! https://bej.gbh.mybluehost.me