
The Weather
This week we see a sharp increase of COVID in all regions, likely due to increased travel around the recent holiday long weekend and dropping temperatures that bring a lot of gatherings indoors. As the holiday season continues, we remind our readers to use layers of protection — such as ventilation, air purification, masking with a KN95/N95 or better, and testing via PCR or NAAT or testing serially with rapid antigen tests — to protect themselves and their loved ones both during travel and at your holiday gatherings.
Repeat COVID infection has serious implications for everyone, not just the elderly or those with preexisting conditions. Even if you experience a mild case, COVID is a vascular disease that causes multiple organ damage, autoimmune conditions, inflammation and immune system dysregulation that you might not necessarily experience at the time of your infection. It’s important to note that if you or your loved ones have experienced previous COVID infections, you may have entered a high risk group for severe effects and hospitalization without realizing it.
Some people may feel worn down by the current state of the virus, by fatigue of lack of resources, or from the energy spent protecting one’s self from an infection; with increasing wastewater levels and the onset of a new dominant variant this week, now is really the crunch time to stay strong and endure. For those who have stopped precautions, we invite you to return to masking and other levels to minimize transmission. This is the most important time to return to masking to protect yourself and others.
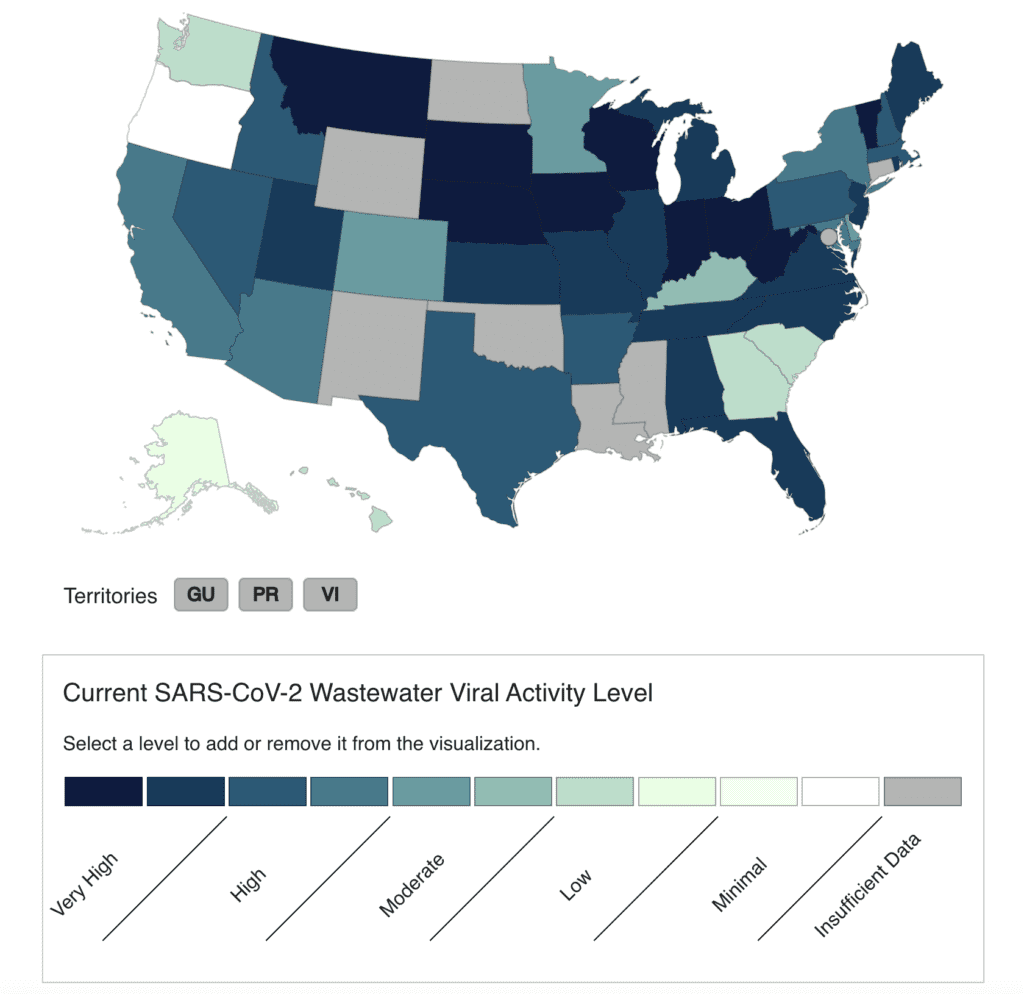
The Current Wastewater Viral Activity Map shows viral activity by state. As of 12/02/23, many states are reporting “very high” to “high” COVID levels with 5 states reporting low levels. Seven states reported no data.
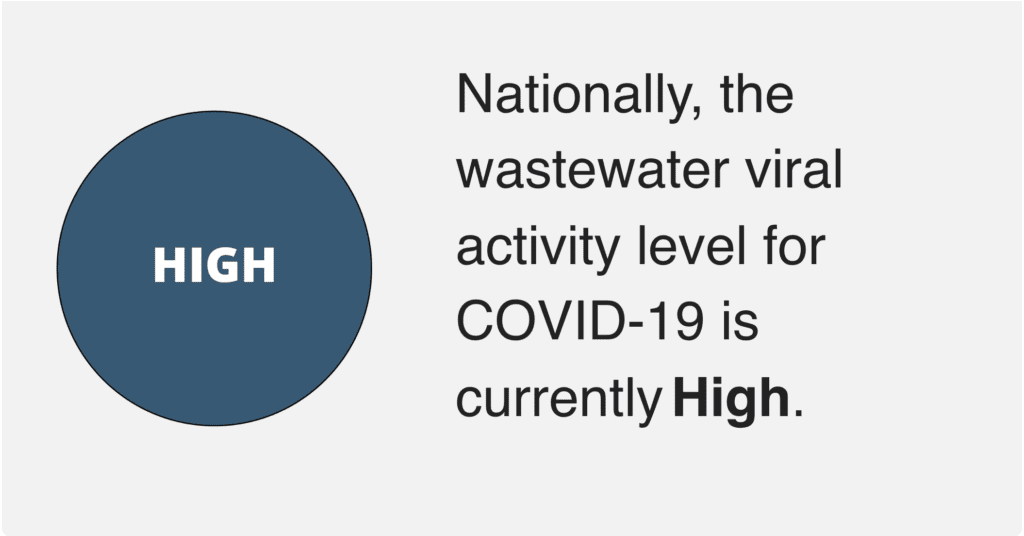
The CDC currently rates our nationally reported COVID wastewater viral activity levels as “high”.
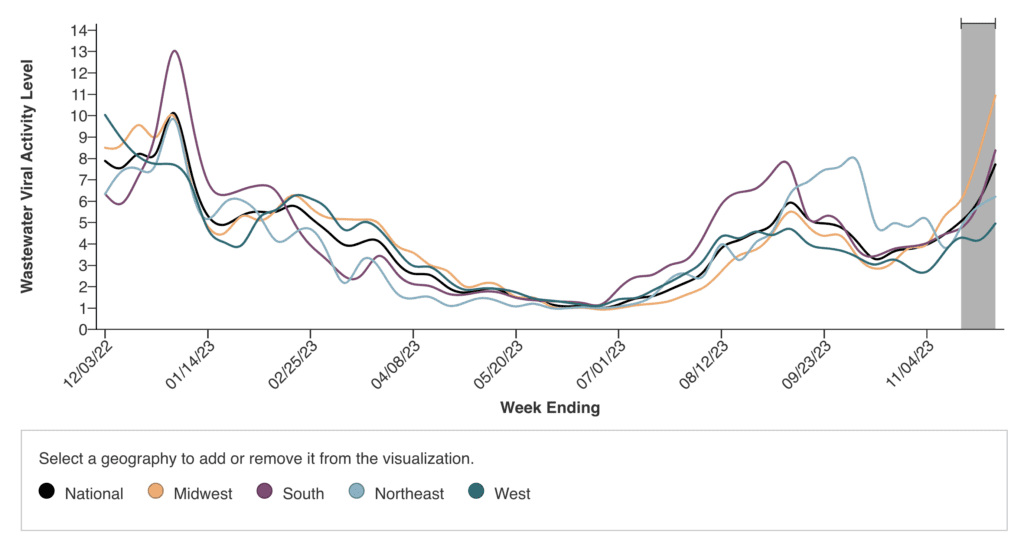
Levels are at an incline in all regions, but the Midwest takes a strong lead with a viral activity level of 10.94. This is a wastewater value that surpasses all readings for the Midwest in the past 2 years, and is the third highest of any reading since the onset of the Omicron variant in January of 2022 where we saw the highest levels of spread we have experienced in the entirety of the pandemic. Current Midwestern wastewater levels were surpassed only by a viral activity level of 13.02 in the South on 12/31/2022 and of 11.79 in the West on 07/02/2023.
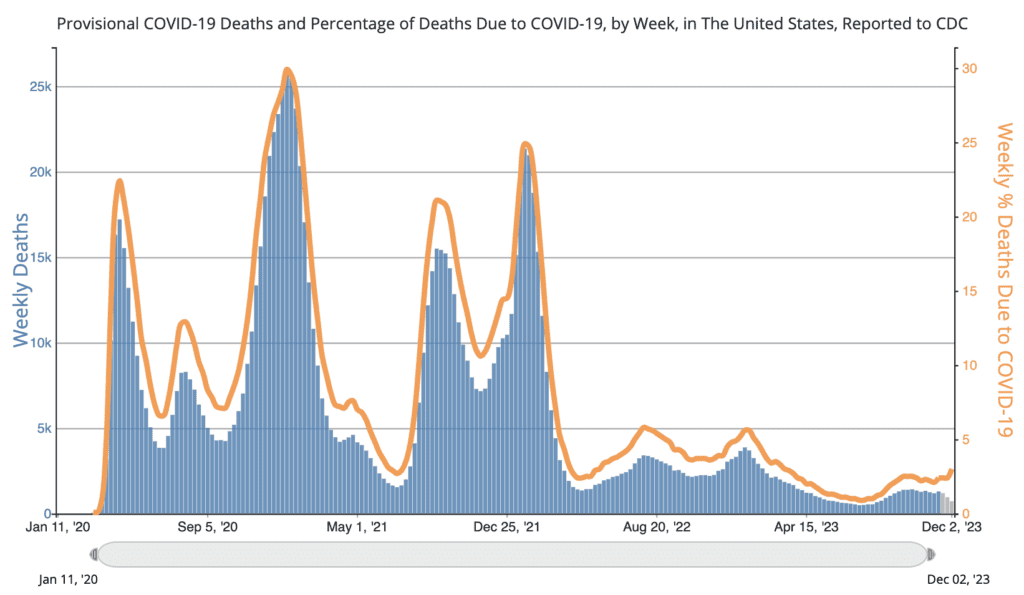
As with Biobot data, the most recent two weeks (indicated by gray shading on the graph) are subject to change due to reporting delays.
As we enter the cold and flu season when many in-person gatherings are held, we encourage you to continue monitoring local reports for a more accurate measure of levels. Also, please continue to use and support others in using layers of protection. And as we continue to report on advocacy successes, remember that our actions and voices can enact change — this level of unchecked spread is unacceptable and we must demand better resources and protections from our policy makers!
Variants
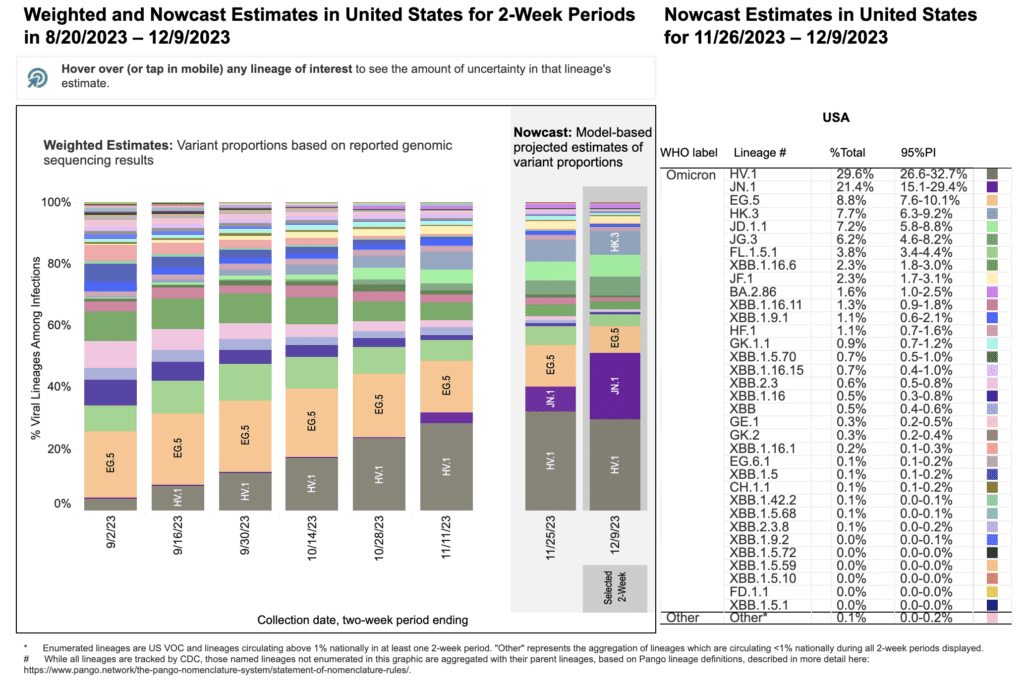
A new variant of Omicron, JN.1 has made the chart for the first time and is already the second most prevalent strain in the nation, taking credit for a whopping 21.4% of cases. Although the CDC reports that “it is not currently known whether JN.1 infection produces different symptoms from other variants,… the continued growth of JN.1 suggests that it is either more transmissible or better at evading our immune systems.”
Prevalence of JN.1 is second only to HV.1 which maintains its lead at 29.6% of total cases. The former are followed by EG.5 at 8.8% of cases and HK.3 and JD.1.1 at 7.7% and 7.2% respectively.
Deaths
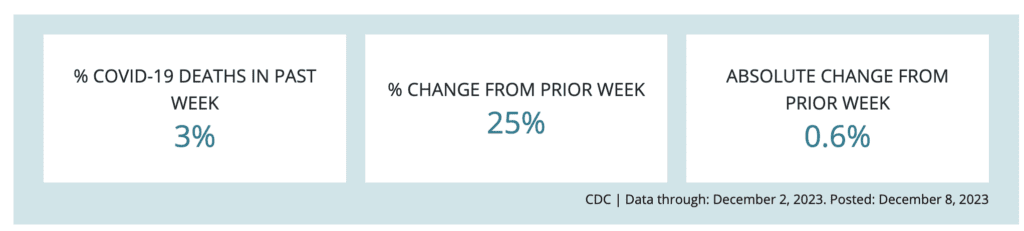
Percentage of total deaths in the US caused by COVID has risen 25% in the past week. Remember that these numbers are an undercount related to reporting delays in place since the Biden Administration ended the Public Health Emergency. Alarmingly, the current increase in deaths is large enough to show despite these changes.
COVID remains the third leading cause of death according to the CDC in the US. COVID is the highest single cause of death, only second to Heart Disease and Cancer which are both umbrella headings for more specific diseases. We mourn all those who have died due to COVID, and in that mourning, call you to take measures to prevent death and disablement for yourself, your loved ones, and your communities.
Ventilation and Air Filtration
Moving activities outdoors or ensuring your indoor setting has consistent fresh airflow is key to ensuring high quality ventilation. We recommend monitoring carbon dioxide levels and making adjustments as needed. Air filtration is important as well. If you’re looking for a HEPA air purifier or Corsi-Rosenthal Box for your family, it is important to get a filtration device that is powerful enough to change out the air for your particular room size. Clean Air Stars has created a free tool to calculate which filter could be right for you depending on the size of the rooms that you wish to clean and how many people will be attending your gathering.
Testing
Whether you are making the trip home or staying in one place this holiday season, with the current level of spread it is important to know your COVID status before engaging in social activity.
Rapid antigen tests are designed to be “the most rapid” at telling those who are symptomatic whether the symptoms they are experiencing are or are not caused by COVID. If you are asymptomatic, presymptomatic, or less than 5 days out from your COVID exposure, using one single rapid test is not an effective way of determining whether or not a person is currently infected with and contagious with COVID.
Persons using rapid antigen tests should take at least 2 rapid antigen tests 48 hours apart from one another and isolate in between, in order to avoid spreading their unconfirmed case as well as avoid exposure to COVID during this waiting period, which could produce a false test negative result. Persons who are experiencing COVID symptoms but test negative on an initial rapid antigen test also need to isolate themselves from others, assume they have COVID, and test again in 48 hours. Persons who are asymptomatic or pre-symptomatic who experience 2 negative serial tests must mask or isolate and wait a final 48 hours to test a third time in order to confirm a negative COVID case. For this reason, rapid antigen tests are only ideal to use in preparation for events where the user has a week prior available to test multiple times and isolate.
FDA approved home Nucleic Acid Amplification Tests or NAATs are a more sensitive home test option, some brands of which have been found to, with only one test, verify both positive and negative results at 92.9% and 98.7% respective accuracy. NAATs can be a more sensitive, quicker option to use in preparation for events.
Another more recent clinical trial found that performing a combined throat and nose sample increased sensitivity for healthcare worker and self-collected specimens. When testing at home with a rapid antigen test, it is worth it to take a combination sample like this one.
To ensure the most sensitive results for both symptomatic and asymptomatic cases, get a PCR test. No-cost PCR testing sites that are available via the federal ICATT program can be found via this search tool. Remember to also check for regional offerings such as NYC’s COVID express test centers that test for COVID, RSV, FLU A and FLU B free of cost with results typically returned by end of day, that could be a more convenient option for you. PCR testing is the gold standard if you are making plans to be in a social setting.
If you do not have fast free PCR testing in your area, demand that it be made publicly available by the government at all levels!
Wins

Grassroots organizing group and “Mask Blocs” continue to take to social media encouraging Pro-Palestine protesters to continue to wear masks in their organizing spaces and during protests highlighting historic use of unrestricted and eugenic viral spread as a weapon of occupation and colonization.
The National Institutes of Health’s Home Test to Treat program has upgraded its free test offerings and now instead of rapid antigen tests, will provide LUCIRA by Pfizer home NAAT tests can that effectively detect asymptomatic and pre-symptomatic COVID infections as well as Flu A and Flu B. Those who are uninsured or underinsured can sign up for this program to access free NAAT testing, telehealth services, and treatment medications for COVID and the Flu.
If your household has not placed a new order for more rapid tests from the federal government through covidtests.gov, you can still place an order for 4 free rapid antigen tests here.
Take Action
If you are out protesting this weekend or planning your trip home to visit family for the holidays, connect with your local COVID advocacy group to pick up high quality masks for yourself and to pass on to those around you.
This Tuesday, December 12th, the director of the CDC and the American Medical Association are hosting a virtual fireside chat to discuss Fall & Winter Respiratory Virus Season (prior registration required). We encourage you to attend. You might ask the CDC why they aren’t ensuring precautions in healthcare settings? Or you could ask why they’re relying on a reactive, vaccine-only approach instead of layers of protection to proactively prevent COVID?
Notes: 1) The numbers in this report were current as of 12/9/2023. 2) Changes in testing access as well as data reporting have led many federal data sources to become less reliable. 3) Check out the links throughout & see our website for more! https://bej.gbh.mybluehost.me