
The Weather
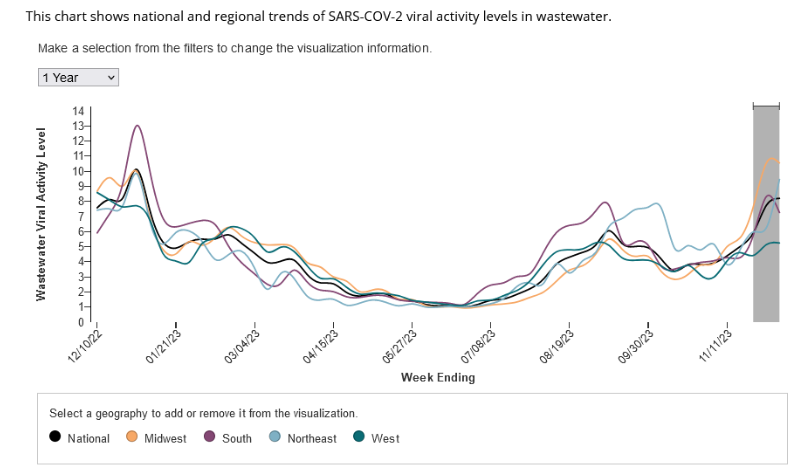
The CDC has finally released its own wastewater dashboard with state-level and regional trends. After public pressure to expand wastewater surveillance in September, including from all of us, it’s great to see some progress.
The CDC’s National Wastewater Surveillance System (NWSS) landing page now includes dashboards to check national wastewater viral activity for COVID and Mpox. Additional dashboards for National and Regional trends, State and Territory trends, a wastewater viral activity map, and variants in wastewater are available.
As we enter another holiday season with increased travel compared to 2022, we urge you to prioritize safety for any in-person gatherings you join to prevent the spread of COVID.
In December 2022, we launched our Safer Gatherings Toolkit with two goals:
(1) to dispel mainstream narratives that minimize and normalize COVID transmission;
and
(2) to provide information about how to gather in-person more safely during an ongoing pandemic.
A year later, we plan to release a revised Safer Gatherings Toolkit. Incorporating new research and informed by many of the pandemic’s trends we’ve tracked in our weekly Weather Reports, this toolkit approaches COVID precautions with appreciation and consideration for social connection, solidarity, and accessibility.
As you consider what events you attend this month, we challenge you to implement as many COVID transmission mitigation strategies as possible. The preventative steps we take during these next few weeks can reduce COVID transmission risks- keeping both you and the people around you safer and more protected from the spread of COVID and other airborne pathogens.
Even if you just arrived in a new city for a visit with family or friends, it’s not too late to re-think how you can gather more safely with the practical guidelines outlined in the toolkit.
Regardless of where you spend the holidays, take a moment to locate the testing and treatment options available to you in your city/county. If you are uninsured or underinsured and test positive for COVID, registering with Home Test 2 Treat could connect you with free telehealth services and COVID rapid tests.
Hospitalizations
Weekly COVID hospitalizations are trending upward for another consecutive week as reported by the CDC’s COVID data tracker reporting 23,432 new hospital admissions for the week ending December 9, 2023. Midwestern states are seeing some of the United States’ highest rates of hospitalizations.
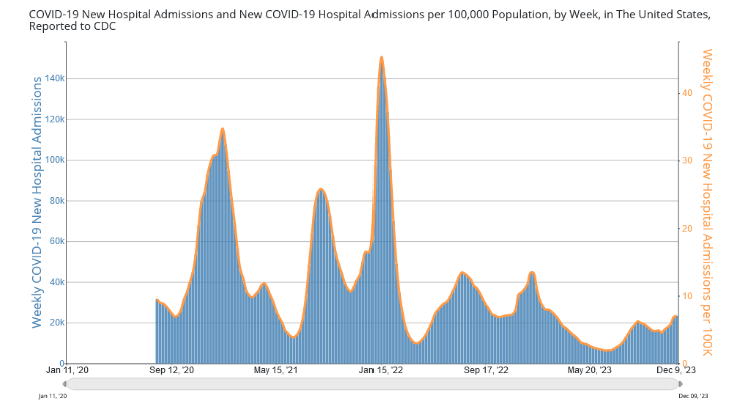
CDC reports that hospitals and emergency departments will face significant strain due to the substantial rise and transmission of infectious diseases during this period. Contributing to these trends are also low overall vaccination rates for both COVID and the Flu.
Long COVID
Recent commentary published in JAMA reviewed two studies that showed small effects of antivirals on preventing Long COVID, ultimately concluding that avoiding infection remains the most effective approach in prevention.
Another study recently published in The Lancet Infectious Diseases reported that Long COVID is much worse than outcomes after initial recovery from the flu, demonstrating a 50% increase in death for Long COVID compared to the Flu and organ-specific morbidity was worse after COVID and greater disability.
Wins
Last week we shared about the COVID Testing Supply Program for local educational agencies (LEAs), the Biden Administration’s newly launched distribution plan of free COVID tests to schools all across the country. The program’s Registration Form is now live for school districts to submit through their designated Point of Contact. We hope that school district administrators communicate their plans for distributing their share of rapid tests soon and that the federal government remains responsive to feedback about the program.
Testing is only one factor in preventing the spread of COVID and we will continue to push for the infrastructural changes like improved air sanitation that students and school staff are entitled to.
If your household still has not placed a new order for more rapid tests from the federal government through covidtests.gov since November 20th, you can still place an order for 4 free rapid COVID tests via the USPS service.
A local advocacy group in Chicagoland was able to persuade their state department of health to issue recommendations urging universal masking in healthcare settings.
Take Action
We urge you to continue to demand that the CDC Director Mandy Cohen reject HICPAC’s (Healthcare Infection Control Practice Advisory Committee) Guideline for Isolation Precautions: Preventing Transmission of Infectious Agents in Healthcare Settings. A recent Kaiser Family Foundation Health News article discusses this issue further.
We join Disability Justice advocates and scholars in expressing concern about expected changes to the disability-related questions posed in their 2025 ‘American Community Survey.’ Census Bureau which will result in an overall decrease in the number of Disabled and Chronically Ill people likely to be counted according to their own testing in 2022.
We are still in a pandemic and moves to hide and further erase the most vulnerable among us will only contribute to the revisionist and eugenicist policy choices perpetuated against us by the State. Leave a Public Comment by Tuesday, December 19th 11:59 PM EST demanding the Census Bureau to reject these changes.
Notes: 1) The numbers in this report were current as of 12/15/2023. 2) Changes in testing access as well as data reporting have led many federal data sources to become less reliable. 3) Check out the links throughout & see our website for more! https://bej.gbh.mybluehost.me