
The Weather
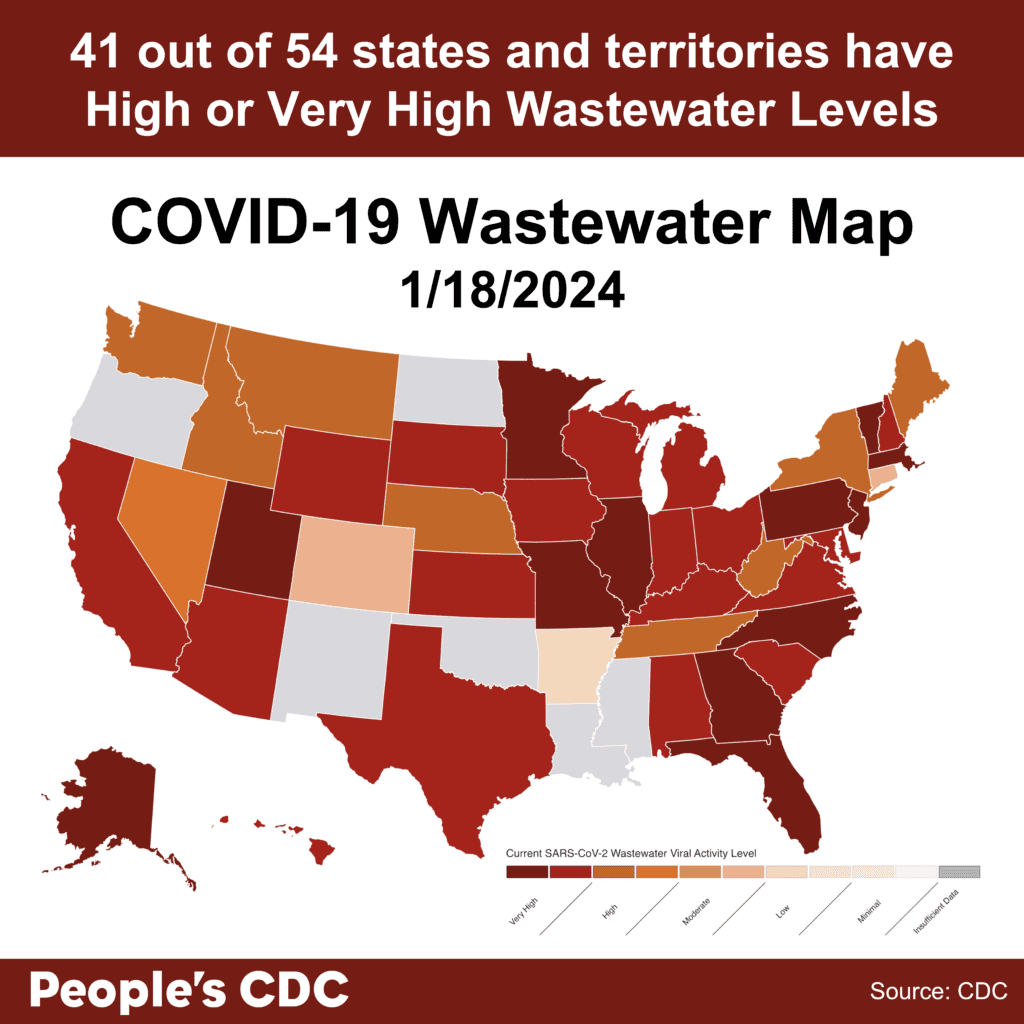
In the US, 41 out of 54 states and territories are at high or very high COVID wastewater levels as of 1/18/2024. Ten states and territories have no data available. It’s important to note that levels of “moderate,” “low,” or “minimal” do not necessarily indicate a low risk of COVID exposure in our daily lives. Viral spread is still ongoing even if at lower levels, and precautions are warranted to protect ourselves and others.
Looking at the CDC’s national and regional wastewater data over time, we continue to see “Very High” levels nationally. It’s important to note that the last two weeks are provisional data, indicated by a gray shaded area on the graph, meaning that those values can change as additional wastewater sites report data.
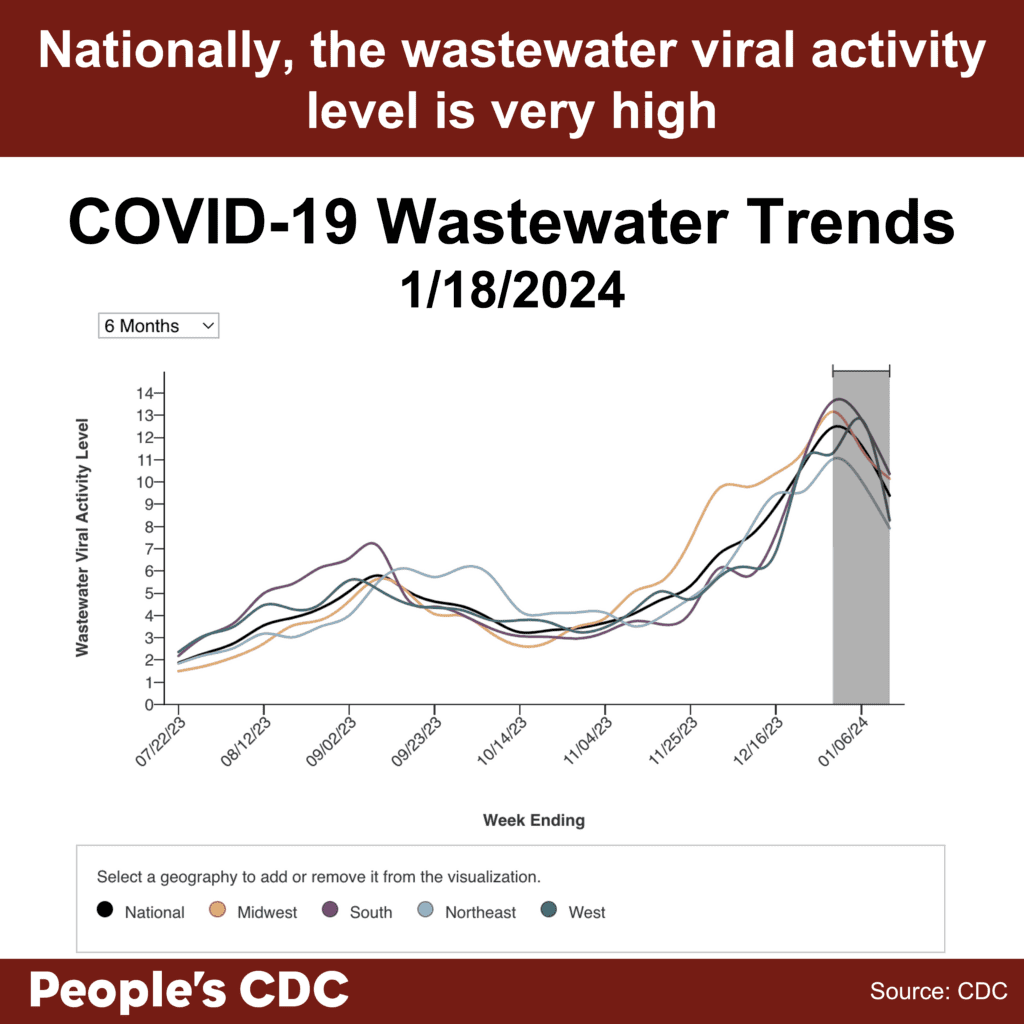
Although wastewater data does not provide the same level of detail as previous PCR-based testing data, wastewater monitoring is an important ongoing resource to inform us about the current COVID situation. While the provisional data tentatively shows a downward trend this week, time will tell whether this is a true decrease in the final data. A downward trend does not mean continued decreases are guaranteed or that protections should be relaxed. Multilayered protections help drive COVID spread lower, and relaxing protections can lead to a resurgence of viral spread.
Visit the CDC’s State and Territory Trends page to see available wastewater testing near you, including the number of wastewater sites reporting. Write your elected officials to let them know you want to keep and expand wastewater testing in your area and nationally.
Wins
In November 2023, the CDC’s Healthcare Infection Control Practices Advisory Committee (HICPAC) passed a series of draft proposals that will further weaken already insufficient protocols employed within healthcare settings. HICPAC refuses to reckon with the airborne nature of infectious diseases such as SARS-CoV-2, and does not propose crucial measures such as universal masking with well-fitted respirators, isolation periods, and ventilation. The People’s CDC has penned a letter to the ACLU alerting them of HICPAC’s irresponsible decisions, and the ramifications associated with them. We hope that by working together with the ACLU, we can implement public advocacy and legal actions in order to tackle this critical issue.
You can read the full letter here.
Johns Hopkins reinstated healthcare masking on 1/12/2024, in response to high respiratory virus levels. As with many other healthcare systems and public health departments that have restored healthcare masking when facing public pressure, we hope that universal masking can become a standard of care rather than a short term response to a surge. See “Take Action” below for more information.
Variants
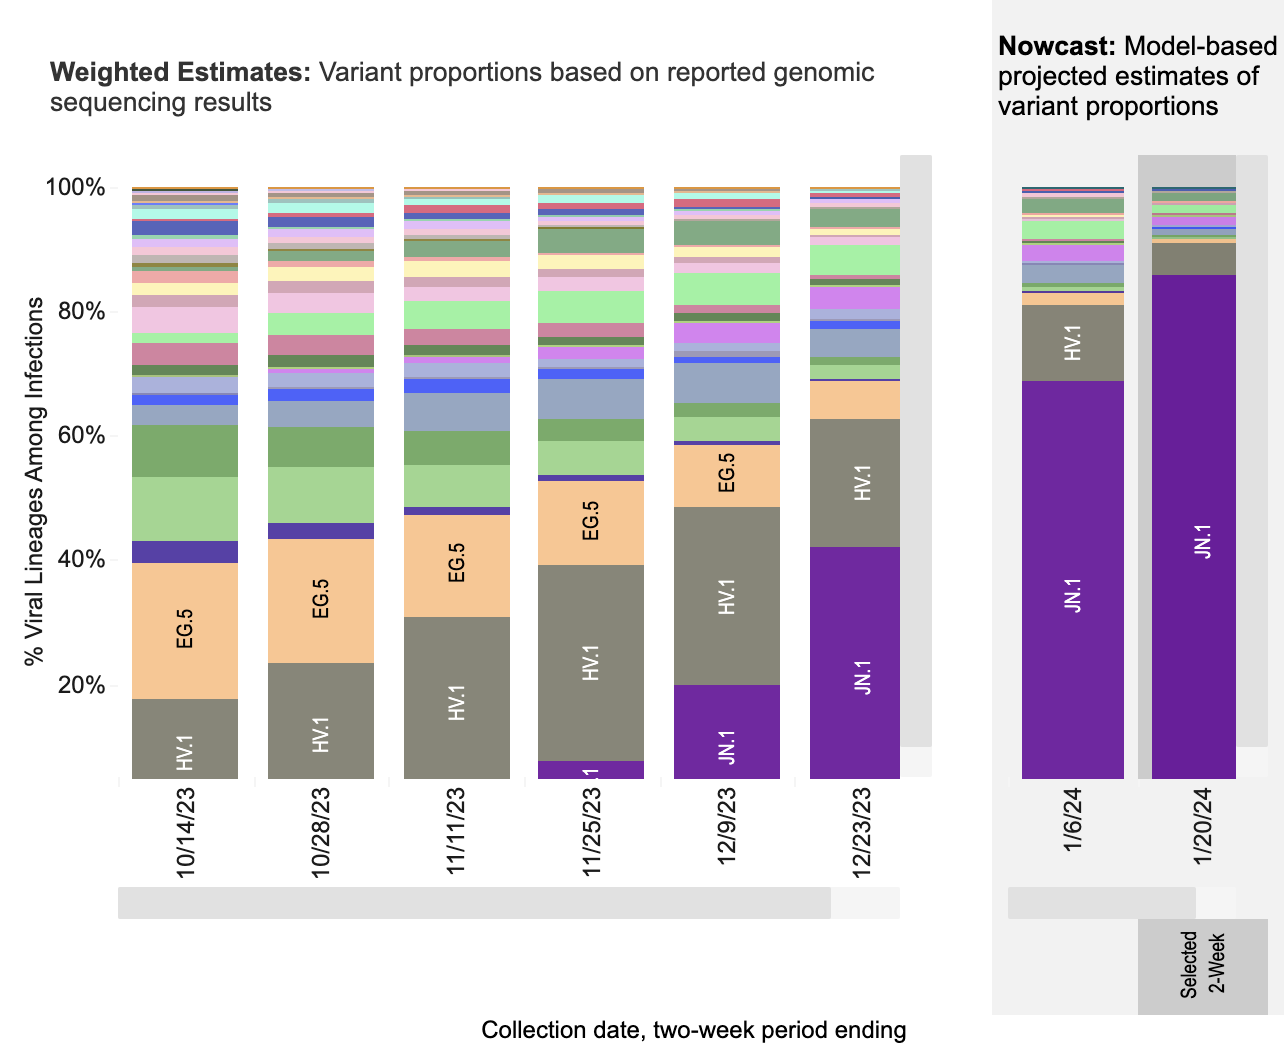
JN.1, now the most prominent variant in the United States, is estimated to account for 85.7% of circulating variants by 1/20/2024. HV.1 is expected to drop to 5.3%, and all other variants are estimated to make up less than 2% each. Although ongoing viral spread allows opportunities for new variants to emerge, the latest 2023-2024 COVID vaccine boosters, COVID tests, and COVID treatments are still expected to be effective for JN.1.
Current updated booster uptake is low (as of January 19, 2024, the CDC reports that only 21.5% of adults and 11% of children have received it). It is not too late to get the updated booster, and to protect yourself against the latest variant!
Hospitalizations
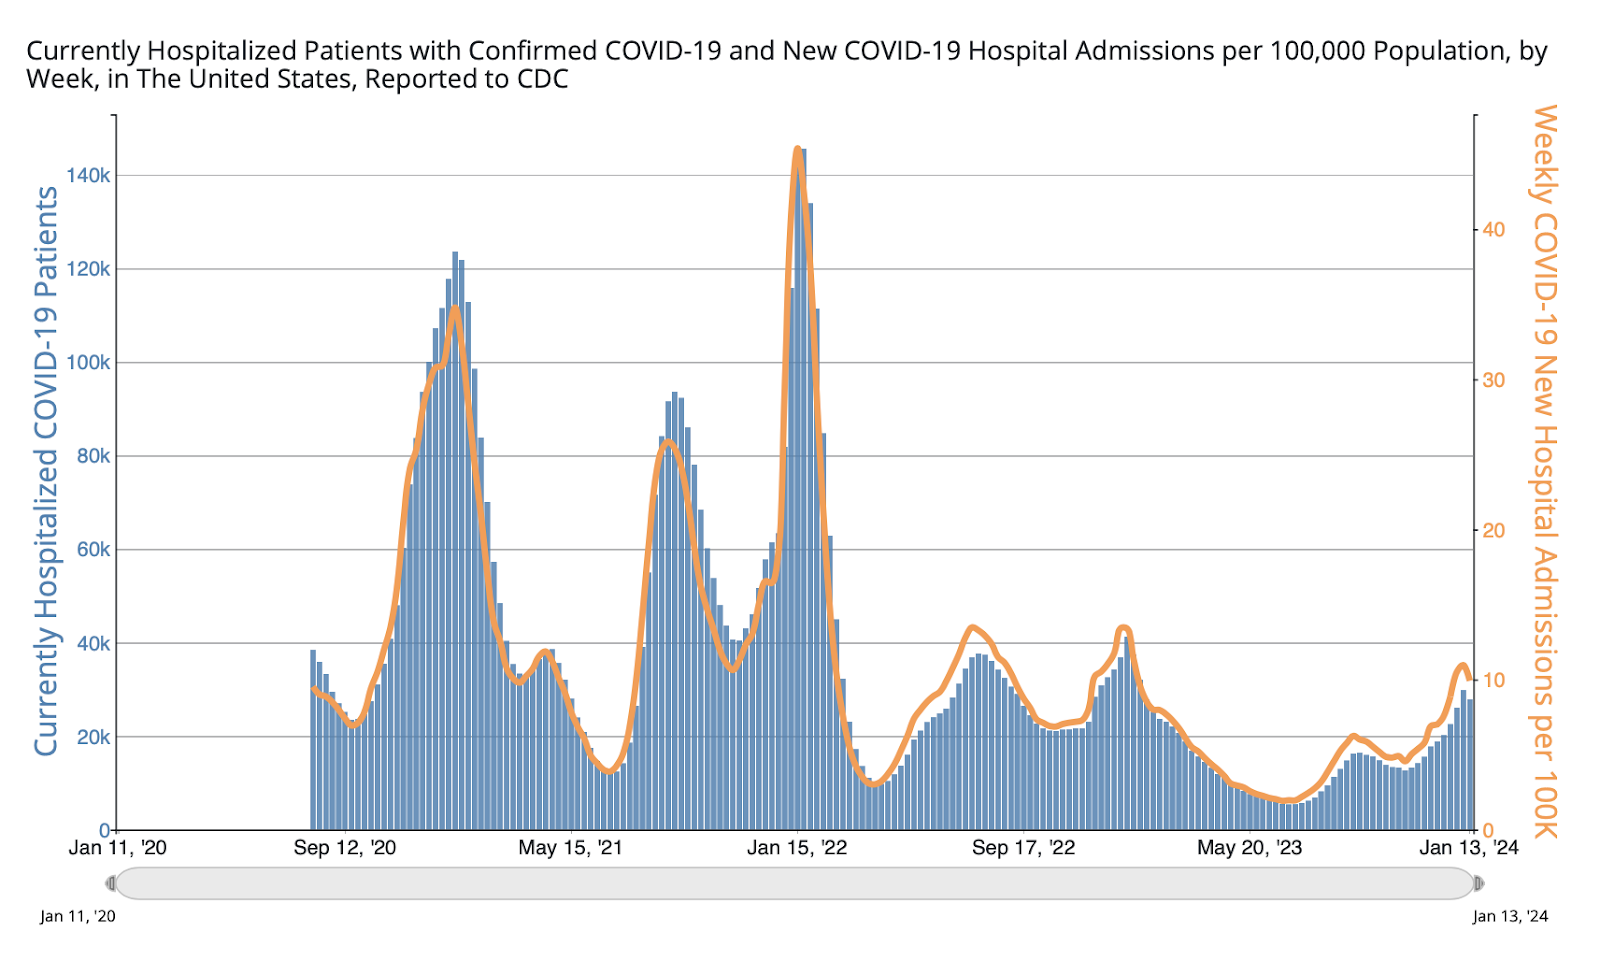
In the most recent week (ending January 13, 2024), we see a slight downward trend in new hospital admissions, currently at 32,861. We see a similar slight downtick in currently hospitalized patients with COVID , at 27,879. This most recent week shows a slight decrease in hospitalizations, although it is too soon to say whether hospitalizations for the current surge have passed their peak. Hospitals continue to be overwhelmed. The data also lacks information on hospital-acquired infections. We urge you to continue taking stringent precautions, such as donning a well-fitting respirator (e.g., N95, KN95) in all indoor spaces–and especially in healthcare settings.
Long COVID
Amid ongoing advocacy by Long COVID groups, the US Senate Committee on Health, Education, Labor, and Pensions (HELP) held a committee hearing on “Addressing Long COVID: Advancing Research and Improving Patient Care.” The hearing included testimony from three Long COVID patients and four Long COVID physicians and researchers, bringing much-needed attention to the urgent need for funding for Long COVID research and treatments, and to the need for improved access to care for Long COVID patients. We recognize the community care modeled by some of the panelists and attendees who wore masks for the hearing, and we wish the senators on the committee would mask up as well.
Take Action
Write your elected officials to let them know that Long COVID impacts all of us, and that we need ongoing support for Long COVID research and clinical care. Ask Senators to support bill S.2560, the Long COVID Support Act. Ask Representatives to support bills HR.1114 (Long COVID RECOVERY NOW Act) and HR.3258 (TREAT Long COVID Act).
Although some healthcare settings have reinstated masking in response to high COVID levels along with high respiratory virus activity, ongoing pressure is needed to restore, keep, and expand masking broadly. Use our letter template and toolkit to call or write your elected officials in support of healthcare masking.
Want to do more to support healthcare masking? Consider starting, sharing, or joining a local campaign. Check out work in Illinois, Maryland, and Wisconsin, just to name a few. Also, sign and share our letter to the ACLU asking them to join us in supporting safe and equitable access to healthcare. Sign on is open until 2/1/2024.
Notes: 1) The numbers in this report were current as of 1/19/2023. 2) Changes in testing access as well as data reporting have led many federal data sources to become less reliable. 3) Check out the links throughout & see our website for more! https://bej.gbh.mybluehost.me