
The Weather
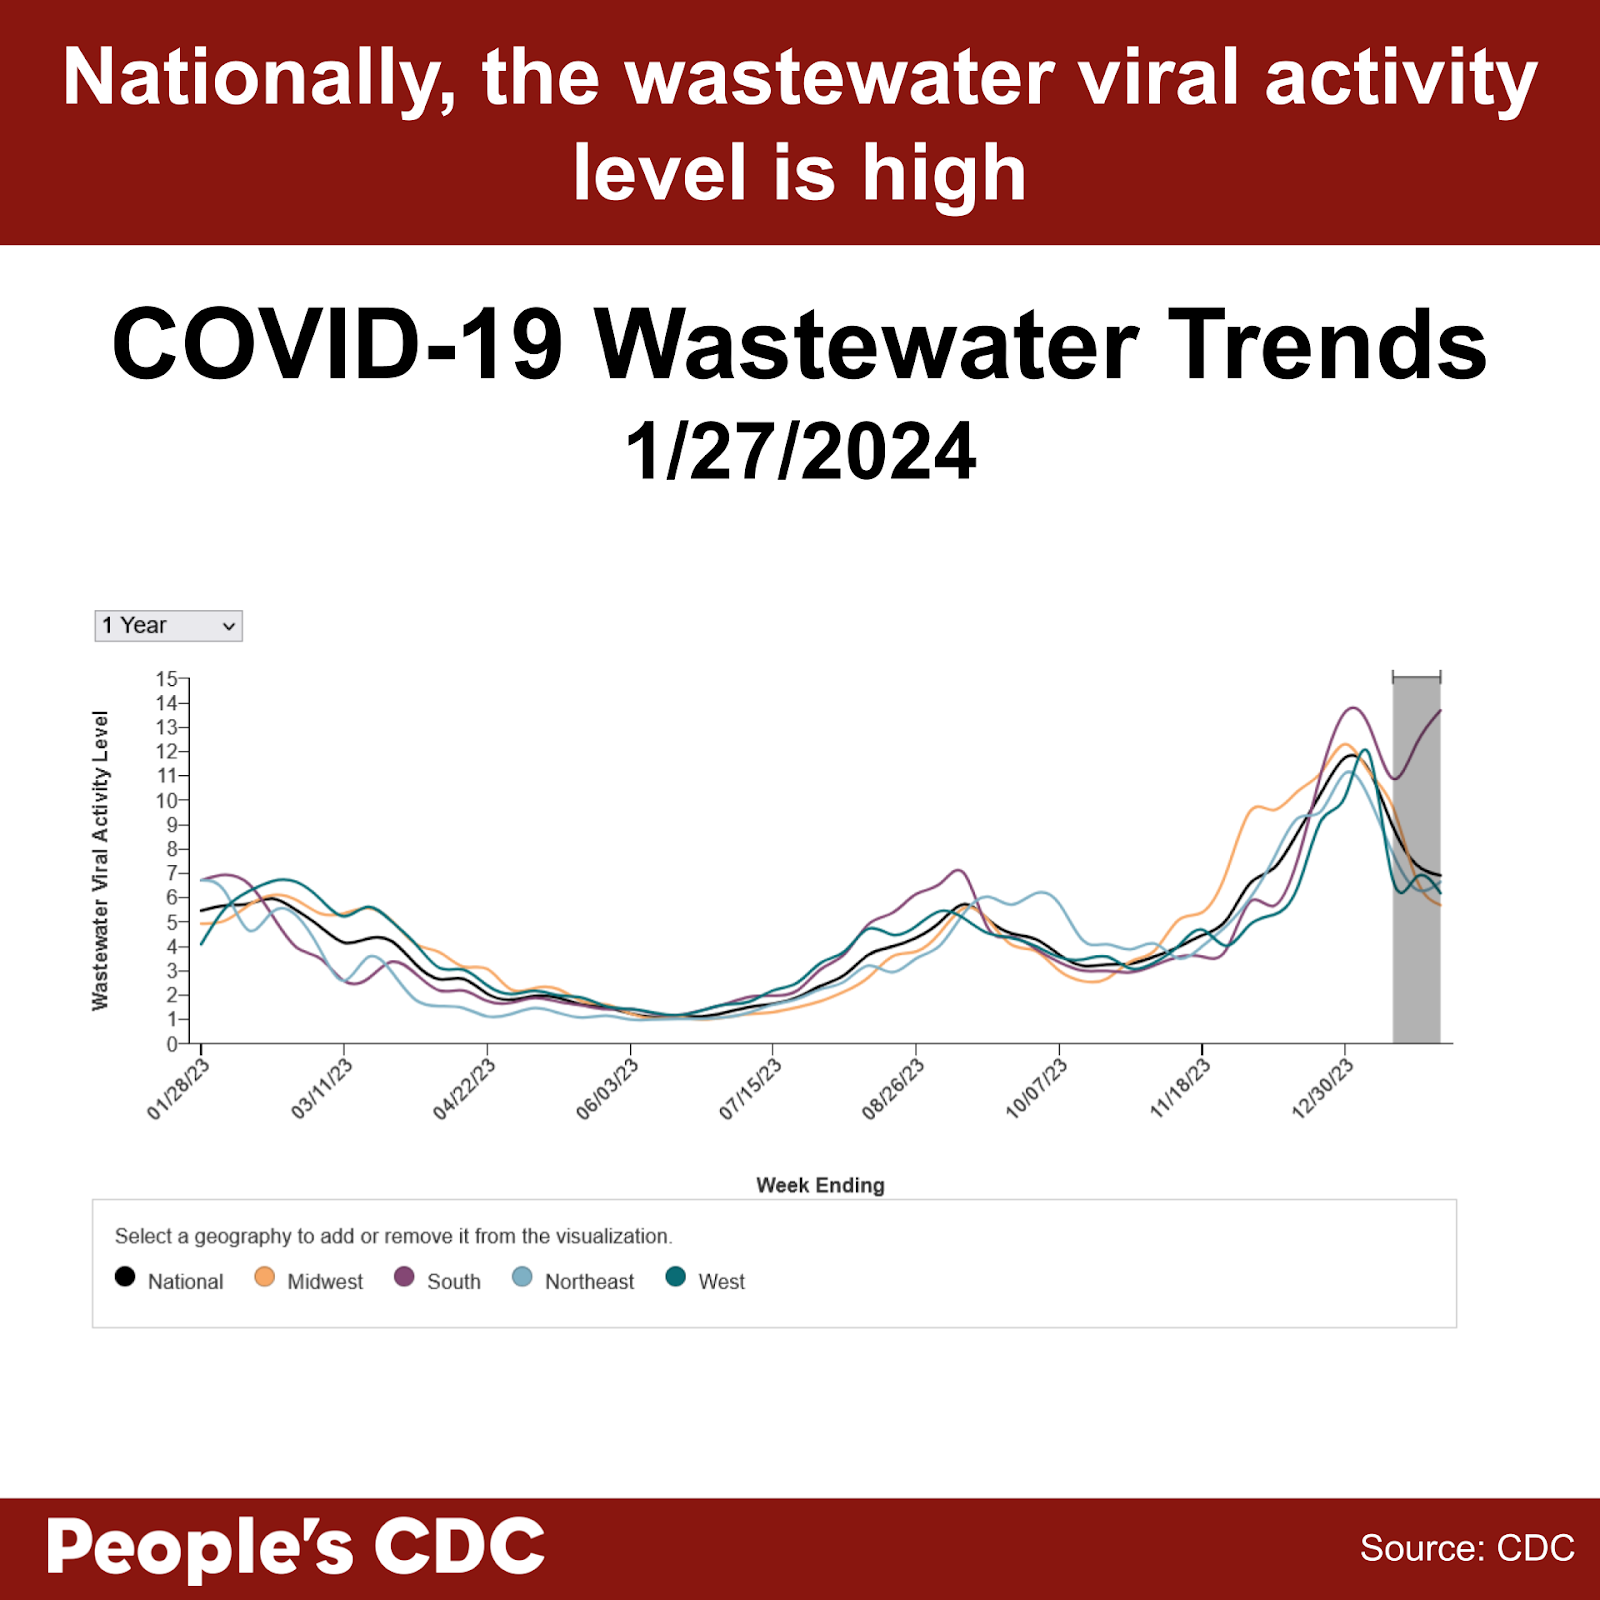
More than half of all US states remain at high to very high levels of SARS-CoV-2 detected in wastewater since January 25, 2024. As more people face reinfections, COVID remains a serious disease and we recommend that you continue to take precautions as the risk for infection is high at this time.

Although wastewater levels have dropped for multiple US regions, wastewater levels in the South have climbed higher than we’ve seen for any region this season and are currently the second highest peak we’ve experienced in the duration of the pandemic. This is a particularly concerning rebound as at the beginning of the year, Southern levels were experiencing a sharp decline. CDC’s national and regional wastewater data over time also show high levels nationally. As a reminder, the last two weeks are provisional data, indicated by a gray shaded area on the graph, therefore these values may change as additional wastewater sites report data. We want to remind you that multiple layers of precautions will protect against a COVID infection.
Wins
We thank many of you this week for joining us and in signing on with our letter to the ACLU regarding the actions taken by the CDC’s Healthcare Infection Control Practices Advisory Committee (HICPAC) that previously weakened already insufficient protocols employed within healthcare settings. We had many concerns with the actions taken by HICPAC. As a result of your actions, as well as support by many of our allies at previous HICPAC meetings, the CDC responded on January 23, 2024, with a request to consider clarification questions in distinguishing masks and N95 respirators. The CDC asked HICPAC to consider these questions prior to submission to the Federal Register for more public comment. This success demonstrates the importance of working together and holding the CDC accountable for ensuring safe healthcare settings for all patients and healthcare workers. You may also submit an additional comment or a reply to the CDC’s official response to HICPAC at the bottom of the news release.
As many healthcare systems and public health departments have restored masking in healthcare settings only when facing public pressure, without further action this important measure may not last. We ask you to support national and local groups to advocate for everyone’s safety in maintaining universal masking in all healthcare and healthcare-like settings. Universal masking can become a standard of preventative care rather than a short term response to infectious disease already surging.
Variants
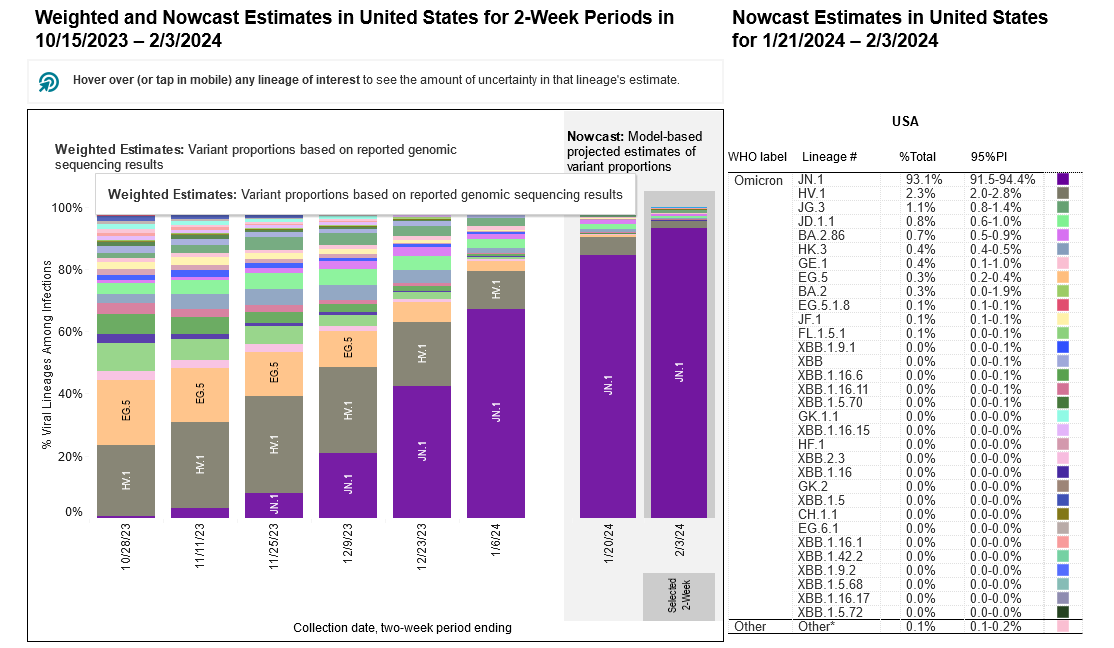
JN.1 remains the dominant variant in the United States, and is approximately 93.1% of circulating variants as of 2/3/2024. HV.1 drops even further to 2.3%, and all other variants are estimated to make up less than 2% each. The updated 2023-2024 COVID vaccines updated with the XBB.1.5 variant were recently shown by a MMWR report to be at least 49% to 60% effective against symptomatic infections during the Fall season, from late September 2023 to mid-January 2024. By ensuring additional precautions including testing, masking, ventilation, and air filtration, the additive effect will ensure a higher effectiveness.
Vaccine uptake remains limited with only 21.8% of adults and 11.6% of children receiving the updated COVID vaccine as of 2/02/24. The Bridge Program remains available for those underinsured or without insurance for no-cost access to these vaccines.
Hospitalizations
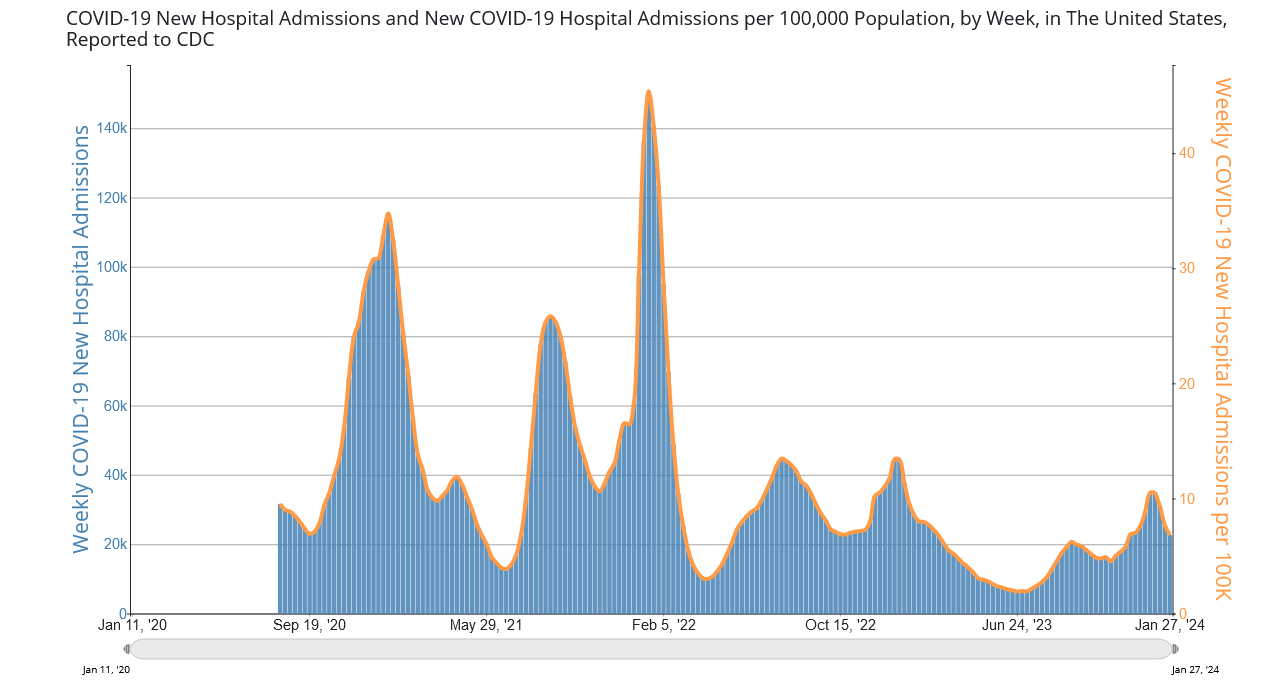
A downward trend continues with new hospital admissions, currently at 22,636 the week of January 27, 2024. We still do not know the total number of hospital-acquired infections, since reporting over these numbers was halted in May of 2023. Despite this decrease in new hospital admissions, please consider that wastewater levels are still high nationwide, and that hospitalization does not reflect the current amount of circulating virus. Please continue to exercise caution and wear a well-fitting respirator indoors.
Testing and Treatment
A study published in Clinical Infectious Diseases (CID) found that SARS-CoV-2 viral load peaks around the fourth day of symptom onset. This may suggest why tests do not seem to be picking up positive cases early on. This does not mean that transmission is unlikely prior to the fourth day of symptoms, but rather, one should continue to employ serial testing and isolation measures beyond the first few days of illness. If you have tested negative on day one or two with a rapid antigen test (RAT), you may still have a COVID infection, unless you test negative on day four or five with a RAT.
Because of a lack of RAT sensitivity, people may mistakenly believe they do not have COVID, and both enter isolation too late and exit isolation prematurely, leading to increased transmission within the population. For this reason, it is important to wear a high quality respirator at the onset of COVID-like symptoms, regardless of a negative test. We must demand for more sensitive testing and no-cost access to better tests (such as PCR), as well as an infrastructure that allows for longer sick leave and sick-time pay. At this time, limited testing options remain at no cost including the Test to Treat program and Walgreens PCR program as well as treatment options including the no cost antiviral program operated by Pfizer and supported by Health and Human Services. Remember to check for regional offerings as well such as the “Express Testing” PCR program in New York City, which could be more accessible to you.
Vaccines
On February 1, the CDC published in its Morbidity and Mortality Weekly Report (MMWR) that the most recently updated monovalent XBB.1.5 booster offered 54% increased protection against symptomatic (self-reported) COVID. Note, the study was limited as it did not evaluate the effectiveness against asymptomatic COVID cases. The CDC recommends that all individuals older than 6 months of age should receive the updated vaccine. If you have not yet received your vaccine, please do so.
Current updated vaccines being somewhat effective against symptomatic acute infection is not enough, and we should demand for sterilizing immunity of COVID through vaccines. Intranasal vaccines, which may induce a more robust mucosal immunity based on animal models, seem to be in the pipeline. However, it is unclear whether production of such vaccines is receiving appropriate funding or will be available to the public anytime soon.
The CDC Advisory Committee on Immunization Practices (ACIP) is having a meeting on February 28-29th and COVID vaccines will be on the agenda. We will be sending information on a request for actions in the coming few weeks on how to participate in ensuring the CDC takes appropriate steps to protect the public from ongoing COVID infections.
Take Action
Further research and investment is needed for effective treatments against Long COVID. PCORI, the Patient-Centered Outcomes Research Institute, is seeking individuals to represent patient voices on their advisory panels. This is an invaluable opportunity to advocate for Long COVID research as this research and funding organization has an annual budget of nearly 300 million dollars for medical research. Applications are due March 29, 2024 and those selected to be on their advisory panels can participate virtually. Lending your voice to this is invaluable.
We must also ensure constant access to no or low cost high quality masks and respirators. Request that the federal government ensure that there remains ongoing local manufacturing of high quality masks and N95 respirators to prevent a future shortage by contacting your representatives.
Many people rely on pulse oximeters in healthcare and at-home settings as a medical device to check blood-oxygen levels during an active COVID infection and recovery. For several decades, it has been established that these medical devices have failed to measure accurately when used with darker skin color. In response, a recent lawsuit has been filed against 12 manufacturers. In addition, the FDA is currently seeking comments through the Federal Register on this matter. We ask you to submit a public comment asking the FDA to act immediately and ensure future pulse oximeters are properly manufactured to support all people.
Notes: 1) The numbers in this report were current as of 2/2/2024. 2) Changes in testing access as well as data reporting have led many federal data sources to become less reliable. 3) Check out the links throughout & see our website for more! https://bej.gbh.mybluehost.me. 4) Subscribe to our newsletter: People’s CDC | Substack.