El clima
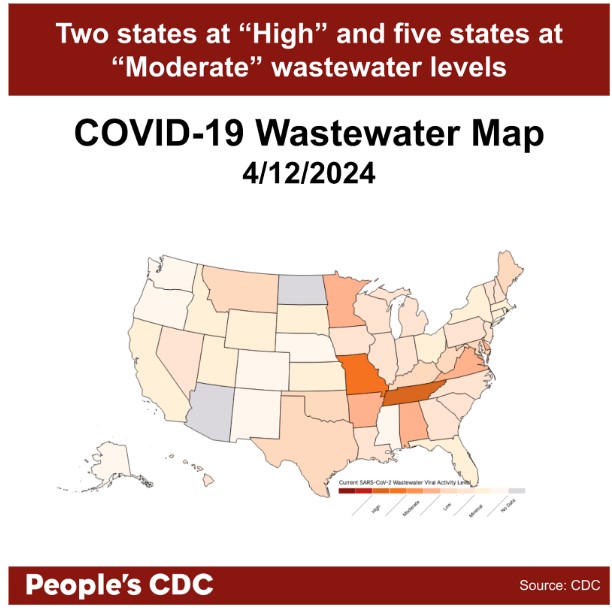
Similar to this time last year, COVID wastewater levels in many states have decreased and now remain at low levels except for the states of Tennessee and Missouri, which are at high levels. Arkansas, Alabama, Delaware, Minnesota, and Virginia have moderate viral levels detected by wastewater surveillance. This reminds us that it is important to continue the practice of precautions, especially among those most vulnerable to a COVID infection.
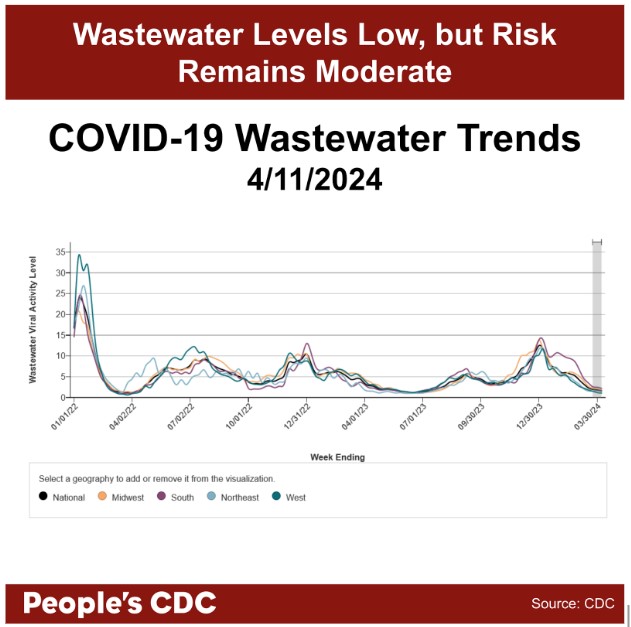
When considering trends in wastewater levels across all four regions, they have stopped decreasing as seen in the provisional data (gray shaded area). The national wastewater levels are indicated as “Low.” While lower wastewater levels indicate decreased spread, the risk for infection remains moderate especially as current wastewater levels remain slightly higher than previous low periods.
Wins
During the past few weeks, we have taken several actions against removing vital public health measures, especially the change in COVID isolation guidelines. This included the People’s CDC press conference from March 13, a recording and our press release are available. We also have a pre-proof of the People’s CDC External Review in the American Journal of Preventive Medicine Focus that additionally highlights the shortcomings of the CDC’s approach to public health and recommends a more equitable pandemic response. This week, we have assembled an expert letter asking the CDC to correct their COVID isolation guidelines.
Community groups continue to show us that it is possible to push back against corporate efforts to further privatize healthcare – and win. In Massachusetts, the Boston Center for Independent Living and SEIU 1199 led a successful drive to prevent cuts to publicly funded personal care attendants (PCAs) for disabled people. When we fight, we win.
Variants
Currently, JN.1 remains the dominant variant in the US, and is 83.7% of circulating variants as of 4/13/2024, down from 88.5% on 2/3/2024. JN.1.13 has increased to 9.1%, up from 0.7% on 2/3/2024. Other variants comprise 7.2% of the remaining total. A estudio reciente, published in The Lancet Infectious Diseases, provided additional information on recent COVID variants that shed higher levels of wastewater; however, this cannot discount that COVID transmission remains at higher risk during rises in wastewater levels.
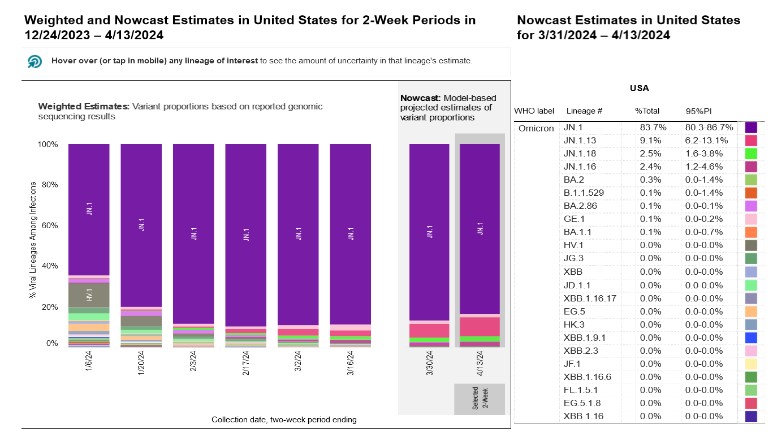
Graphic source: CDC Variant Tracker
Hospitalizaciones
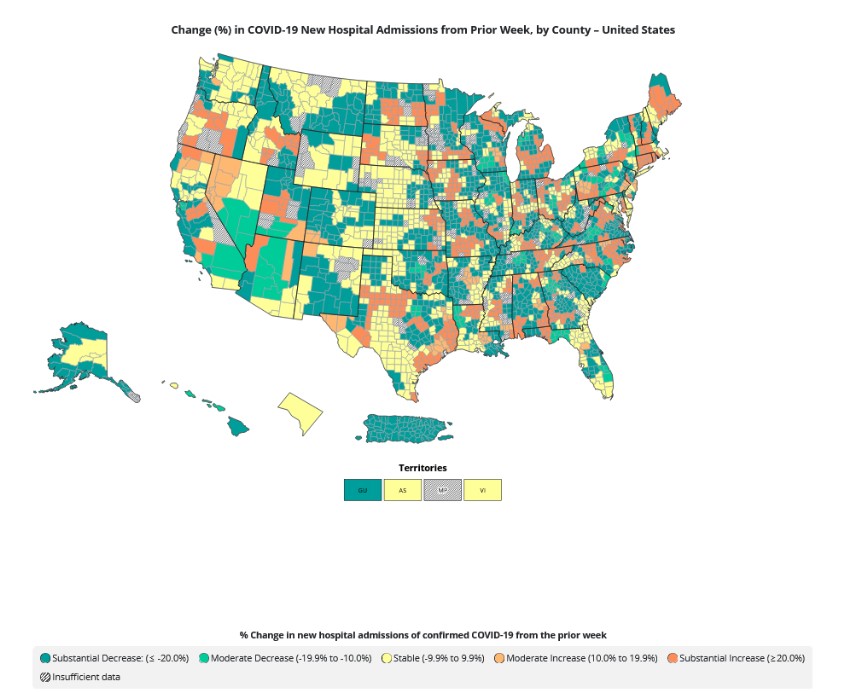
Total new hospital admissions caused by COVID have decreased to 7,318 during the week of April 6, 2024. Although the number of new hospital admissions are lower than the past, many counties in the US continue to experience increases in new hospital admissions. Over 25% of all counties are experiencing an increase in new COVID hospital admissions between the last week of March 2024 and the first week of April 2024. Most concerning, we still do not know the total number of hospital-acquired infections, since reporting over these numbers halted in May 2023. Despite this decrease in new hospital admissions and wastewater levels are currently at low levels nationwide, total hospitalizations do not completely reflect the current amount of circulating virus.
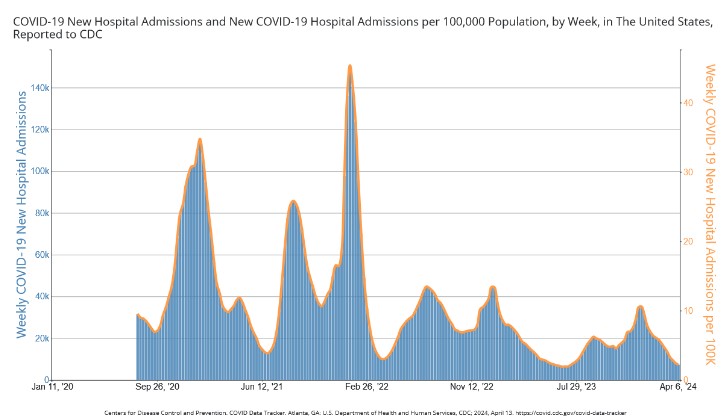
Graphic source: CDC COVID Data Tracker
Prevention and Precautions
The CDC recently released guidelines to improve ventilation and implementation of air purification to prevent the spread of infectious diseases, specifically airborne pathogens. A group of scientists have also jointly published a policy statement in the academic journal Science supporting the establishment of higher standards for ventilation and the importance of air purification in indoor settings. Two studies published in the last month have validated the significance and value of both ventilation and air purification in schools y childcare centers to prevent the spread of COVID.
Vaccine uptake remains limited. Only 22.8% of adults and 14.1% of children have received the updated COVID vaccine as of 4/11/2024 – a slight increase from 21.1% of adults and 12.8% of children on 3/10/2024. The Bridge Program remains available for those underinsured or without insurance for no-cost access to these vaccines, but may end December 31, 2024.
COVID largo
Senator Bernie Sanders, as chair of the Senate Health, Education, Labor, and Pension Committee, proposed draft legislation to address Long COVID. This proposal aims to allocate $1 billion annually for a decade to the NIH for Long COVID research, establish a centralized research entity and advisory board, create a rapid grant process for clinical trials, develop a patient data database, and enhance public education on Long COVID. We ask that you share your thoughts to their official contact by email specifically on allocating funding for effective treatments and specific measures in the prevention of Long COVID by April 23, 2024. Currently, Long COVID Alliance has compiled a list of active opportunities in studies and clinical trials that people with Long COVID may participate in, which may help the clinical community contribute knowledge of Long COVID and potentially support the development of effective treatments.
Tomar acción
An invaluable home-based program that supports testing, evaluation, and treatment for COVID, Test to Treat program, is ending on April 16, 2024. Send a letter to your local representatives to ask them to help save the program that helps so many at-risk people! It’s been over a month since the CDC released new, irresponsible guidelines on COVID isolation which are not substantiated by scientific evidence. Our fight to take public health out of the hands of corporate interests and protect our collective well-being continues. As part of our strategy to push back, we’ve put together an expert letter to CDC Director Mandy Cohen telling her to reinstate science-based COVID isolation guidelines. We urge the CDC to consider the highly variable length of infectiousness in their recommendations and to adopt a test-based approach for ending isolation. This letter is for public health professionals, scientists, healthcare workers, disability advocates, and others who consider themselves experts in public health. Sign this letter asking the CDC to correct their updated COVID isolation guidelines.
Avian Flu (Awareness Update)
The People’s CDC is monitoring Avian Influenza (AKA “Bird Flu”) as it has been spreading in many avian and mammalian species around the world at alarming rates. The current strain of concern is subtype H5N1 clade 2.3.4.4b and is highly pathogenic in poultry, causing systemic infections and rapid onset of illness and death among avian species (1). As such, this is called a highly pathogenic avian influenza (HPAI). This specific clade emerged in 2020 and has now been detected on every continent (2,3,4, 5). Over 500 species of birds and 360 species of other animals have been infected worldwide. Hundreds of thousands of wild animals have died from avian influenza since its emergence in 2020 (1, 6). Here in the U.S., at least 28 outbreaks have occurred in cattle farms (6, 7).
While human cases remain low, case fatality in humans has historically been around 50% (6). The outbreak among many non-bird animals is alarming and allows for opportunities for viral mutations that may lead to further infections among humans (1,6). The ecological consequences of such mass death around the world are currently unknown but guaranteed to be devastating as food webs are severely disrupted and conservation efforts suffer (1, 5). Humans are already feeling the direct impact of this as farmers are forced to cull entire flocks of poultry to control the spread, which may result in increased prices in the food supply (6). Humans will probably continue to feel the impacts of this historic spread, regardless of the number of human cases. We will continue to monitor the situation and share updates as the situation develops.
Notes: 1) The numbers in this report were current as of 4/12/2024. 2) Changes in testing access as well as data reporting have led many federal data sources to become less reliable. 3) Check out the links throughout & see our website for more! https://bej.gbh.mybluehost.me. 4) Subscribe to our newsletter: People’s CDC | Substack.