
Week of May 30, 2022
The Current Situation – “The Weather”:
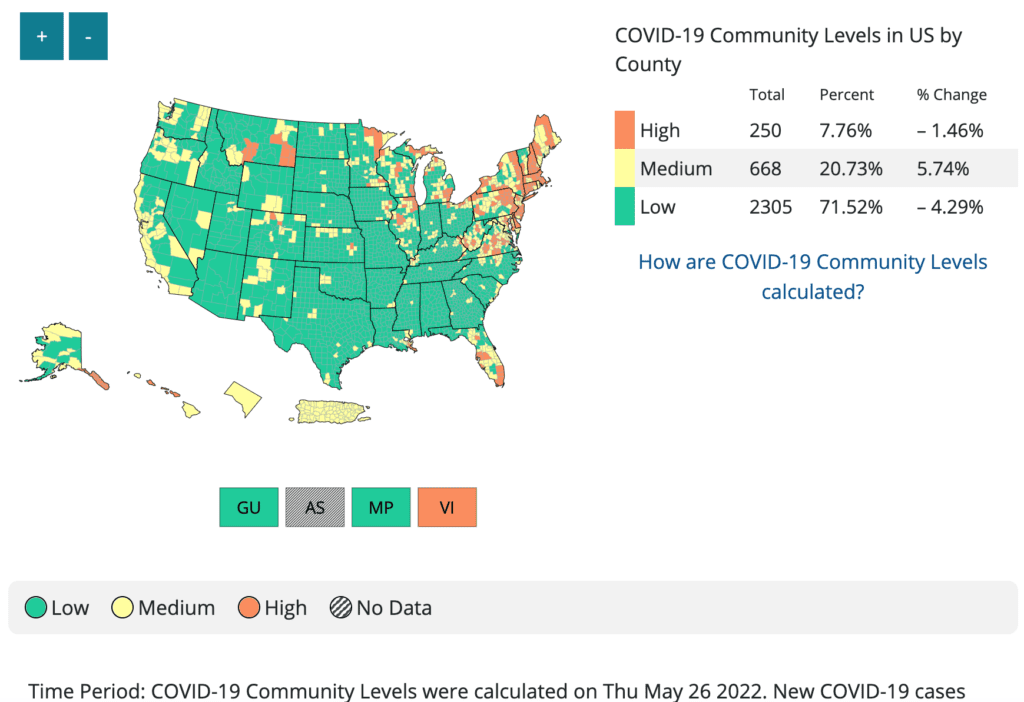
The U.S. is clearly in a surge; while cases are underreported, the CDC’s delayed “community level” maps are starting to turn red across the nation.
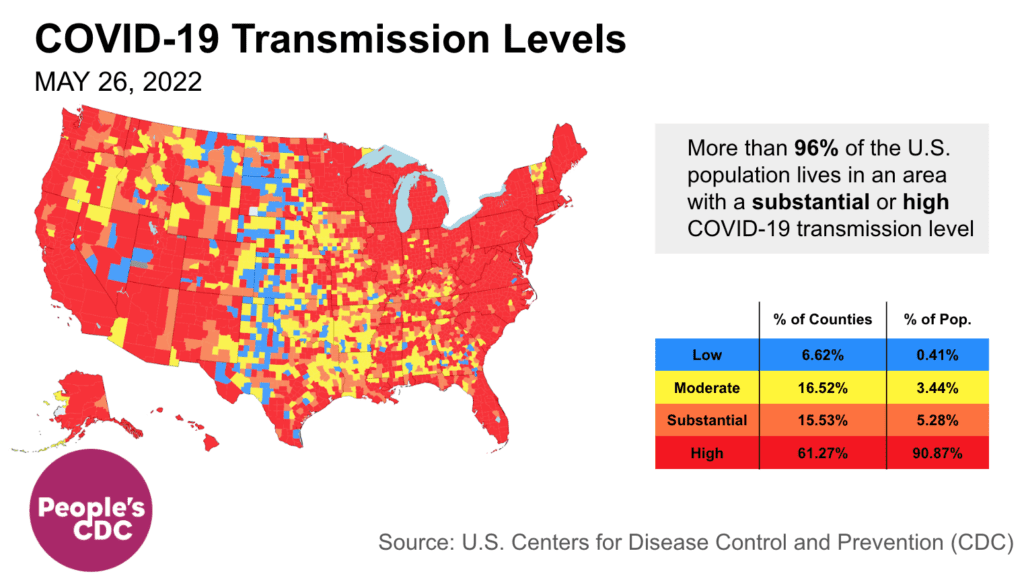
The CDC transmission map shows most of the country – 87% of counties & 96% of people – at high/substantial transmission. While earlier mask mandates could have reduced cases, the CDC has yet to call for masking or any other layers (besides vaccines) to protect the public.
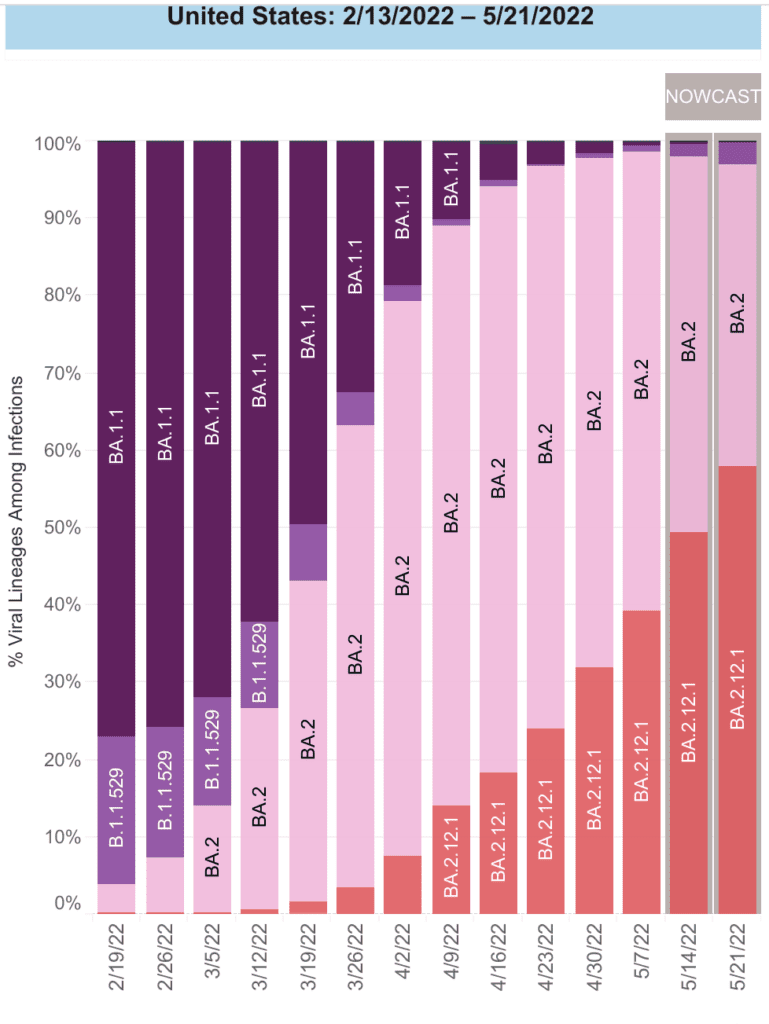
On Variants: In 2022, we’ve had 3 successive subvariants of Omicron wash over the country. BA2.12 is now the dominant variant in the US making up about 58% of all new cases for the week ending May 21.
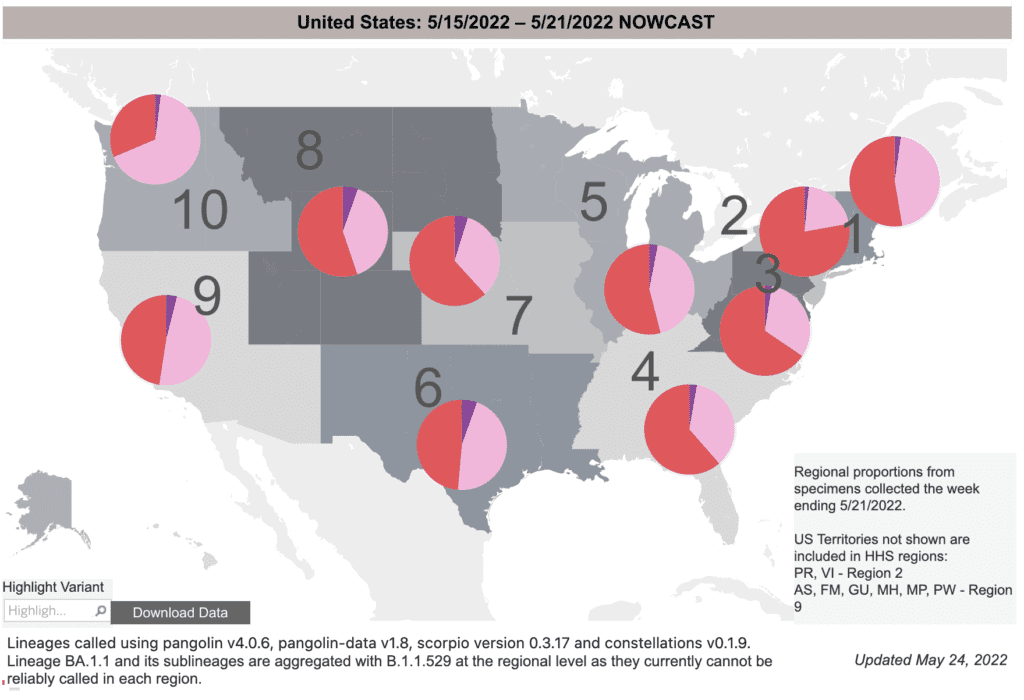
Geographically, we see that while BA2.12 (red) makes up the majority of cases in the Northeast and Great Lakes regions, it is still growing in the West and South; we are sadly not done with this surge yet.
Two variants (BA.4 & BA.5) have been found in South Africa (due to their excellent surveillance work). They have similar changes as BA.2.12. Early lab studies suggest BA.4 & BA.5 can escape immunity from earlier strains, like BA.2. This means folks who recently had COVID may be vulnerable again.
Wastewater Monitoring: Cases are highly undercounted in this surge. Wastewater data does not rely on testing or reporting. Nationally, rates are still about as high as the fall Delta surge, but may be leveling off.
Regionally we see important differences. While the Northeast (orange) may have peaked, the rest of the country (South, Midwest, West top to bottom) are still increasing. In every region but the South, these levels are higher than the Delta peak.
This data is a strong reminder we need better surveillance–and to use that surveillance to take action.
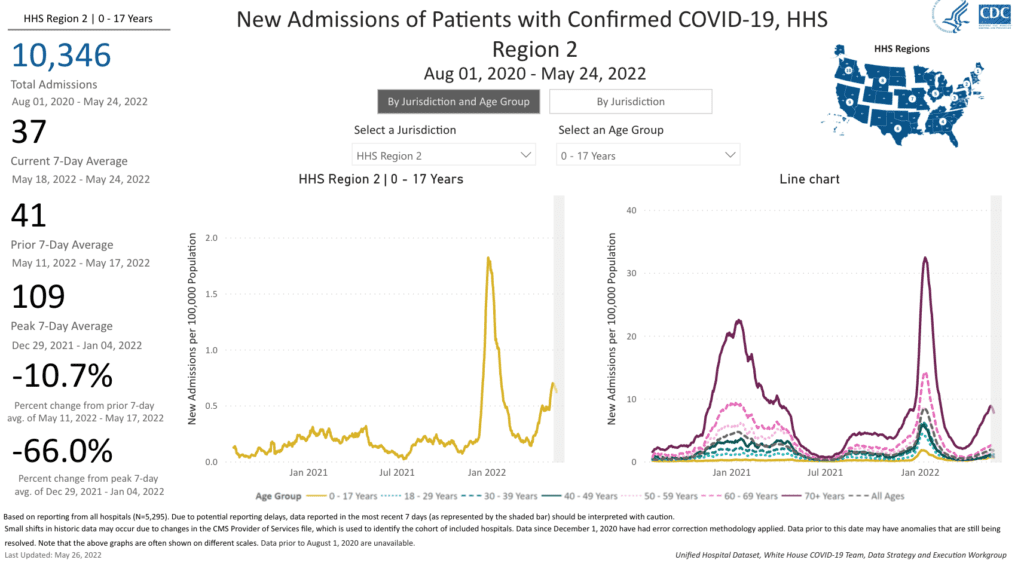
Hospitalizations: For the fifth week in a row, hospitalizations continue to increase nationally. While hospitalizations are still relatively low, this should be expected whenever cases rise for prolonged times. This measure does not capture the risk of long covid & other outcomes.
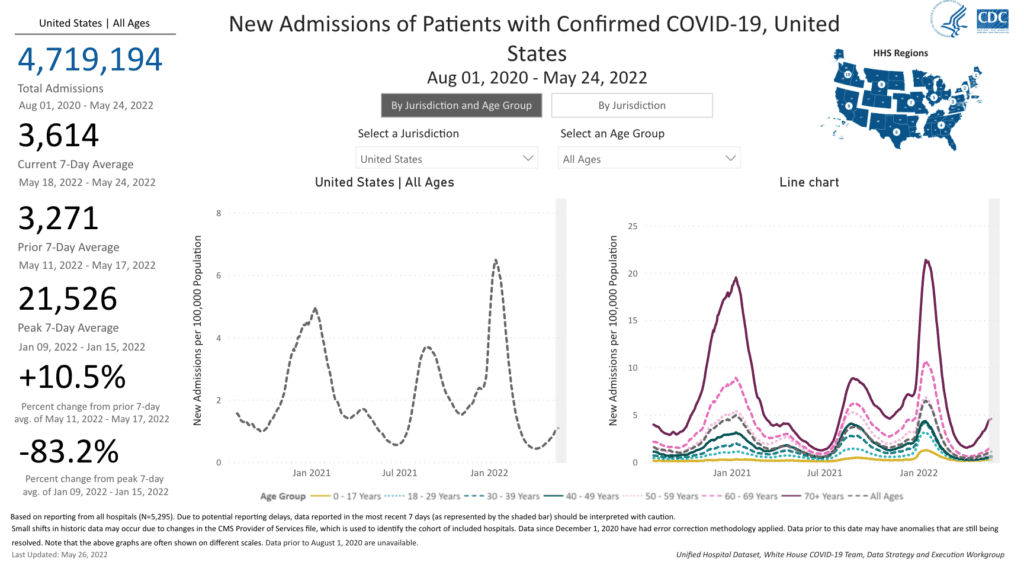
In the hardest hit Northeastern regions, hospitalizations among kids reached their second highest levels of the pandemic. Without further action, this may be replayed across the rest of the nation.
Deaths: In the past week, from May 19 to 25, 2,140 people died of COVID nationally.
Be Prepared, Whatever the Weather: Boosters are available for everyone 5 & older, with some eligible for 2nd booster. The FDA will meet June 15 to review vaccine data for children under 5. If they recommend authorization, young children could begin vaccination early this summer.
Vaccines alone will not prevent spread nor Long COVID. Masks & ventilation (also paid sick leave & access to testing) are key. Some health departments are doing amazing work to help communities improve air quality.
Forecast: Some universities, citing high levels of community transmission, have reinstated mask mandates for indoor spaces on campus, including the University of HawaiiUniversity of California, Los Angeles, and University of Delaware.
On Long COVID: According to the CDC, approximately 1 in 5 adults will experience a new condition starting one month or more after surviving COVID. COVID survivors have twice the risk for developing pulmonary embolism or respiratory conditions.
Other conditions after COVID included cardiovascular conditions, blood clots and vascular issues, kidney failure, musculoskeletal conditions, and neurologic and mental health conditions.
![Image has text with a graphic of a person and various body parts noted. “Approximately 1 in 5 adults ages 18+ have a health condition that might be related to their previous COVID-19 illness, such as: Neurologic and mental health conditions (arrow pointing to person’s head with asterisk: Adults aged 55 and older at increased risk), kidney failure (arrow pointing to person’s kidney), musculoskeletal conditions (arrow pointing to person’s shin), cardiovascular conditions (arrow pointing to person’s heart), respiratory conditions (arrow pointing to lungs), [and] blood clots and vascular issues (arrow pointing to circulatory system). Talk to your health care provider if you have symptoms after COVID-19. bit.ly/MMWR7121, May 24, 2022”](https://bej.gbh.mybluehost.me/wp-content/uploads/2022/05/MMWR-1-in-5-with-conditions-after-covid-1.jpg)
Vaccination alone may not significantly reduce long-term health consequences of COVID infection. A new study found that vaccination only reduced the risk of Long COVID by about 15% compared to those who were not vaccinated.
Sources (in order):
- https://covid.cdc.gov/covid-data-tracker/#county-view?list_select_state=all_states&list_select_county=all_counties&data-type=CommunityTransmission&null=Risk
- https://covid.cdc.gov/covid-data-tracker/#county-view?list_select_state=all_states&list_select_county=all_counties&data-type=CommunityTransmission&null=Risk
- https://COVID.cdc.gov/COVID-data-tracker/#variant-proportions
- https://www.biorxiv.org/content/10.1101/2022.05.26.493539v1.full.pdf
- https://www.medrxiv.org/content/10.1101/2022.05.25.22275603v1.full.pdf
- https://biobot.io/data/
- https://www.medrxiv.org/content/10.1101/2022.05.25.22275603v1.full.pdf
- https://covid.cdc.gov/covid-data-tracker/#new-hospital-admissions
- https://covid.cdc.gov/covid-data-tracker/#trends_dailydeaths
- https://www.cnbc.com/2022/05/23/kids-covid-shots-fda-panel-sets-june-15-meeting-on-pfizer-moderna-vaccines-for-infants-and-toddlers.html
- https://twitter.com/LazarusLong13/status/1529348796651474945?s=20&t=YWVb8-1v-awHOD34Bbc08w
- https://www.hawaii.edu/news/2022/05/24/masking-updated/
- https://covid-19.ucla.edu/mandatory-indoor-masking-to-resume-at-ucla-due-to-rise-in-covid-19-cases/https://www.udel.edu/udaily/2022/may/mask-requirement-reinstated-indoor-spaces/
- https://www.cdc.gov/mmwr/volumes/71/wr/mm7121e1.htm
- https://www.nature.com/articles/s41591-022-01840-0
News Updates for 5/30/22:
- https://emergency.cdc.gov/han/2022/han00467.asp
“Paxlovid continues to be recommended for early-stage treatment of mild to moderate COVID-19 among persons at high risk for progression to severe disease. Paxlovid treatment helps prevent hospitalization and death due to COVID-19. COVID-19 rebound has been reported to occur between 2 and 8 days after initial recovery and is characterized by a recurrence of COVID-19 symptoms or a new positive viral test after having tested negative.”