
Semana del 30 de mayo de 2022
La Situación Actual – “El Clima”:
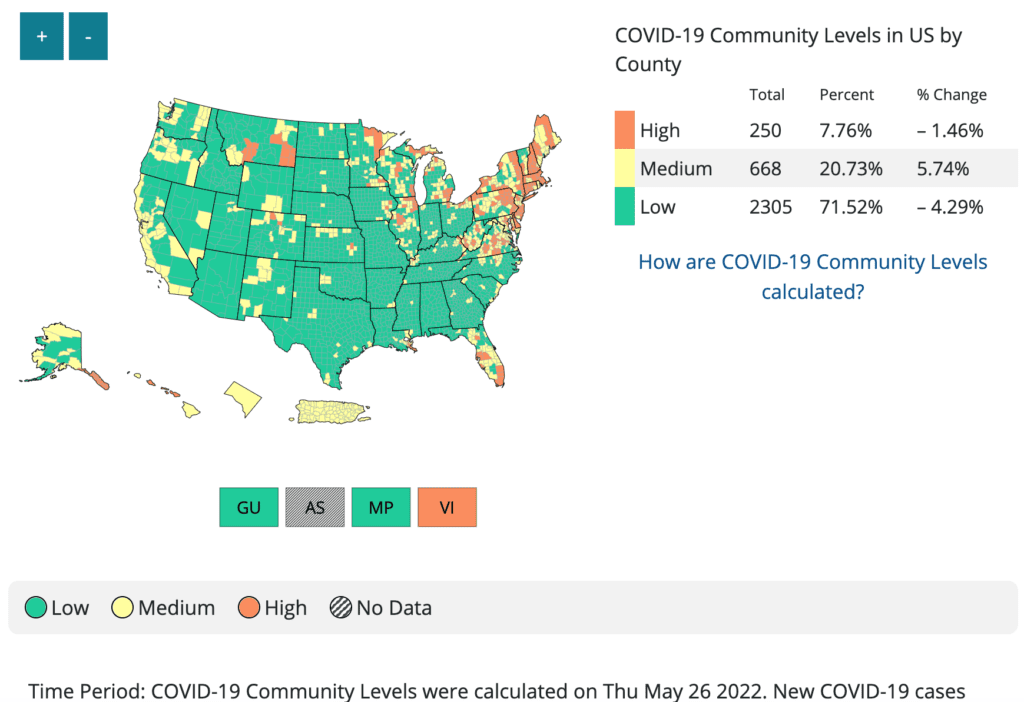
Estados Unidos está claramente en alza; mientras que los casos no se denuncian, la El "nivel comunitario" retrasado de los CDC los mapas comienzan a ponerse rojos en todo el país.
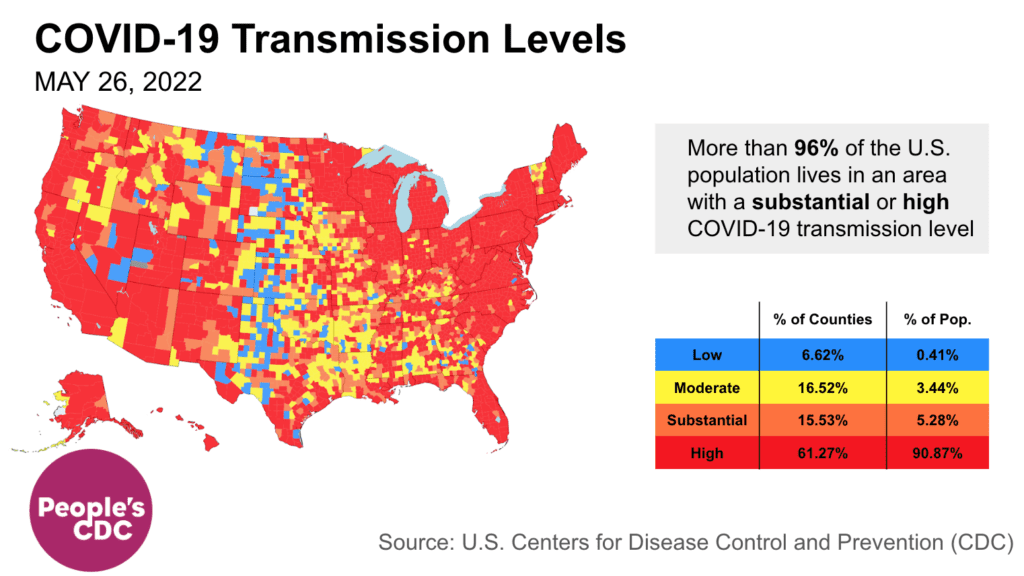
El Mapa de transmisión de CDC muestra la mayor parte del país (87% de condados y 96% de personas) con transmisión alta/sustancial. Si bien los mandatos de uso de máscaras anteriores podrían haber reducido los casos, los CDC aún tienen que exigir el uso de máscaras o cualquier otra capa (además de las vacunas) para proteger al público.
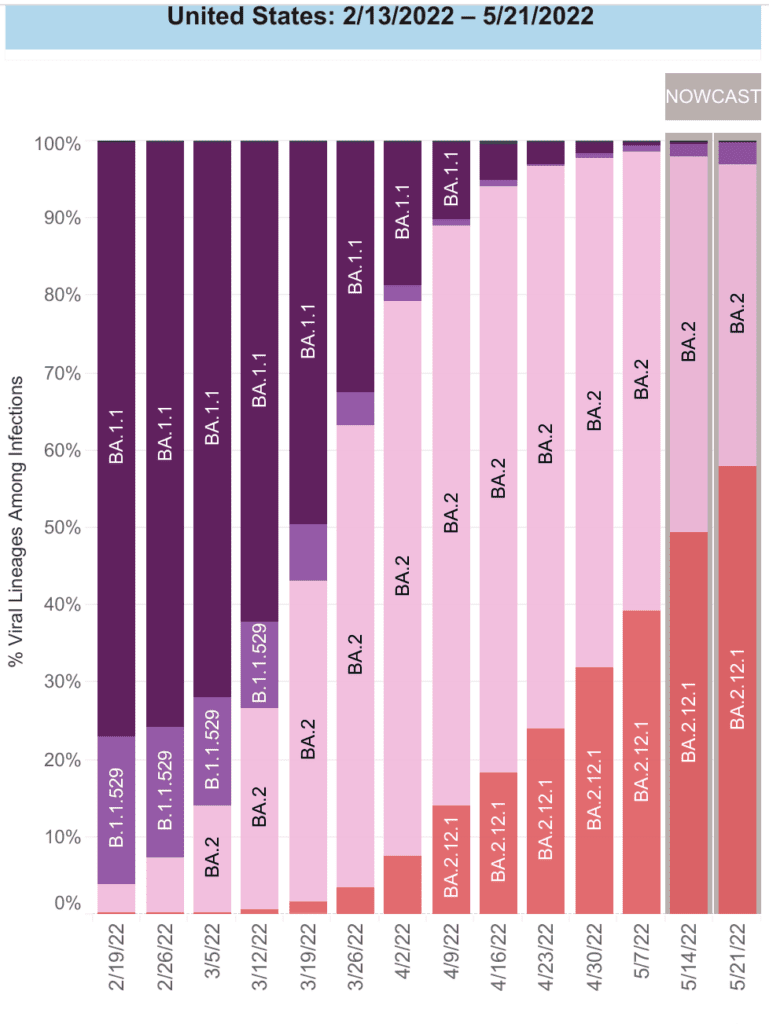
Sobre variantes: En 2022, hemos tenido 3 subvariantes sucesivas de Omicron inundando el país. BA2.12 es ahora la variante dominante en los EE. UU. y representa alrededor de 58% de todos los casos nuevos para la semana que terminó el 21 de mayo.
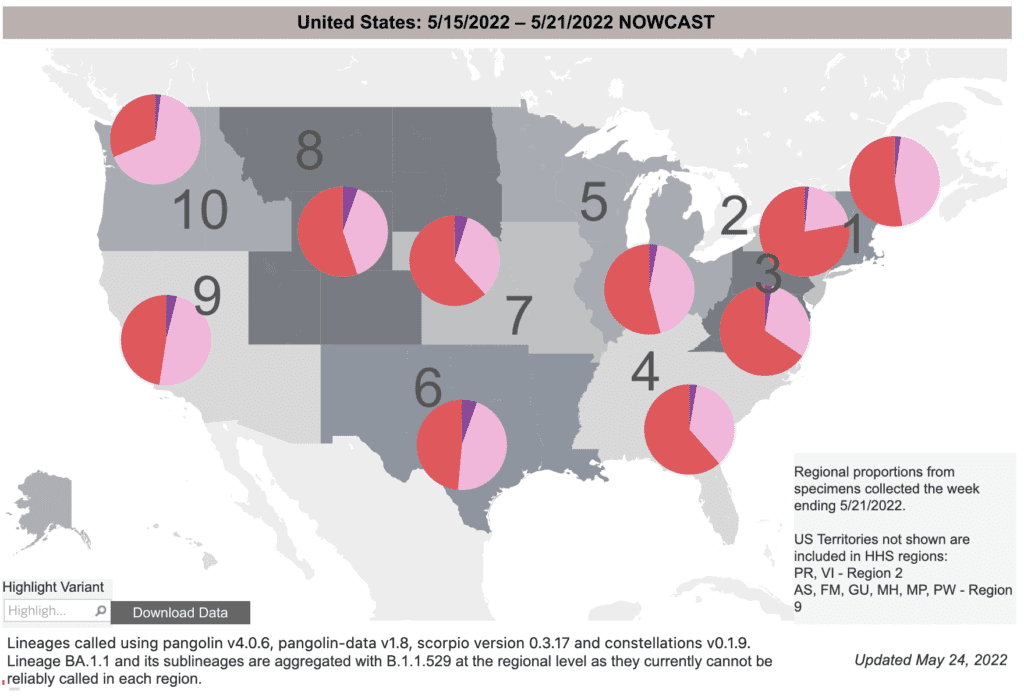
Geográficamente, vemos que mientras BA2.12 (rojo) constituye la mayoría de los casos en las regiones del noreste y los Grandes Lagos, todavía está creciendo en el oeste y el sur; Lamentablemente, aún no hemos terminado con este aumento.
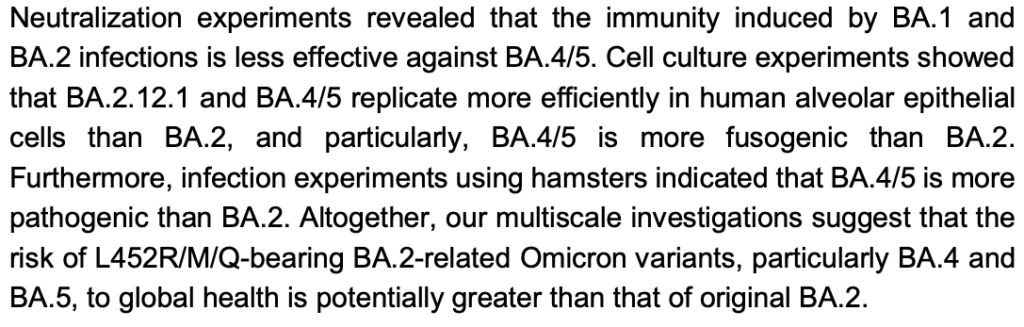
Se han encontrado dos variantes (BA.4 y BA.5) en Sudáfrica (debido a su excelente trabajo de vigilancia). Ellos tienen cambios similares a BA.2.12. Los primeros estudios de laboratorio sugieren BA.4 y BA.5 puede escapar a la inmunidad de cepas anteriores, como BA.2. Esto significa que las personas que recientemente tuvieron COVID pueden volver a ser vulnerables.
Monitoreo de aguas residuales: Los casos son muy subestimado en este aumento. Datos de aguas residuales no se basa en pruebas o informes. A nivel nacional, las tasas siguen siendo tan altas como el aumento del Delta en otoño, pero es posible que se estén estabilizando.
Regionalmente vemos diferencias importantes. Si bien el noreste (naranja) puede haber alcanzado su punto máximo, el resto del país (sur, medio oeste, oeste de arriba a abajo) todavía está aumentando. En todas las regiones excepto en el sur, estos niveles son más altos que el pico Delta.
Estos datos son un fuerte recordatorio necesitamos una mejor vigilancia–y utilizar esa vigilancia para tomar medidas.
Hospitalizaciones: Por quinta semana consecutiva, hhospitalizaciones seguir aumentando a nivel nacional. Si bien las hospitalizaciones aún son relativamente bajas, esto debe esperarse siempre que los casos aumenten durante períodos prolongados. Esta medida no captura el riesgo de covid prolongado y otros resultados.
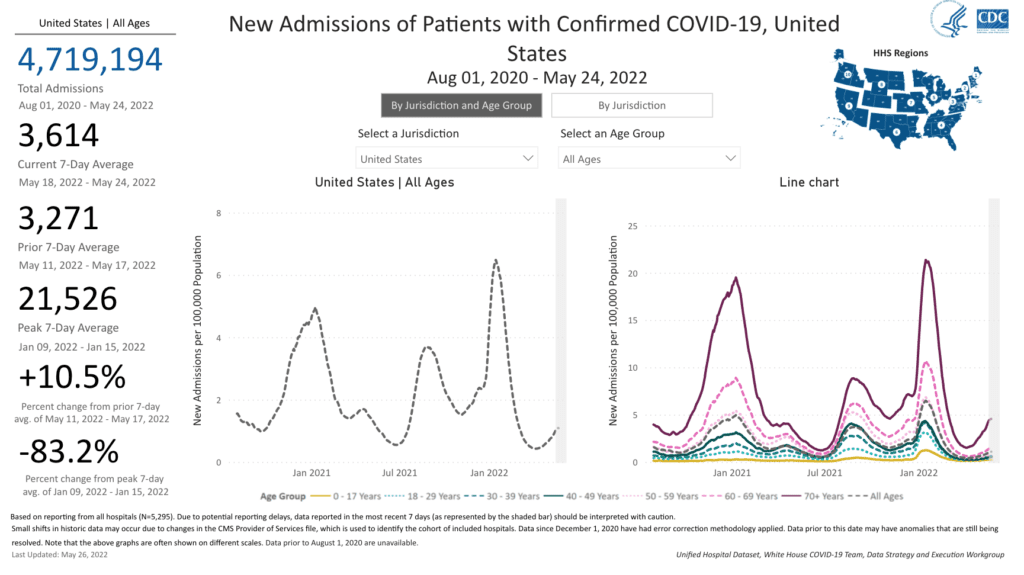
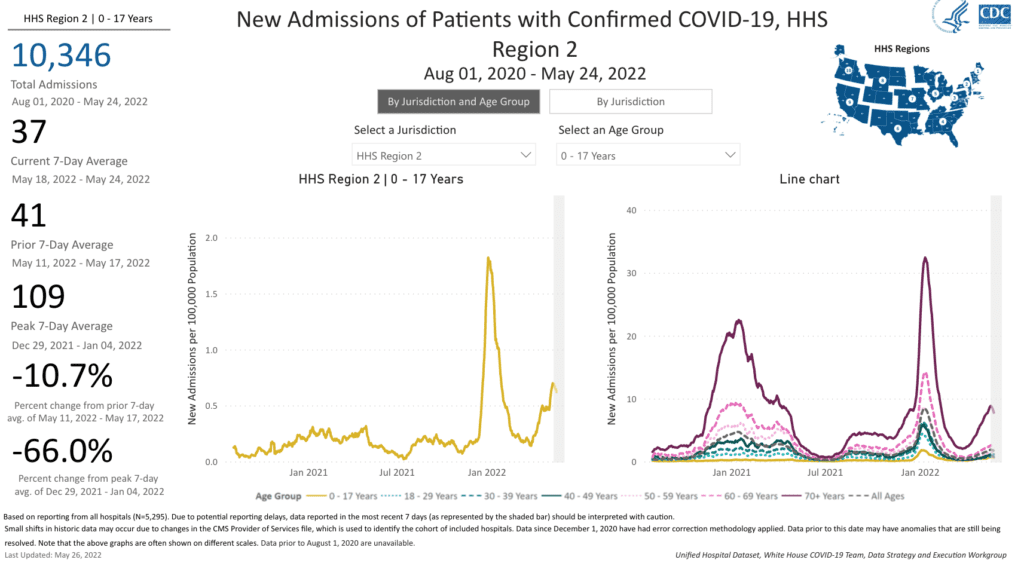
En las regiones del noreste más afectadas, las hospitalizaciones de niños alcanzaron su segundo nivel más alto de la pandemia. Sin más acción, esto puede repetirse en el resto de la nación.
Fallecidos: La semana pasada, del 19 al 25 de mayo, 2.140 personas han fallecido por COVID a nivel nacional.
Esté preparado, sin importar el clima: Los refuerzos están disponibles para todos los mayores de 5 años, y algunos son elegibles para el segundo refuerzo. los FDA se reunirá el 15 de junio para revisar los datos de vacunas para niños menores de 5 años. Si recomiendan la autorización, los niños pequeños podrían comenzar a vacunarse a principios de este verano.
Las vacunas por sí solas no evitarán la propagación ni el COVID prolongado. Las máscaras y la ventilación (también la licencia por enfermedad pagada y el acceso a las pruebas) son clave. Algunos departamentos de salud están haciendo un trabajo increíble para ayudar a las comunidades a mejorar la calidad del aire.
Pronóstico: Algunas universidades, citando altos niveles de transmisión comunitaria, han restablecido los mandatos de máscara para espacios interiores en el campus, incluido el Universidad de HawáiUniversidad de California, Los Angeles, y Universidad de Delaware.
Sobre COVID largo: Según el CDC,aproximadamente 1 de cada 5 adultos experimentará una nueva condición a partir de un mes o más después de sobrevivir a COVID. Los sobrevivientes de COVID tienen el doble de riesgo de desarrollar embolia pulmonar o afecciones respiratorias.
Otras condiciones después de COVID incluyeron afecciones cardiovasculares, coágulos sanguíneos y problemas vasculares, insuficiencia renal, afecciones musculoesqueléticas y afecciones neurológicas y de salud mental.
![Image has text with a graphic of a person and various body parts noted. “Approximately 1 in 5 adults ages 18+ have a health condition that might be related to their previous COVID-19 illness, such as: Neurologic and mental health conditions (arrow pointing to person’s head with asterisk: Adults aged 55 and older at increased risk), kidney failure (arrow pointing to person’s kidney), musculoskeletal conditions (arrow pointing to person’s shin), cardiovascular conditions (arrow pointing to person’s heart), respiratory conditions (arrow pointing to lungs), [and] blood clots and vascular issues (arrow pointing to circulatory system). Talk to your health care provider if you have symptoms after COVID-19. bit.ly/MMWR7121, May 24, 2022”](https://b2626777.smushcdn.com/2626777/wp-content/uploads/2022/05/MMWR-1-in-5-with-conditions-after-covid-1.jpg?lossy=1&strip=1&webp=1)
Es posible que la vacunación por sí sola no reduzca significativamente las consecuencias para la salud a largo plazo de la infección por COVID. un nuevo estudio descubrió que la vacunación solo redujo el riesgo de COVID largo en aproximadamente 15% en comparación con aquellos que no fueron vacunados.
Fuentes (en orden):
- https://covid.cdc.gov/covid-data-tracker/#county-view?list_select_state=all_states&list_select_county=all_counties&data-type=CommunityTransmission&null=Risk
- https://covid.cdc.gov/covid-data-tracker/#county-view?list_select_state=all_states&list_select_county=all_counties&data-type=CommunityTransmission&null=Risk
- https://COVID.cdc.gov/COVID-data-tracker/#variant-proportions
- https://www.biorxiv.org/content/10.1101/2022.05.26.493539v1.full.pdf
- https://www.medrxiv.org/content/10.1101/2022.05.25.22275603v1.full.pdf
- https://biobot.io/data/
- https://www.medrxiv.org/content/10.1101/2022.05.25.22275603v1.full.pdf
- https://covid.cdc.gov/covid-data-tracker/#new-hospital-admissions
- https://covid.cdc.gov/covid-data-tracker/#trends_dailydeaths
- https://www.cnbc.com/2022/05/23/kids-covid-shots-fda-panel-sets-june-15-meeting-on-pfizer-moderna-vaccines-for-infants-and-toddlers.html
- https://twitter.com/LazarusLong13/status/1529348796651474945?s=20&t=YWVb8-1v-awHOD34Bbc08w
- https://www.hawaii.edu/news/2022/05/24/masking-updated/
- https://covid-19.ucla.edu/mandatory-indoor-masking-to-resume-at-ucla-due-to-rise-in-covid-19-cases/https://www.udel.edu/udaily/2022/may/mask-requirement-reinstated-indoor-spaces/
- https://www.cdc.gov/mmwr/volumes/71/wr/mm7121e1.htm
- https://www.nature.com/articles/s41591-022-01840-0
Actualizaciones de noticias para el 30/05/22:
- https://emergency.cdc.gov/han/2022/han00467.asp
“Se sigue recomendando Paxlovid para el tratamiento en etapa inicial de COVID-19 de leve a moderado entre personas con alto riesgo de progresión a enfermedad grave. El tratamiento con Paxlovid ayuda a prevenir la hospitalización y la muerte por COVID-19. Se ha informado que el rebote de COVID-19 ocurre entre 2 y 8 días después de la recuperación inicial y se caracteriza por una recurrencia de los síntomas de COVID-19 o una nueva prueba viral positiva después de haber dado negativo”.