
The Current Situation – “The Weather”:
The US continues to experience a surge. The CDC transmission map shows 98% of people in the US at high/substantial transmission.
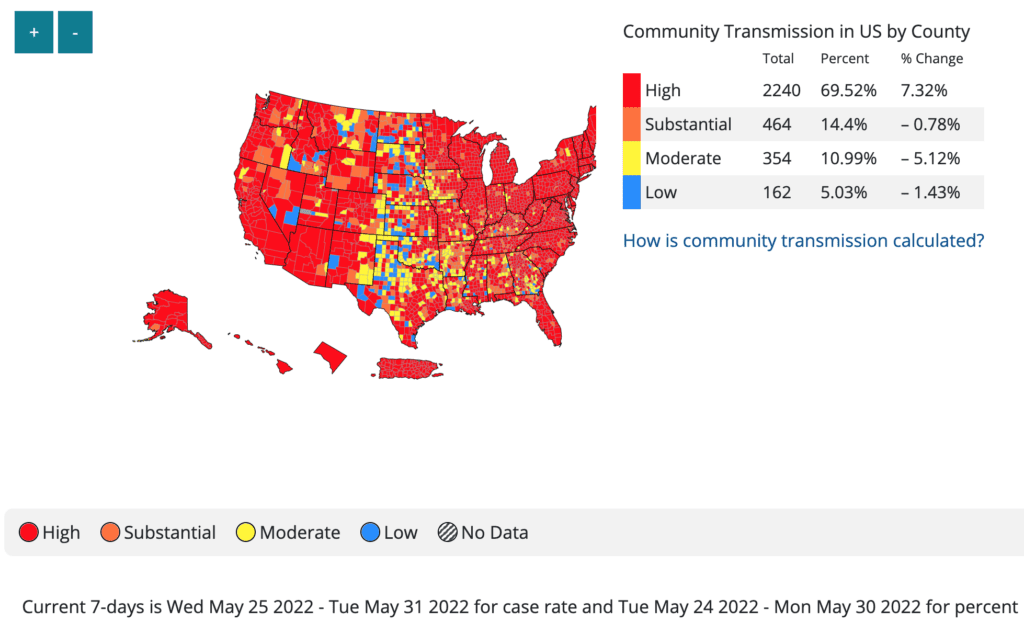
This video shows the evolution of 2022 transmission levels from March 18th – June 2nd. While there was a brief lull in March, the Northeast begins turning red in early April and by the end of April, high levels have spread across the country. Now, most of the country is red.
On Variants:
BA2.12 is still the dominant variant in the US, at 59%. We expect to see BA.4 & BA.5 included in the near future. They are now included with other strains in the light purple group, which has increased from 3.4% last week to 6.1% this week.
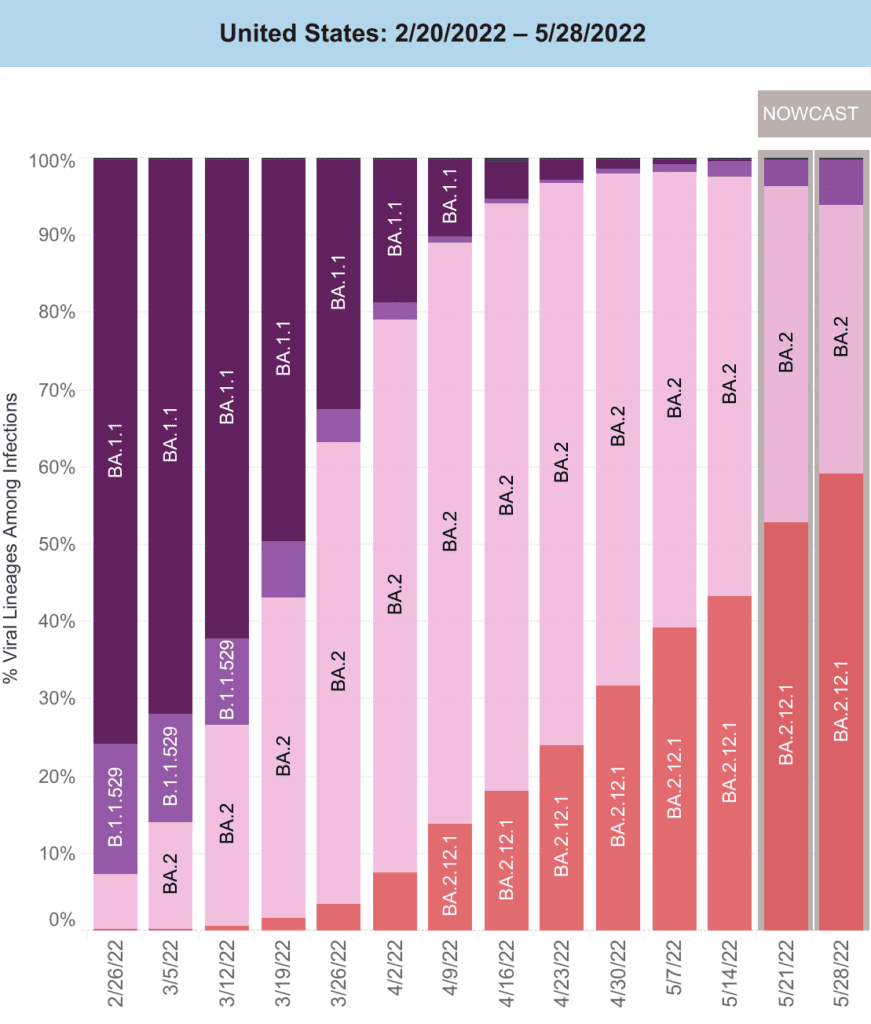
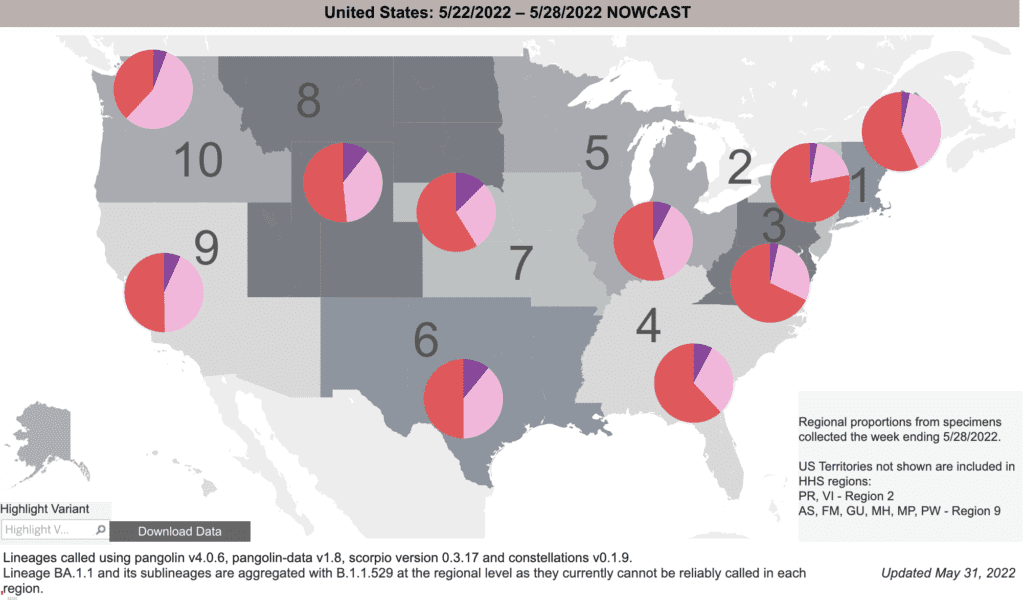
The BA2.12 (red) surge emerged from the Northeast and spread west; it makes up the majority in the Northeast and Great Lakes regions. Interestingly, the purple slice, including BA.4/5, is increasing in the Central & Western regions. The future impact of BA.4/5 will be key.
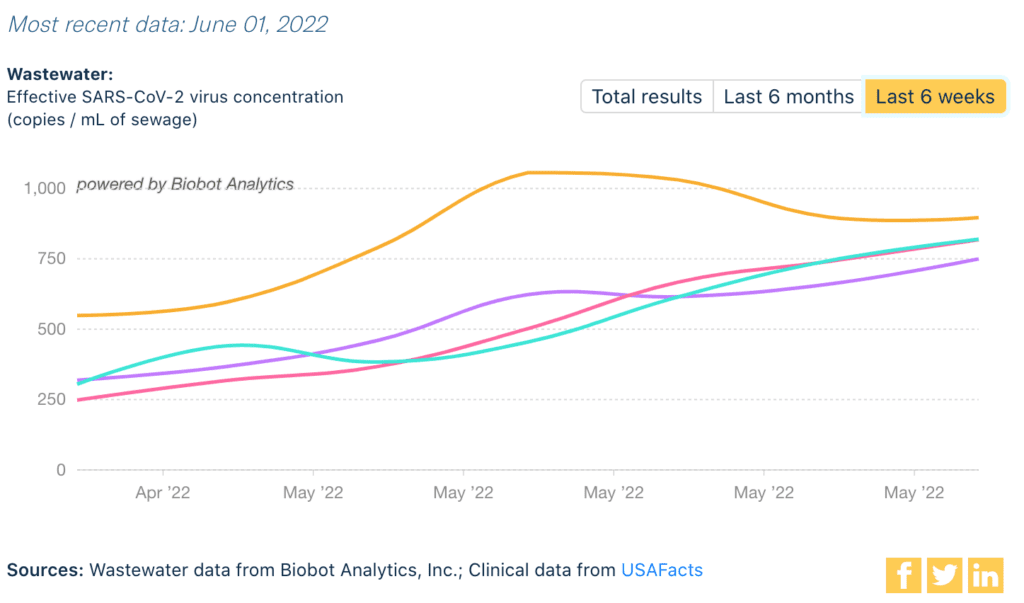
Wastewater Monitoring:
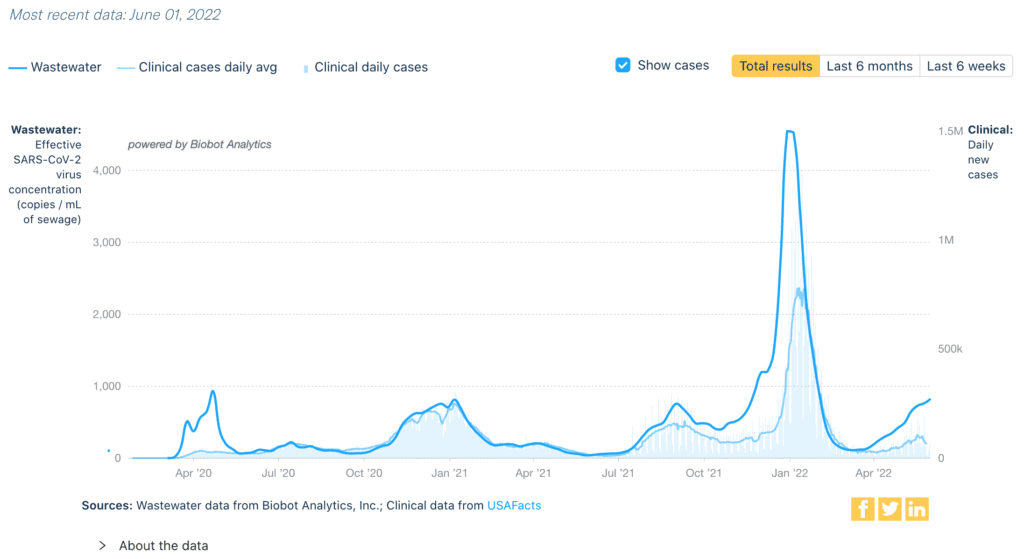
Nationally, wastewater levels are clearly higher than the Delta surge last fall, even if cases are undercounted. Levels have not peaked yet.
Regionally, we see a similar pattern. The Northeast surge of BA2.12 (yellow) may be peaking, having far exceeded the fall surge. The Midwest (green), South (pink) & West (purple) continue to rise, with the Midwest & West already higher than their fall surges.
In fact, looking at variants from wastewater data (from 2 weeks ago), the Northeast & Midwest has been dominated by BA.2.12, with very little BA.4/5. However, the South & West show somewhat lower levels of BA.2.12 (38 to 40%) and emerging signs of BA.4/5 (still only 1-2%).
![This table, Omicron Variant Overview, states “Sequencing for variants takes longer than detecting SARS-CoV-2 so the data [are from] the week of May 18, 2022.” The table has 5 rows of regions and 5 columns of variants. The regions are Nationwide, Midwest, Northeast, South, and West. The columns are BA.1 with an asterisk, BA.2, BA.2.12 with an asterisk, BA.4 & 5, and Other. “An asterisk indicates that sub-lineages are included. BA.1 includes BA.1.1 & other sublineages. BA.2.12 includes BA.2.12.1 & other sublineages. Excepting BA.2.12 & its sublineages, BA.2 sublineages are aggregated with BA.2.” The most common variants are BA.2, with a national average of 49 percent & BA.2.12 at 50 percent. BA.1 is not detected in any region. BA.4 & 5 is nationally at 1 percent. Other is nationally at 0.3 percent. The Midwest & Northeast have the highest percentages of BA.2.12, at 52 & 60 percent, respectively. The South & West have the highest percentages of BA.2, at 59 & 58 percent, respectively.](https://bej.gbh.mybluehost.me/wp-content/uploads/2022/06/6.6.22_WastewasterVariants-1024x346.png)
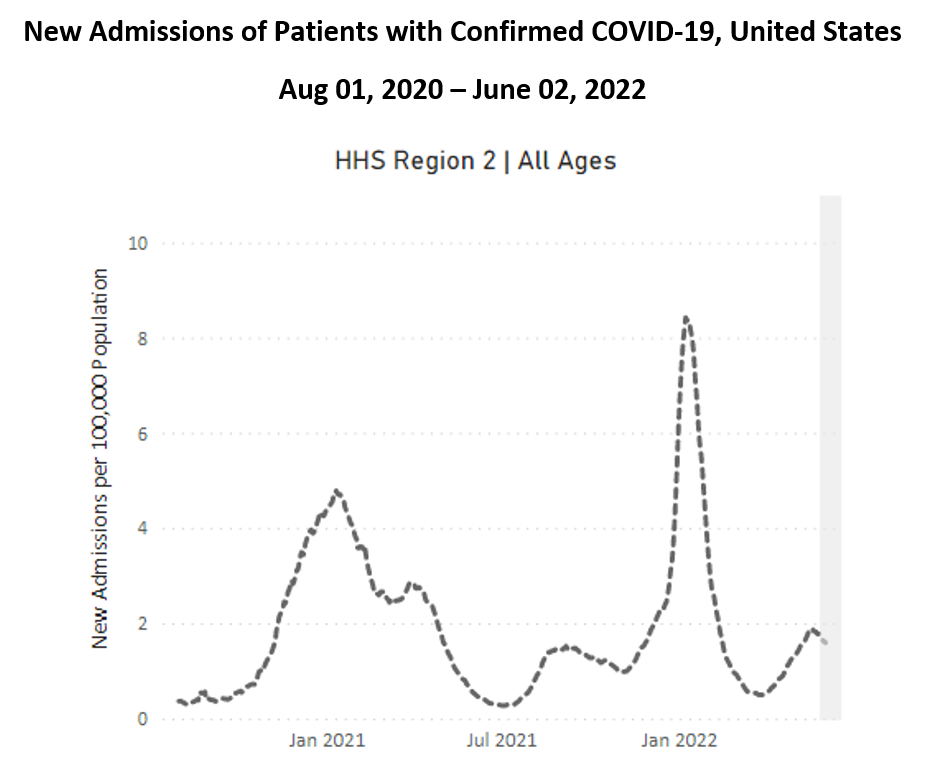
Hospitalizations:
For 6 weeks in a row, hospitalizations are rising nationally, still at relatively low levels. As we’ve seen with cases, hospitalizations in the Northeast (below) have peaked (higher than the fall, Delta surge). Hospitalizations are rising in other regions.
Deaths:
In the past week, from May 26 to June 1, 1711 people died of COVID nationally. A recent summary reminds us that more children died from Delta & Omicron than in a regular flu year.
Be Prepared, Whatever the Weather:
High-quality masks remain an effective and essential layer of protection, regardless of variant. Ventilation, vaccination, testing, & paid-sick leave are key too!
Forecast:
Alameda County became the first county in California to reinstate an indoor mask requirement, effective June 3, 2022. We await to see if other local leaders decide to take action as cases rise.
Children under five years of age could begin receiving COVID vaccinations as soon as June 21, according to the White House. Everyone over 5 is eligible for at least one booster.
On Long COVID:
This week, we are highlighting another personal story on Long COVID, from Erica Hayes, who had COVID in November 2020 and has not recovered.
Erica describes a familiar trend with Long COVID patients: COVID can impact anyone. She was an active 36 year old that now has many limitations and difficulties with activities of daily living. Erica has been passed between clinics and specialists to get the most basic care and accommodations.
Erica was prescribed physical therapy to help with exercise intolerance, and graded exercise therapy caused a permanent decline in her condition due to what’s known as post exertional malaise, or PEM. PEM can be due to physiological abnormalities that cause a worsening of symptoms after activity. Patients show circulatory impairment, abnormal ventilatory pattern, dysfunctional breathing, and resting hypocapnia. These conditions are not uncommon with Long COVID, says Erica, though testing for it is not readily available.
Advocates with post-infectious illness, like those with Myalgic Encephalomyelitis (ME/CFS) have been fighting for awareness of the danger of graded exercise for their patient population for decades, and with many COVID Long Haulers experiencing PEM and exercise intolerance, it is important for practitioners to screen for PEM and teach patients about the importance of pacing out their daily activities.
Erica says, this could have been avoided. Her story highlights the urgent need for medical professionals to look at the history of post-viral illnesses and the decades of research on Post-COVID conditions like ME/CFS, Dysautonomia, & MCAS. While Long COVID is new, post-infectious illness is not. It is more important now than ever to listen to patients about what they need.
Listen to Erica’s story here:
Sources (in order):
- https://covid.cdc.gov/covid-data-tracker/#county-view?list_select_state=all_states&list_select_county=all_counties&data-type=CommunityTransmission&null=Risk
- https://covid.cdc.gov/covid-data-tracker/#county-view?list_select_state=all_states&list_select_county=all_counties&data-type=CommunityTransmission&null=Risk
- https://COVID.cdc.gov/COVID-data-tracker/#variant-proportions
- https://biobot.io/data/
- https://covid.cdc.gov/covid-data-tracker/#new-hospital-admissions
- https://covid.cdc.gov/covid-data-tracker/#trends_dailydeaths
- https://insidemedicine.bulletin.com/delta-and-omicron-killed-far-more-children-than-flu-ever-does
- https://covid.cdc.gov/covid-data-tracker/#trends_dailydeaths
- https://www.pnas.org/doi/10.1073/pnas.2119266119
- https://www.latimes.com/california/story/2022-06-02/first-california-county-reinstates-covid-mask-mandate
- https://www.npr.org/2022/06/02/1102728941/white-house-covid-vaccine-children-5-under
News Updates for 6/6/22:
- NYC plans on ending pandemic protections for older and some medically vulnerable people in shelters. Part of a disturbing trend of government agencies to disregard COVID and continue to fail the most vulnerable in our society.
- ““In addition to removing protections for older adults, the information we’ve received indicates this is going to affect at least hundreds and probably thousands of people with a wide range of chronic health conditions,” said Helen Strom, director of benefits and homeless advocacy at the Urban Justice Center’s Safety Net Project.
Since the start of the pandemic in early 2020, COVID has killed more than 40,000 New Yorkers. According to a report issued by the Coalition for the Homeless, 151 homeless people have died of COVID since its onset in the city, which some advocates believe is likely an undercount. A study published last month in the Journal of the American Medical Association found that excess deaths were higher among older adults during the omicron surge this past winter than when the delta variant was the most predominant strain in 2021.”
- ““In addition to removing protections for older adults, the information we’ve received indicates this is going to affect at least hundreds and probably thousands of people with a wide range of chronic health conditions,” said Helen Strom, director of benefits and homeless advocacy at the Urban Justice Center’s Safety Net Project.