
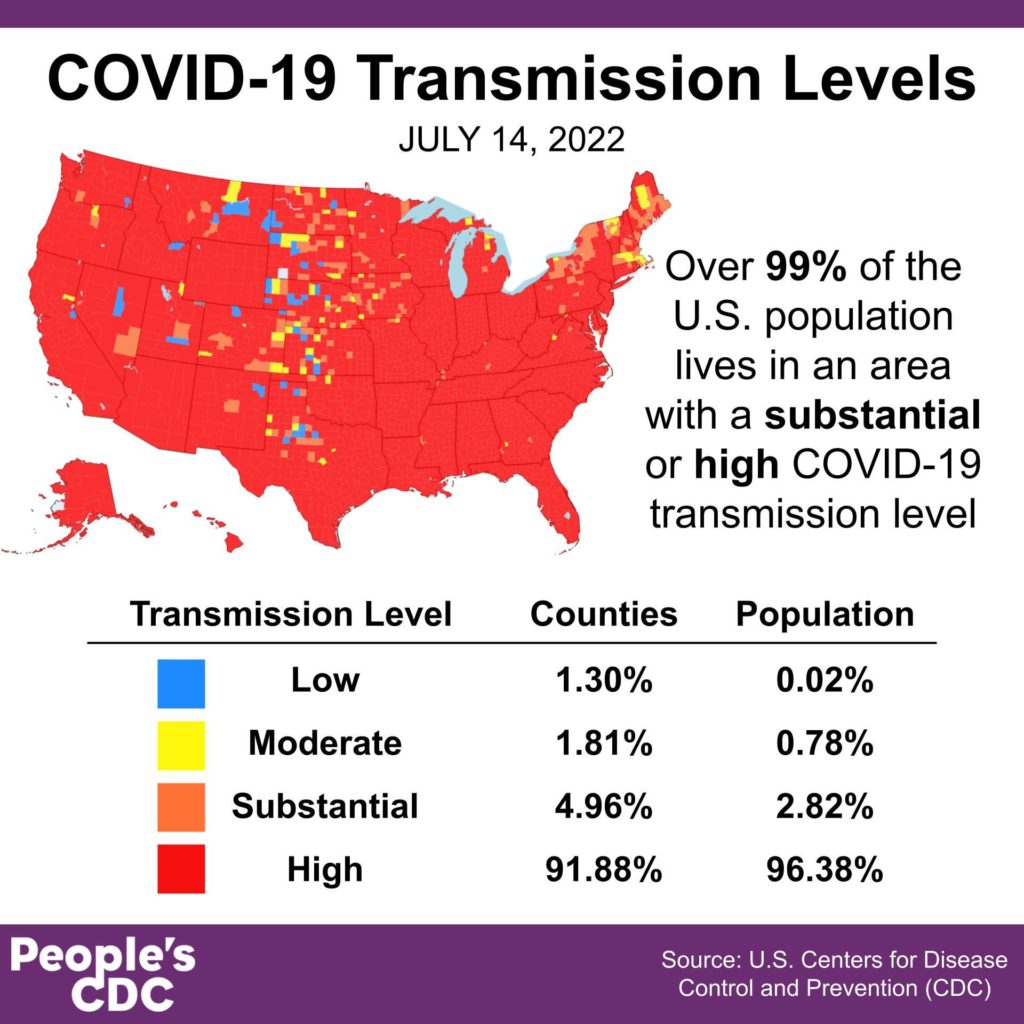
The Weather: We remain in a sustained COVID surge and the transmission map shows that 99% of people in the US live in areas with high or substantial transmission.
Watch the spread here: https://youtu.be/PI85hiYDeNo
According to one national lab’s #COVID19 Index, the test positivity rate for the week ending July 15 in the US was 41.3%, an increase of 7.1% from the previous week.
On Variants: BA.4/5 are now the dominant variants in the US at an estimated 81% of cases.
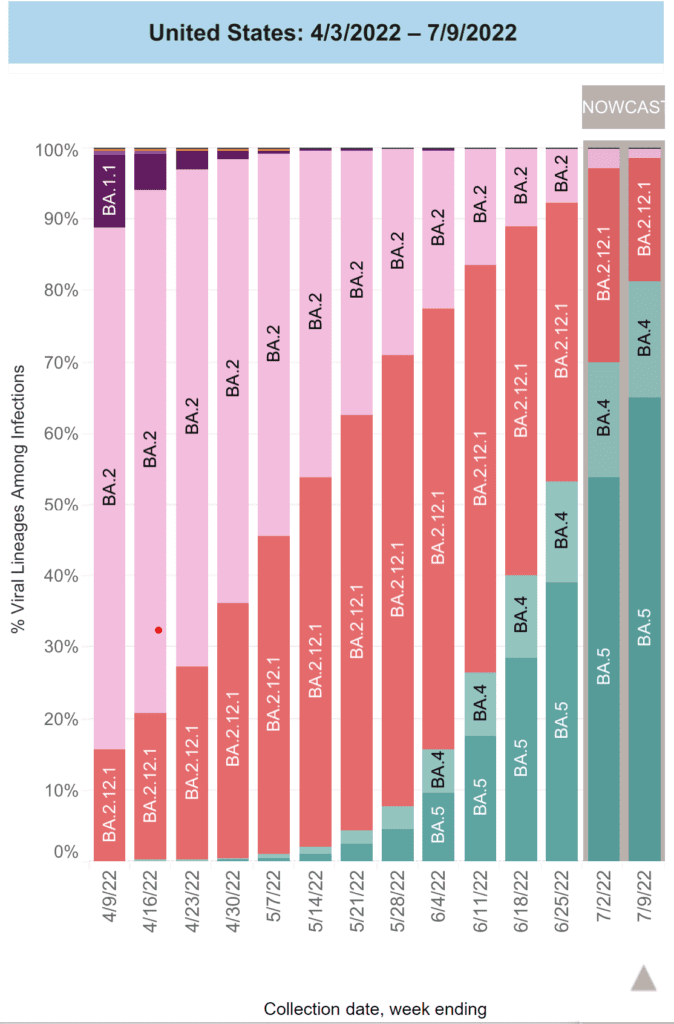
BA.5 alone is the most infectious variant yet, accounting for 65% of new infections last week.
Dr. Eric Topol, a virologist, shares the story of BA.5’s substantial evolution from previous Omicron variants and its ability to evade immunity from vaccines and past infections, leading to increased risk of reinfection.
In other variant news, a new study found that vaccine effectiveness to prevent moderate to severe disease decreased against BA2.12 compared to BA.1, which further confirmed the recommendation for vulnerable groups to receive a 2nd booster dose.
Another variant, BA.2.75 has been detected in India, UK, US, Australia, Germany, and Canada. Virologists are concerned by BA.2.75’s mutations, including several in a region of the spike protein, a key place for antibodies to bind to stop the virus.
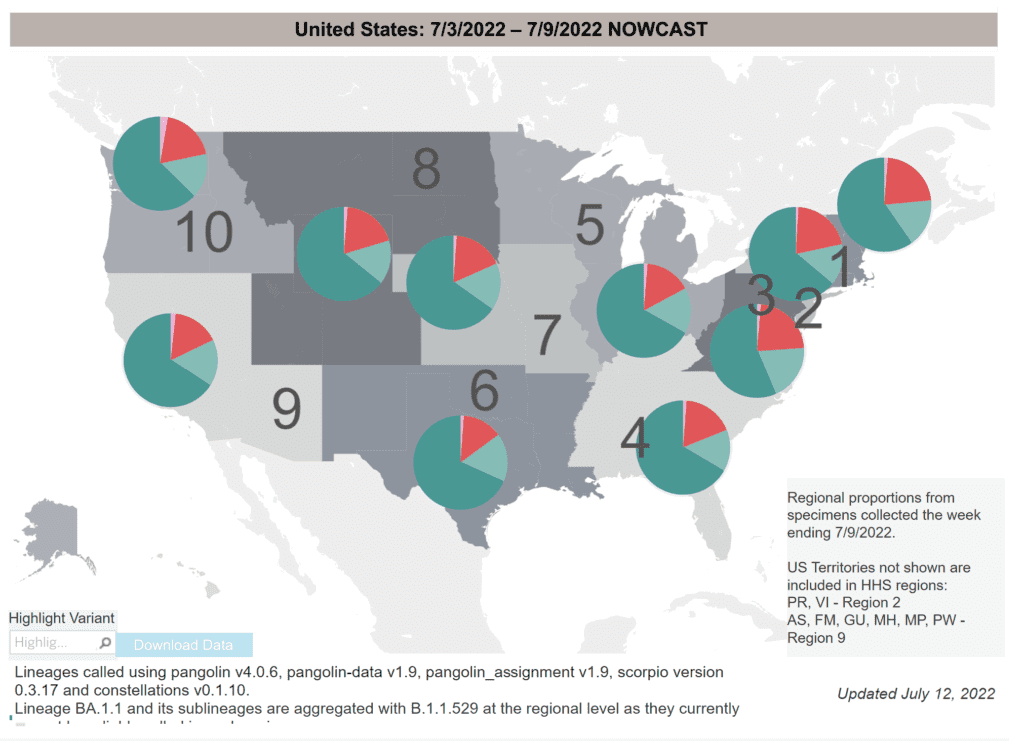
The BA.5 subvariant makes up more than half of cases in every region.
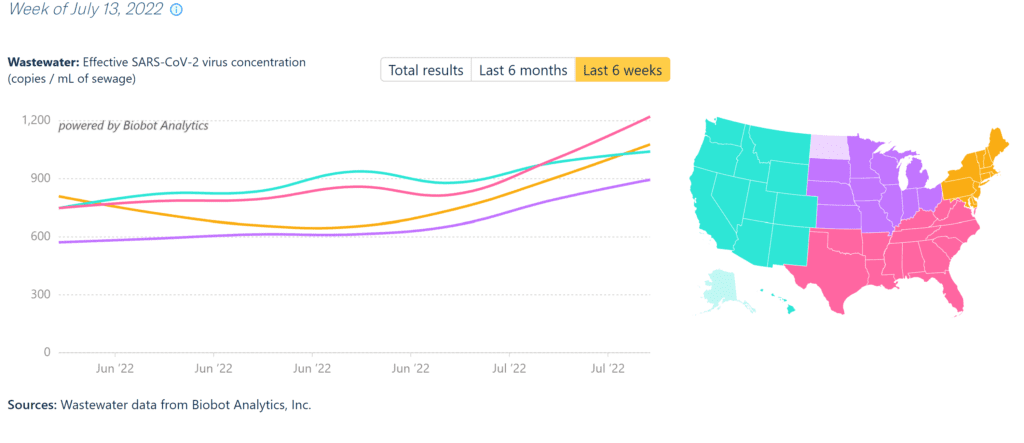
Wastewater Monitoring: National wastewater data from @BiobotAnalytics shows that last week’s plateau has changed to a sharp increase. Our current levels match the peak levels of 2020 and 2021, yet we have far fewer protections in place.
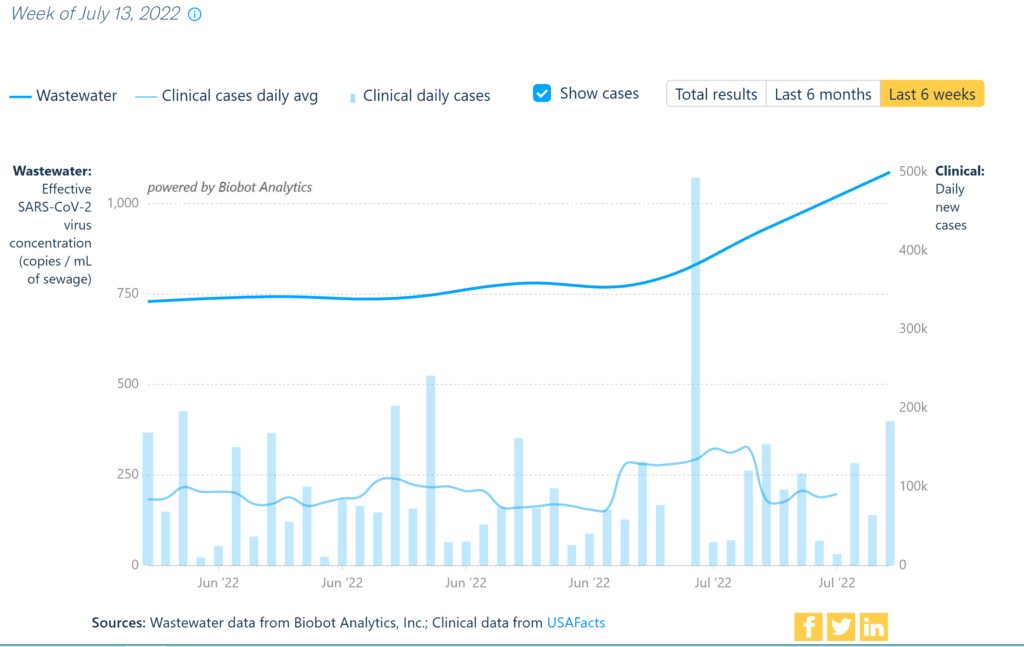
Regionally all areas are now increasing, with the West increasing as well but at a slower rate than other regions.
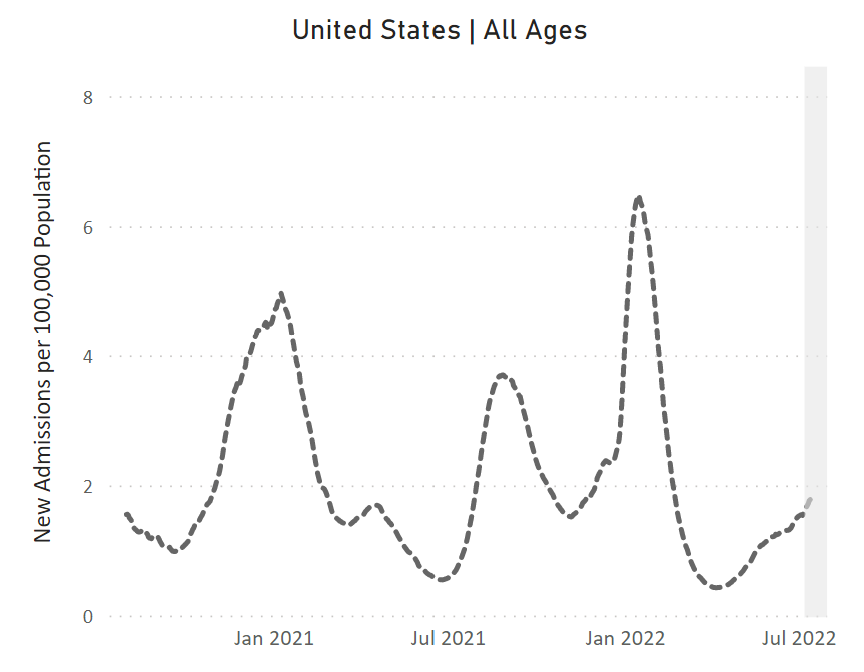
Hospitalizations: For 12 weeks in a row, hospitalizations have been rising nationally. After a brief dip in the Northeast, rates are rising again – showing little protection against BA.5 from the previous surges. All regions are now seeing increased hospitalizations.
Antimicrobial-resistant infections in hospitals had been on the decline before COVID, but have now risen, illustrating how unsustainable the strain on the already under-resourced US healthcare system is, with wide-reaching harms to overall patient care.
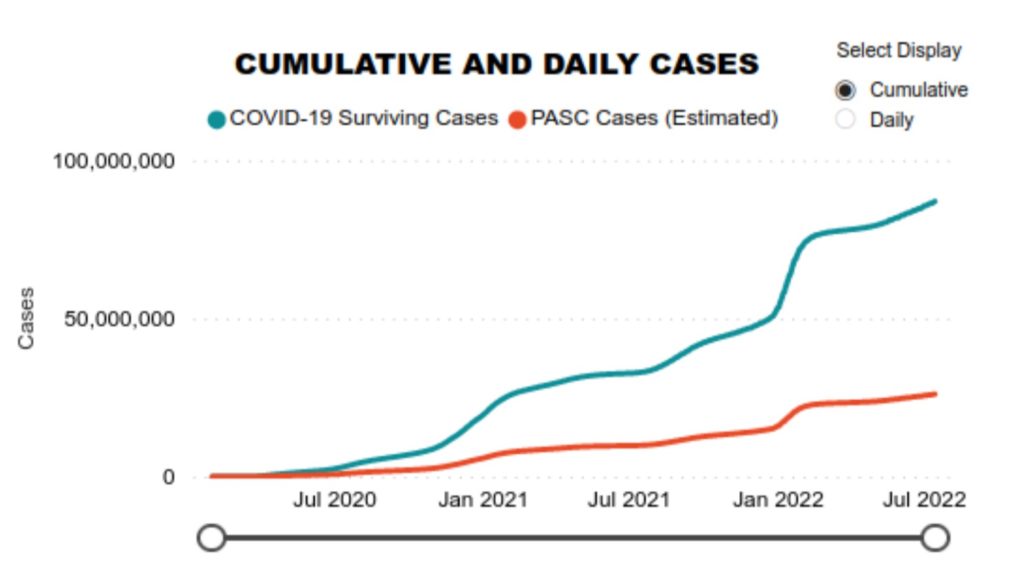
On Long COVID: Almost 1 in 5 adults who have had COVID continue to experience long term health issues related to their infection.
Long term health problems can emerge even after mild or asymptomatic COVID cases and for people with no previous health conditions. An estimated 26 million people so far have been affected by Long COVID.
People living with Long COVID are leading vital research, support, and advocacy efforts.
Deaths: From July 7 to July 13, 2,531 people died of COVID nationally, bringing the overall US total COVID deaths reported to 1,018,578, including at least 1,694 children under the age of 18.
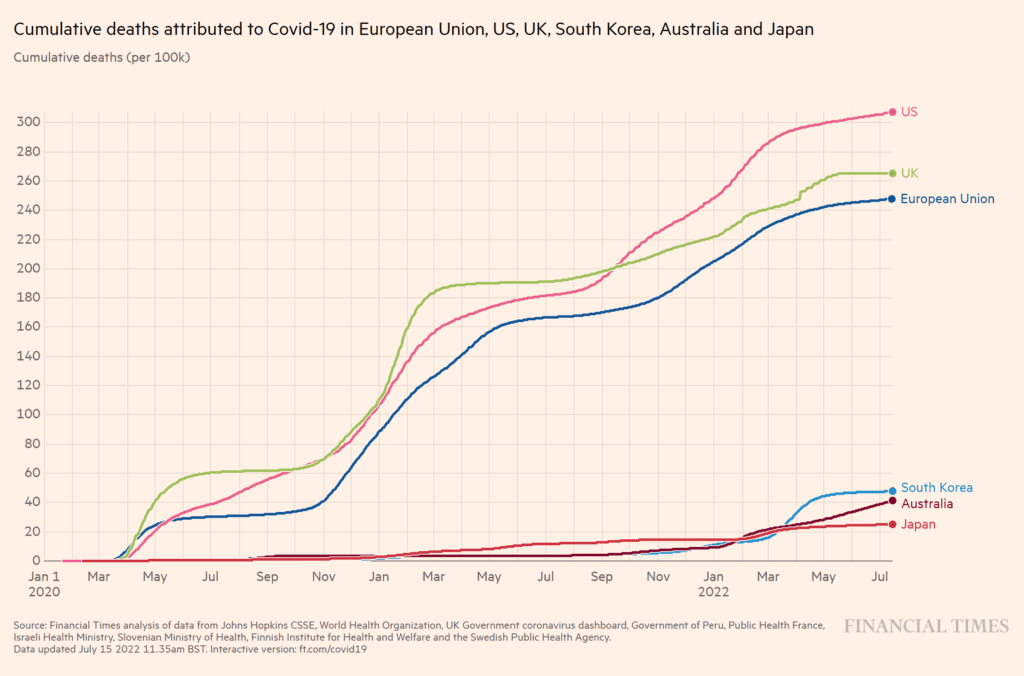
Cumulative deaths in the US, UK, and EU vastly outpace those in South Korea, Australia, and Japan according to a Financial Times analysis of several global dashboards.
Many of us have lost loved ones to COVID or know someone who has and we grieve these losses together as we fight to prevent more avoidable deaths.
On Monkeypox: The US has had over 1,400 confirmed cases of monkeypox and the slow federal response to this outbreak repeats many of the mistakes made with COVID.
We need accessible tests, treatment, vaccines, contact tracing, and social supports to help contain the spread of monkeypox, COVID, and future viral outbreaks. Cooperation on a globally coordinated scale could help to prevent outbreaks in the first place.
Forecast: The FDA has authorized emergency use of Novavax, an additional COVID vaccine.
The FDA has also recommended updated vaccine development tailored to the new variants, but updates would not be available until at least mid-fall.
New Zealand is responding to BA.5 with new measures to slow transmission, including expanding access to masks and rapid tests.
The belief that viruses inevitably evolve into milder versions is a myth. BA.5 is a problem and we should still do all that we can to prevent infections.
The Biden Administration, state, and local leaders can still implement measures to reduce the spread of the virus and make our communities safer for everyone. We must act on our care for one another by demanding they meet the ongoing crisis with the seriousness it deserves.
Dealing with the current crisis is crucial both in the short term and long term given that climate change and the effects of ongoing environmental destruction mean an increased risk of the emergence of harmful viruses in the years ahead.
Be Prepared: The new dominant variants are more likely to infect people even if they’ve been vaccinated or have had COVID before.
Staying up to date with vaccinations reduces the odds of death and severe illness, but additional protections are needed to prevent infection and passing COVID to others.
As a reminder, N95 respirators should be NIOSH-certified. @projectn95 is one resource.
A recent study found that when used together with other measures, frequent rapid-antigen testing can help reduce spread. With every other day testing, all rapid antigen test brands can work to contain COVID outbreaks.
We continue to recommend that everyone use layers of protection to reduce infections as much as possible. Check out The People’s CDC guides for info on how to keep yourself and your community safer as we push for needed structural changes at federal and state levels.
We urgently need public health policy measures like mask mandates, improved air quality, paid sick leave, unemployment support, eviction freezes, decarceration, and universal healthcare.
Our government could make life-saving policy changes, but continues to stall on putting the necessary funds towards a truly effective pandemic response. It pours more money than any other country into the military, approving an $839 billion budget for 2023.
Meanwhile, the world’s wealthiest have extracted even more wealth from the majority of people and planet during the pandemic. It does not have to be this way.
Together with our neighbors, coworkers, and communities, we can organize to make powerful demands for a society where our public resources and infrastructure go towards meeting our shared needs.
Sources: Check out the links throughout and see our website for more! https://bej.gbh.mybluehost.me