People’s CDC COVID-19 Weather Report

Published

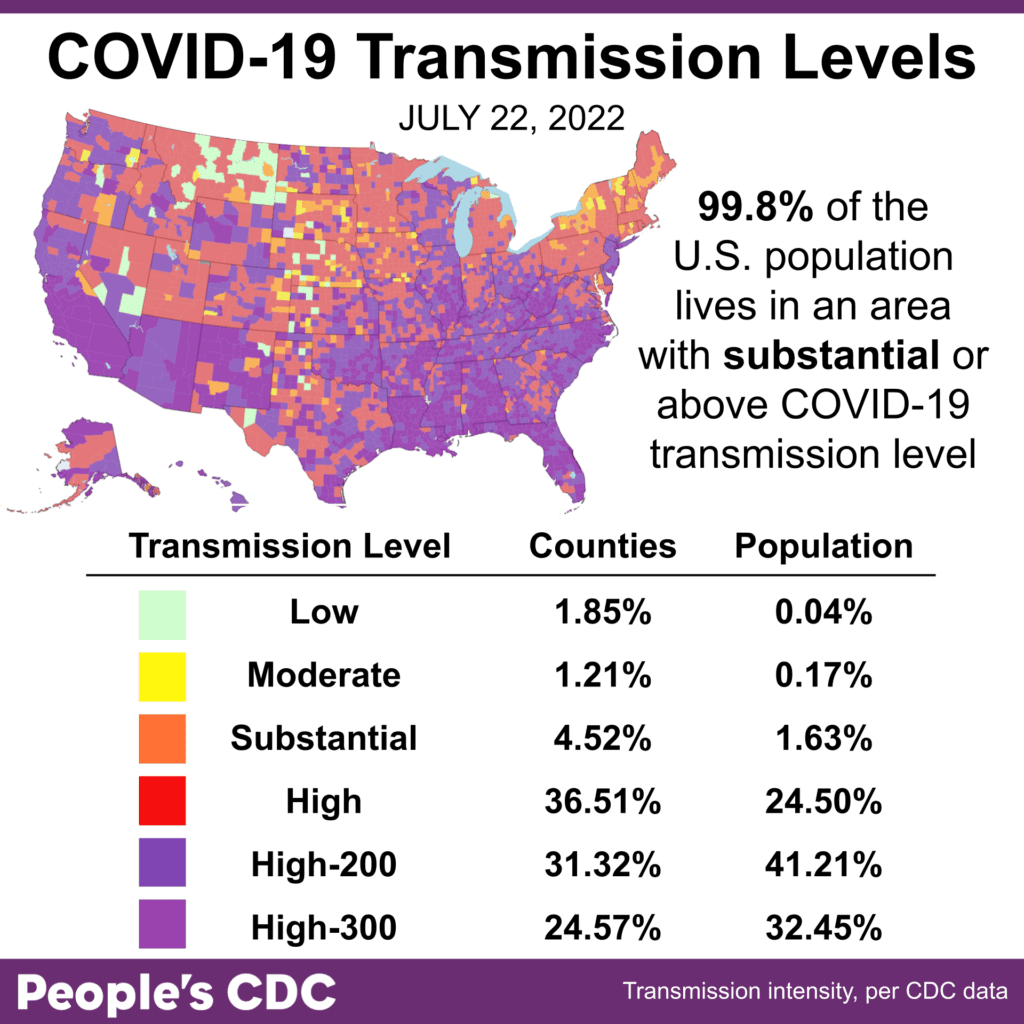
The Weather: We remain in a sustained COVID surge: every week since early June, 99% of US population lives in high or substantial transmission.

In fact we’ve updated our transmission map (h/t @JasonSalemi) to show how high transmission is, 73% living in the highest two levels!

This map and corresponding table show COVID community transmission in the US by county, with an updated legend. To show more detail than before, the map breaks out high into 3 categories: High, High-200, & High-300, which are red, purple, & magenta, respectively. High indicates transmission between 100 & 199 cases per 100,000 population, High-200 means transmission between 200 & 299 cases per 100,000, & High-300 means transmission greater than or equal to 300 cases per 100,000.  Most of the US map is orange, red, purple, and magenta, indicating substantial to extremely high levels at 99.8 percent of the population or 96.9 percent of counties. Only part of Montana and Idaho and the middle vertical line of the contiguous US--the Dakotas, Nebraska, Kansas, Oklahoma, and northern Texas--show a higher concentration of moderate and low transmission, in yellow and blue, respectively. The graphic is visualized by the People’s CDC and the data are from the CDC.

Watch the spread here: https://www.youtube.com/watch?v=QGsKEGL0bvg

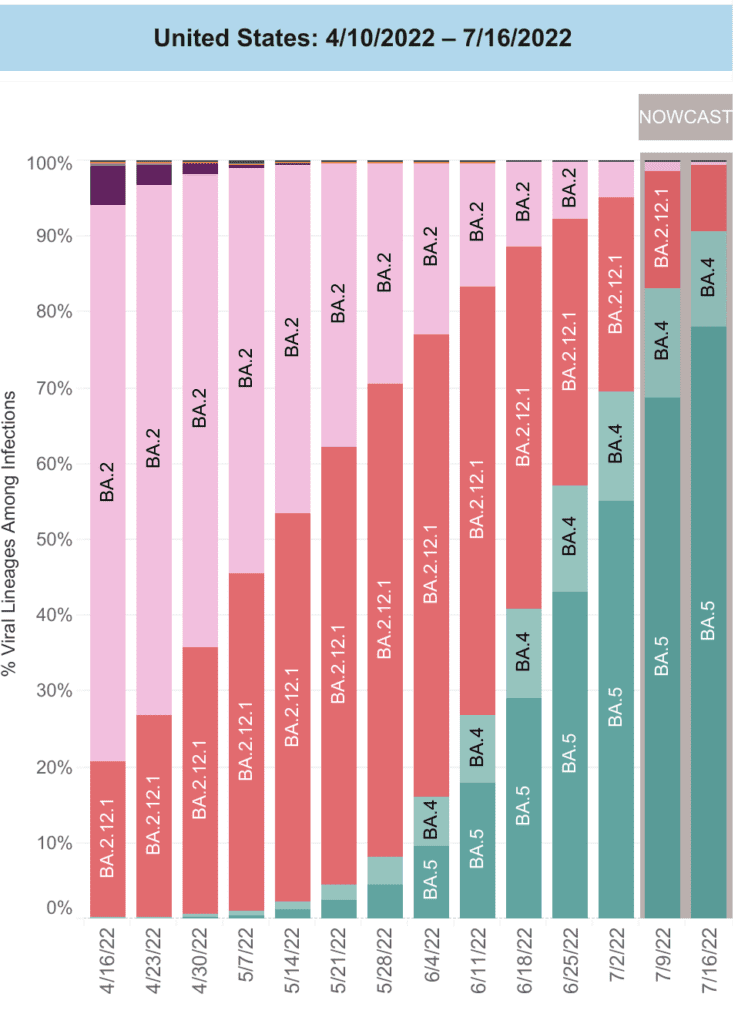
On Variants: While BA4/5 now make up 90% of cases nationally, no new variants are rising yet. 

Centaurus (BA2.75) has been detected in some states but it is not clear if it will outpace BA5 – we’ll keep updating on this!

A bar chart shows data for the weeks of 4/16/2022 through 7/16/2022 with levels for each viral lineage shown vertically. In mid-April, BA.2 was the dominant lineage, with a small level of BA1 and moderate level, 20 percent of BA2.12.1. As time went on, BA.2.12.1 continued to grow, and the aforementioned variants shrunk. In mid-May, BA.2.12.1 and BA.2 were equally found. By 5/21/2022, BA.2.12.1 overtook BA.2 as the dominant variant.As of 07/16/2022, BA4/5 had long overtaken others, now representing more than 90 percent of cases, with the predominant strain being BA.5. The pattern of growth of BA.5 over the aforementioned time period appears to be exponential.

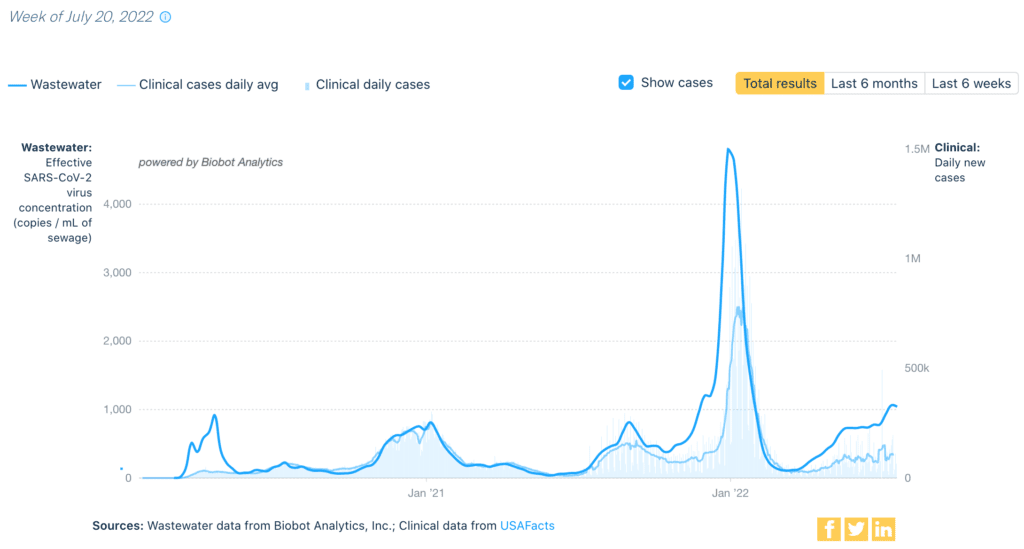
Wastewater Monitoring: National wastewater data from @BiobotAnalytics shows a small dip for the first time in months.

And yet, we are still at levels higher than any surge before Omicron. Levels are fluctuating, but remain high in all regions.

 A graph with overlapping lines indicating wastewater viral concentration in dark blue & daily clinical cases in light blue from January 2020 to July 2022. The x-axis is the date & the y-axis on the left states “Wastewater: Effective SARS-CoV-2 virus concentration, copies per mL, or milliliter, of sewage” and the y-axis on the right states “Clinical: daily new cases.” The clinical cases & daily average have fairly consistent peaks & valleys, though the lines are discrepant, with the wastewater levels consistently higher than the daily clinical cases, especially during surges. In this year to date, the wastewater line was at its lowest point in mid-March, at 107 copies per mL. From March onwards, it steadily climbed up. In June, it appeared fairly steady, starting at 732 and ending at 780 copies per mL. In July 2022, the viral concentrations spiked; the latest number from July 20 is 1063 copies per mL. Source: “Wastewater data from Biobot Analytics, Inc.; Clinical data from USAFacts.”

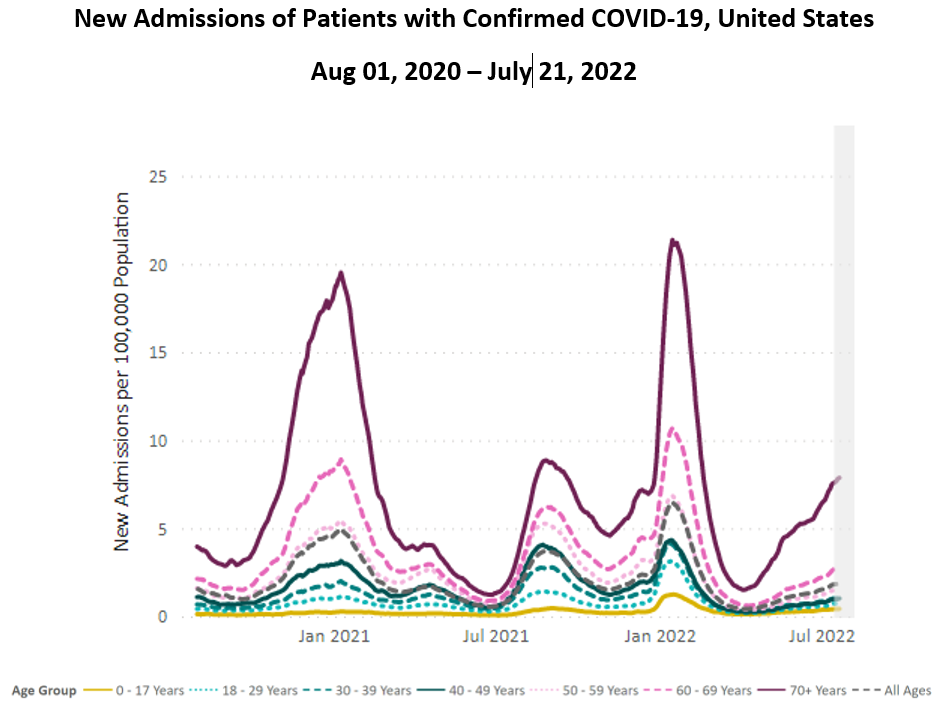
Hospitalizations: For 13 weeks in a row, hospitalizations are still rising nationally – with the most dramatic increases among those 70 and older.

This sustained surge is having significant health impacts on many living in the US – and is unsustainable for our healthcare workers.

A line chart with “New Admissions of Patients with Confirmed COVID-19, United States,” as its title, “New Admissions per 100,000 Population” on its y-axis, and dates from January 2021 to July 2022 on its x-axis. The graph contains 8 lines, which include 7 age groups and an all-ages line. The lines indicate peaks in admissions around January 2021, August 2021, and January 2022, with hospitalizations rising from spring 2022 to July 2022. The 70+ age group consistently has much higher hospitalizations than other ages, especially during peaks. Since April 2022, the 70+ disparity has been greatly increasing, and July continues this exponential trend.

Deaths: From July 14 to July 20, 2,468 people died of COVID nationally. Even the New York Times commented how this version of “normal” is brutal – and the estimate of 100,000 dead per year will almost certainly be exceeded this year.
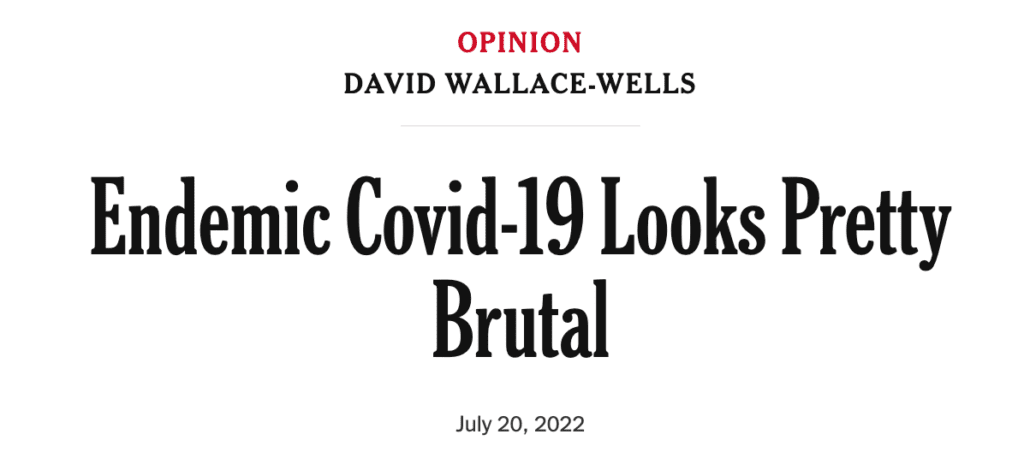
This is a headline dated July 20, 2022 from the New York Times, “Endemic COVID-19 Looks Pretty Brutal,” authored by David Wallace-Wells.
This is a paragraph of text from the editorial, with a highlighted sentence: “As a ballpark estimate, [Dr Trevor Bedford, an evolutionary virologist] says, going forward we can expect that every year, around 50 percent of Americans will be infected and more than 100,000 will die.”

Of course, sustained high levels of cases, hospitalizations & death are not inevitable. The government could choose a better response – updated vaccines, free high-quality masks & testing, improved ventilation, & paid sick leave – and create a better, healthier “normal.”

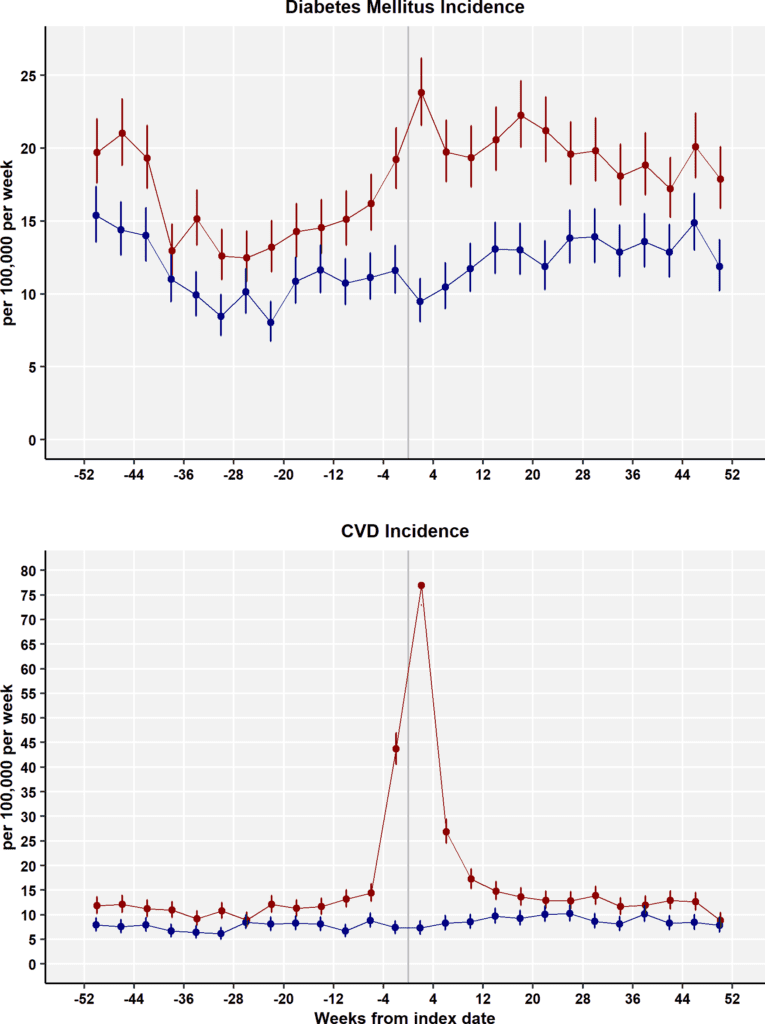
On Long COVID: Another study has confirmed higher diagnoses of diabetes and cardiovascular disease in the 4-12 weeks after a COVID infection. This suggests a need for increased monitoring during early recovery.

This is a panel of two line graphs, top and bottom. The top graph shows diabetes mellitus incidence up to 12 months after COVID infection and the bottom CVD or cardiovascular disease incidence with the same time period. The y-axes both show the number of people with such incidence per 100,000 per week. The graphs compare COVID patients in red lines compared to controls in blue lines. The red lines are the only ones with increased diabetes or CVD incidence within 4 weeks of COVID infection.

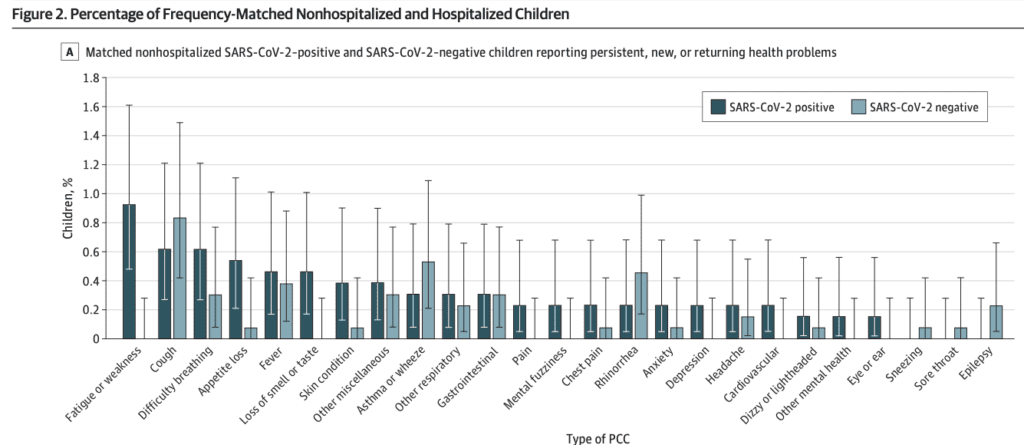
In one of the first cohort studies to examine children who were tested for COVID at ERs, and again at 90 days, 4.6% of COVID-positive children had new or persistent symptoms at follow-up, compared to only 2.7% in COVID-negative children.

These proportions nearly doubled in hospitalized children. 

Additionally, the study identified symptoms that were more common in the COVID-positive children at follow-up, including: fatigue or weakness, loss of appetite, general psychological concerns, and continued loss of smell or taste.

This is a bar chart with error bars, titled “Matched nonhospitalized SARS-CoV-2-positive and SARS-CoV-2-negative children reporting persistent, new, or returning health problems.” The x-axis lists Type of PCC, or Post-COVID Condition. 25 conditions are listed, which are Fatigue or weakness; cough; difficulty breathing; appetite loss; fever; loss of smell or taste; skin condition; other miscellaneous; asthma or wheeze; other respiratory; gastrointestinal; pain; mental fuzziness; chest pain; rhinorrhea; anxiety; depression; headache; cardiovascular; dizzy or lightheaded; other mental health; eye or ear; sneezing; sore throat; and epilepsy. The y-axis indicates the percentage of children experiencing these conditions. For the most part, those who were positive have a higher prevalence of these conditions, except for cough, asthma or wheeze, rhinorrhea, sneezing, sore throat, and epilepsy, where more of the negative group experienced these conditions than the positive group.

Forecast: Existing boosters based on the original COVID (ancestral) strain may provide sufficient protection against severe outcomes from BA.5.

Everyone 5 and older is eligible for a booster; those over 50 or immunocompromised are eligible for a second booster!

LA County’s Public Health Director, Barbara Ferrer, stated re: mask mandates: “I don’t think we should be settling for high mortality that disproportionately affects people who have less economic means and people of color.”

She went on to state that “masking remains a strategy that layers in protections when transmission is high.” 

Be Prepared: BA5 has rapidly outgrown all other variants in the US. We haven’t yet seen evidence of a new variant that can overtake it.

Although this may give us a brief break before the next variant emerges, repeat infections from BA5 could also keep cases high for the foreseeable future.

By reducing transmission, we give the virus fewer chances to adapt and keep each other healthier.

Layers of protections – high-quality masks, ventilation, vaccines, & testing – remain our best defense.

Sources – Check out the links throughout and see our website for more! https://peoplescdc.org

Apology

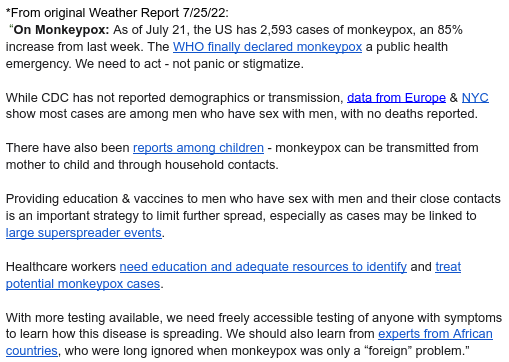
PCDC apologizes for our coverage of monkeypox (MPV) last week. Both  PCDC volunteers and outside readers noted that our framing perpetuated some of the same errors of exclusion and bigotry we seek to oppose.  We include the original language here for reference and accountability.*  We’re currently reflecting on how we engage with the topic going forward.  We aim to share information that is non-stigmatizing, accurate, and prioritizes those most impacted.  If you have MPV resources you’ve found helpful, or thoughts on how PCDC can best contribute, please let us know via the form linked here.       

*Removed from original Weather Report 7/25/22:

 “On Monkeypox: As of July 21, the US has 2,593 cases of monkeypox, an 85% increase from last week. The WHO finally declared monkeypox a public health emergency. We need to act - not panic or stigmatize. 


While CDC has not reported demographics or transmission, data from Europe & NYC show most cases are among men who have sex with men, with no deaths reported.


There have also been reports among children - monkeypox can be transmitted from mother to child and through household contacts.


Providing education & vaccines to men who have sex with men and their close contacts is an important strategy to limit further spread, especially as cases may be linked to large superspreader events. 


Healthcare workers need education and adequate resources to identify and treat potential monkeypox cases.


With more testing available, we need freely accessible testing of anyone with symptoms to learn how this disease is spreading. We should also learn from experts from African countries, who were long ignored when monkeypox was only a “foreign” problem.”
Share this:
Translate
Close