
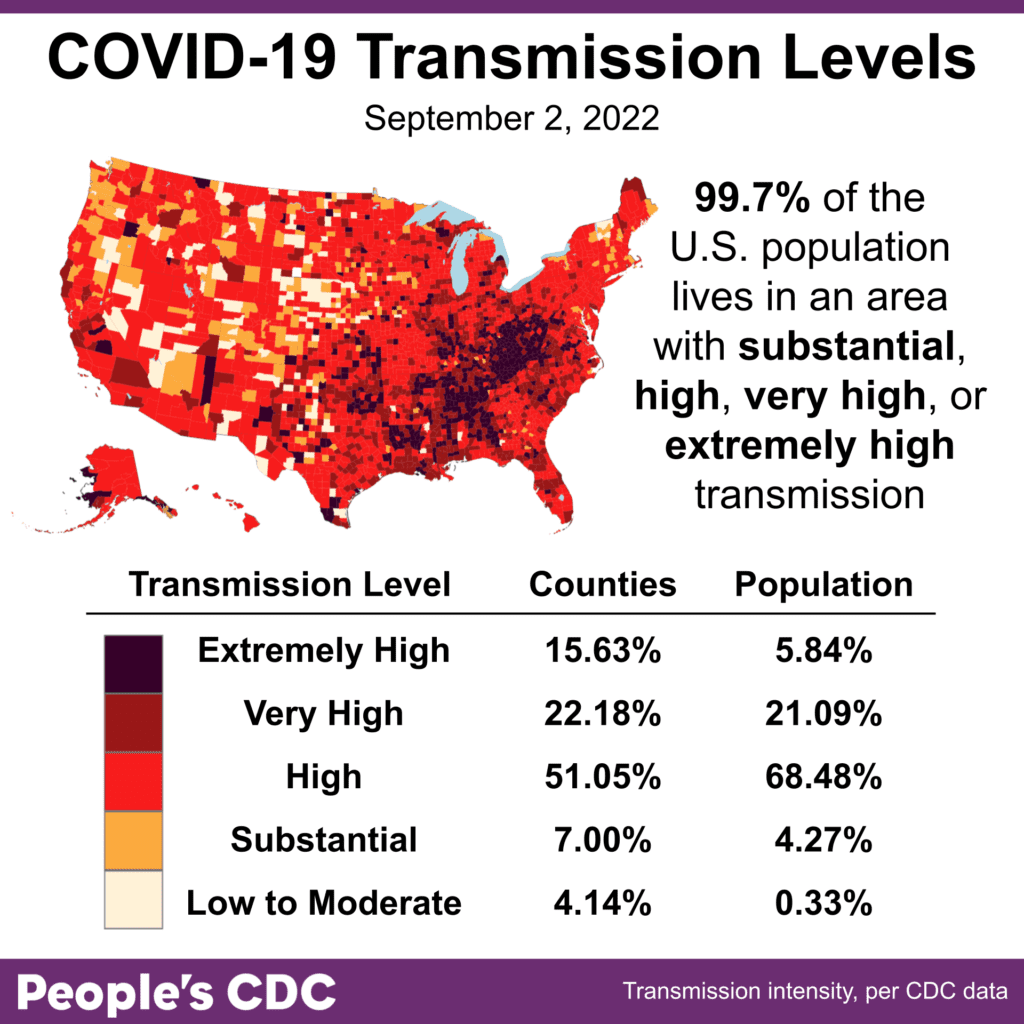
The Weather: For yet another week since early June, more than 99% of the population lives in areas with substantial or higher COVID transmission, with large portions of the southeast and Appalachia experiencing Extremely High transmission.
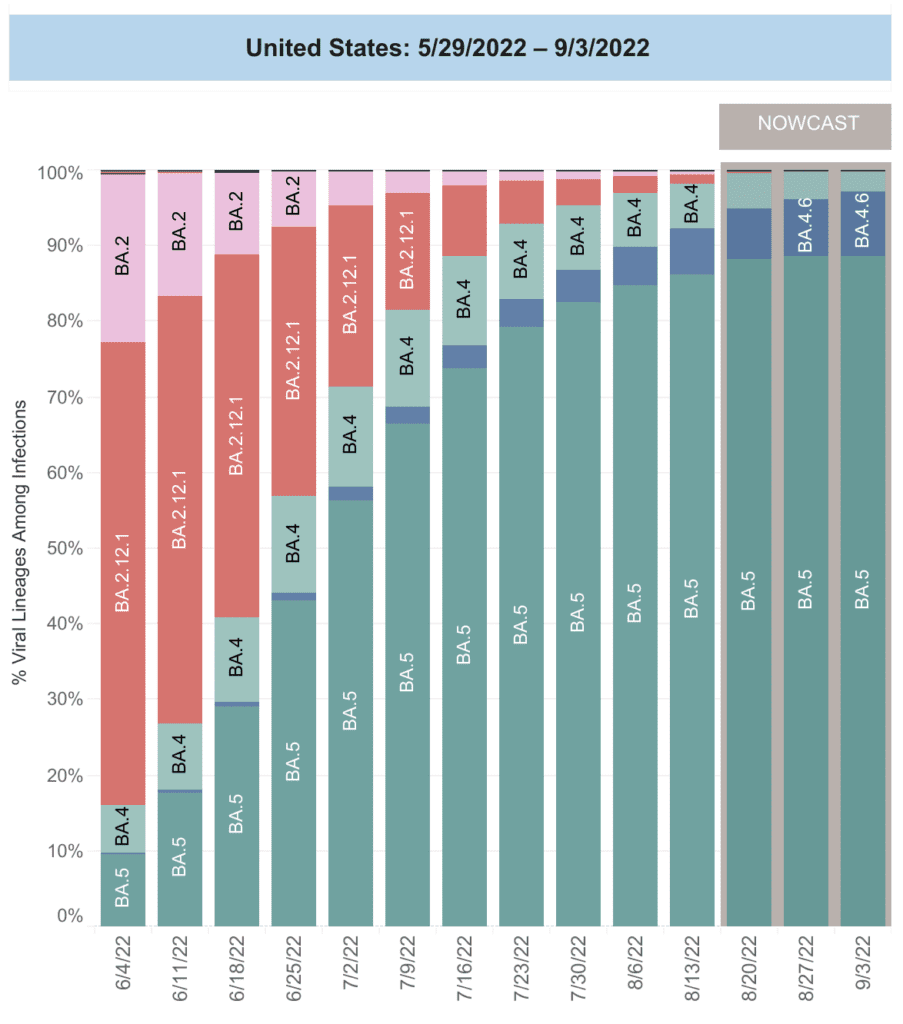
On Variants: BA.5 remains the most prominent variant in the US, representing 88.6 percent of cases, followed by BA.4.6 at 8.4 percent.
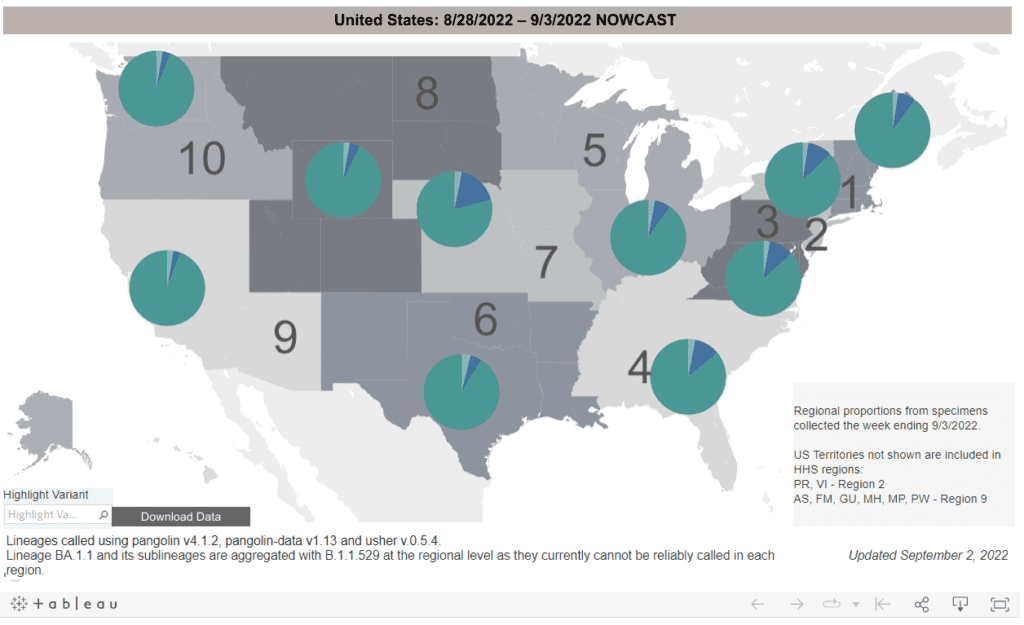
Regionally, this breaks down to BA.5 dominating in all areas, but with BA.4.6 comprising a larger proportion of cases in the Midwest (18 percent in Iowa, Nebraska, Kansas, & Missouri), followed by about 11 percent in the southern and mid-Atlantic states.
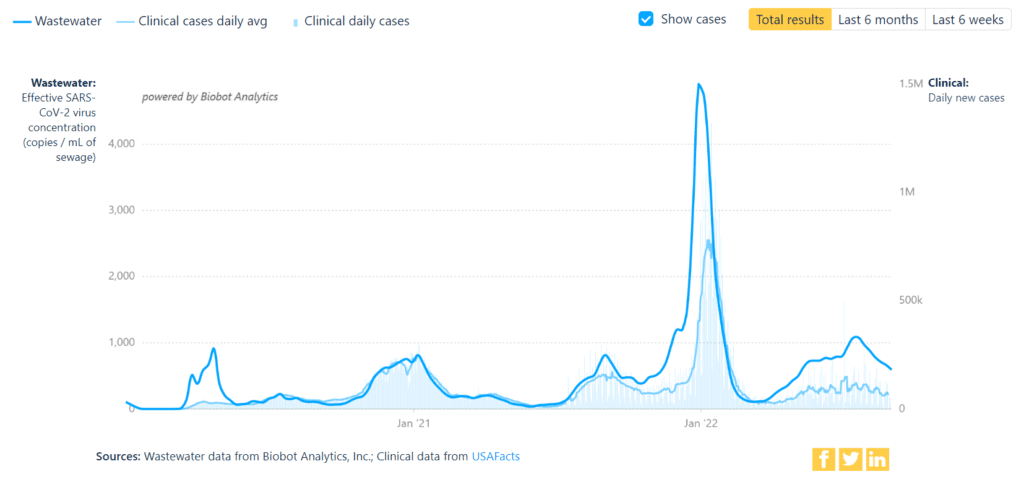
Wastewater Monitoring: National wastewater data continue to show a downward trend since the BA.5 peak in mid-July. However, levels are still high. By region, wastewater data show declines in all areas. The West currently has the lowest levels overall at 436 copies per milliliter.
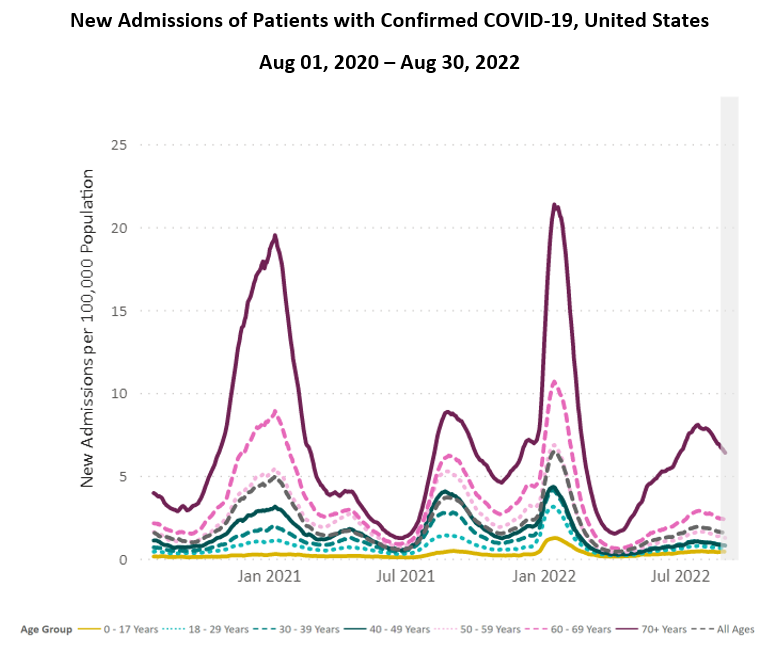
Hospitalizations: While still elevated, hospitalizations are also declining. Rates are especially high for the 70+ age group.
Deaths: From August 25th to August 31st, 2,902 people died of COVID nationally. Over 217,000 Americans have died from COVID so far in 2022.
On Long COVID: Referencing Long COVID (LC), WHO Chief Scientist Soumya Swaminathan tweeted this past week, “We need to prepare for large increases in cardiovascular, neurological & mental health disorders in countries affected by #SARSCoV2 #pandemic.”
Given the ongoing lie that “COVID no longer controls our lives,” we must reiterate that everyone can develop LC. The CDC itself acknowledges Long COVID among children even as it continues to loosen guidelines that could protect them in the first place.
In a new study, researchers found “that a reservoir of active virus persists in the body.” Read more about leading hypotheses on the causes of LC–including lingering virus in the body, microclots & faulty immune signaling here.
Despite being largely ignored by the leadership as a real threat, Long COVID research is ongoing and groups fighting for recognition, prevention, and treatment, are continuing their important work.
If you or a loved one has Long COVID, take a look at this #StopRestPace guide from The Myalgic Encephalomyelitis Action Network ( @MEActNet ), especially if your symptoms seem to be exacerbated by exertion.
Forecast: Great news! The FDA has authorized and the CDC has recommended updated COVID vaccine boosters, also known as bivalent boosters, that target the original strains as well as BA.4 & BA.5.
You can check when you’ll be eligible for an updated booster via this tool on the CDC’s website. Stat News has also summarized the latest guidance here.
Per the FDA’s fact sheet, these new bivalent boosters are provided at no out-of-pocket cost to the public, including the uninsured. Although, the administration has made clear that it plans to “transition to commercialization” in the near future.
![Text explaining that the vaccine is provided through a federal program and are to be provided for free: “Vaccination providers may not charge any fee for the vaccine and may not charge the vaccine recipient any out-of-pocket charge for administration. However, vaccination providers may seek appropriate reimbursement from a program or plan that covers COVID-19 vaccine administration fees for the vaccine recipient (private insurance, Medicar, Medicaid, Health Resources & Services Administration [HRSA] COVID-19 Uninsured Program for non-insured recipients).” Violations are to be reported to HHS at 1-800-HHS-TIPS or online at https://TIPS.HHS.GOV](https://bej.gbh.mybluehost.me/wp-content/uploads/2022/09/9.5.22_boosters-still-free-1024x615.png)
We don’t end the crisis by stopping “funding for the very ‘tools’ the administration claimed allowed the US to end shelter-in-place & to reopen the economy.” The pandemic is far from over. We must demand more from the federal government.
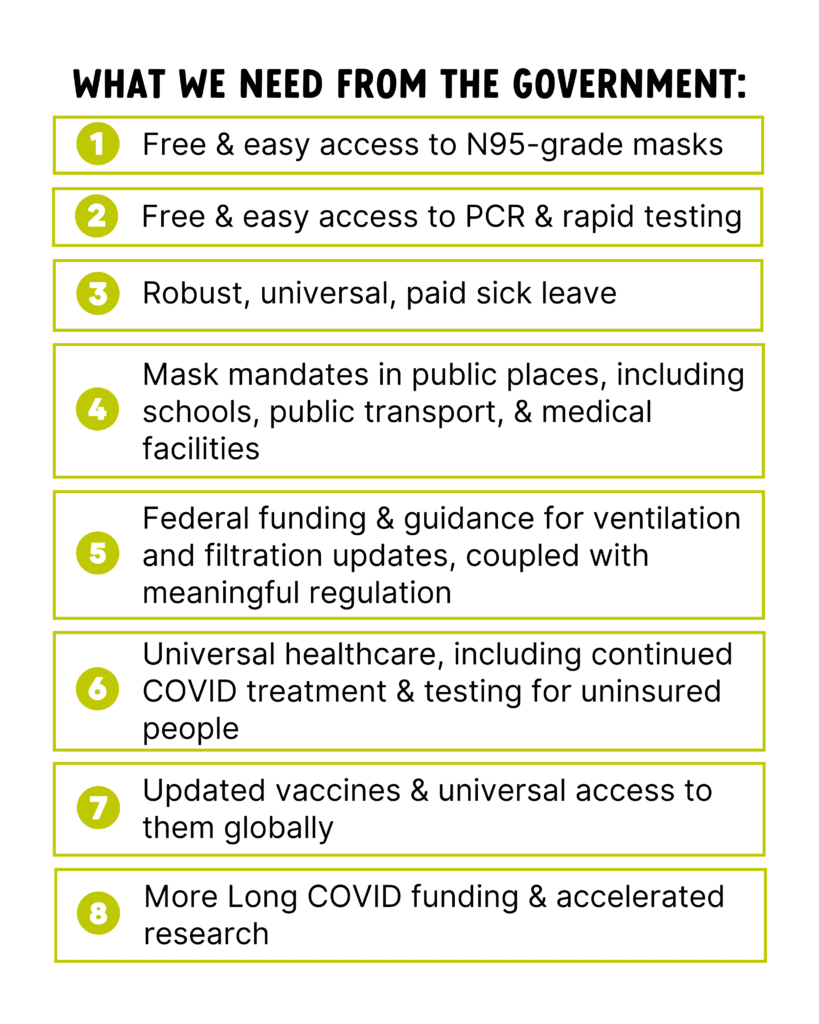
We need free N95 masks, free & easy access to PCR & rapid testing, mask mandates, funding & guidance for ventilation improvements, universal access to updated vaccines, support for Long COVID treatment & research, and universal healthcare for all.
Join us in demanding a better, more robust response to the ongoing pandemic. The private sector won’t save us. Individual responsibility alone won’t save us. The federal government needs to hear this: We know this is their fault, and we know they can do more.
COVID FAQ: We are starting this section to respond to frequently asked questions, paraphrased for de-identification & length. Note that this is general guidance; we do not have your full medical history or background. We are only sharing what we know based on the latest research.
Q: After testing positive for COVID, when is it safe to see people again? I don’t trust the 5-day recommendation, based on what I know from previous studies.
A: You are correct. Starting Day 6 after symptom onset or initially testing positive, testing negative 2x via rapid tests, with at least 48 hours in between, is the best way to know when to safely end isolation. For more background, see this summary & thread.
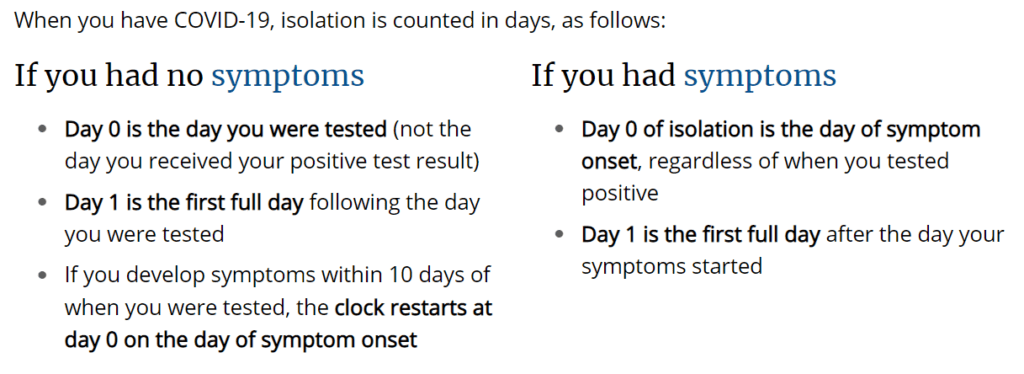
Here’s how to count days for isolation:
Q: I’m pregnant. I am wondering whether the omicron-specific booster is safe for me. I would also like recommendations on how to see people safely, especially as we head into the colder months this fall.
A: Pregnant people & their fetuses are at increased risk of bad outcomes from COVID. The more layers you can use, the safer you can be, so perhaps use ventilation & air filters when you are indoors.
Unfortunately, there isn’t much data yet for the new booster regarding pregnancy–all the previous shots have been shown to be very effective & safe during pregnancy. We can recommend talking to your medical provider if you have one & following ACOG’s guidance.
Notes: 1) The numbers in this report were current as of 9/1. The CDC updates data frequently as it receives refreshed information. Today’s numbers may be slightly different from the data here.
2) Check out the links throughout & see our website for more! https://bej.gbh.mybluehost.me.