People’s CDC Weather Report

Published

The Weather: Despite Biden’s denial of reality that prioritizes profit over people’s lives, the COVID pandemic is far from over.

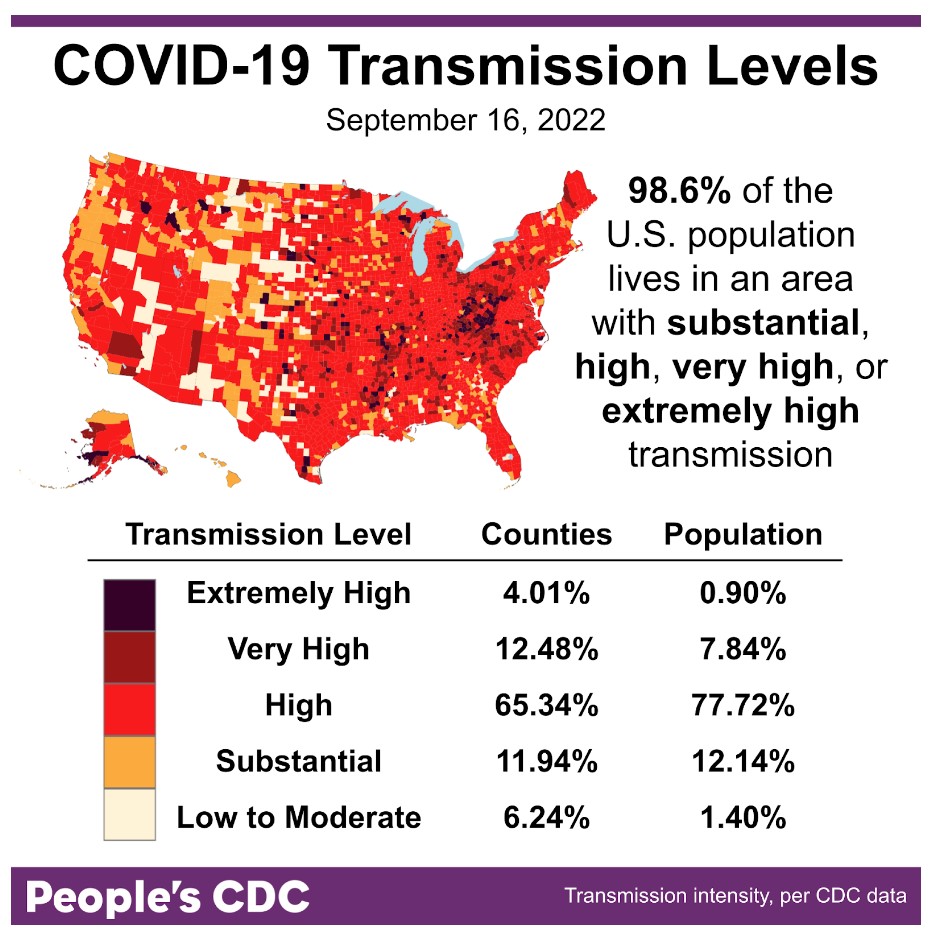
As we’ve seen all summer, >98 percent of the population lives in areas with substantial or higher COVID transmission. The two highest map levels here show how very high case levels are, at 100-199 (High) and 200-299 (Very High) cases per 100,000 respectively.

This map and table show COVID community transmission in the US by county, with High broken into 3 subcategories: High, Very High, and Extremely High. Transmission is indicated via shades of red, with the darkest shade indicating areas of Extremely High transmission, and the palest shade representing Low to Moderate transmission. Text indicates that 98.6 percent of the US population lives in an area with substantial or higher COVID transmission level, which is also represented via the three darkest shades of red covering most of the map itself. Most of the country is experiencing High transmission, at 65.34 percent of counties representing 77.72 percent of the population; 11.94 of counties representing 12.14 percent of the population are experiencing substantial transmission. Only 6.24 percent of counties, representing 1.40 percent of the population, are experiencing Low to Moderate transmission. The graphic is visualized by the People’s CDC and the data are from the CDC.

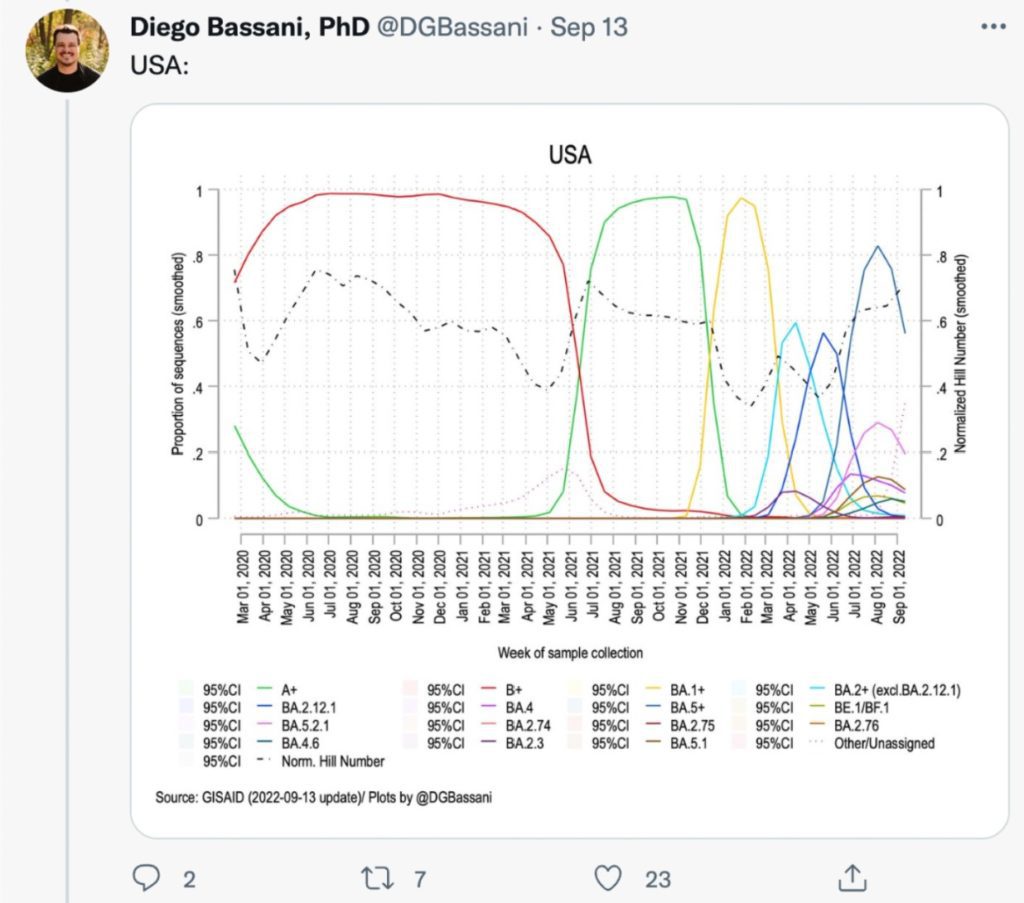
On Variants: Variant diversity is increasingly high in the U.S. (and many other countries), as Prof Bassani highlights.

A line chart shows USA data for the weeks of 3/1/2020 through 9/1/2022 with the proportion of each viral lineage shown in a different color line and the Normalized Hill Number showing variant diversity shown in a dotted line. Variant diversity is increasing as of May 2022 and BA.5 has the highest proportion as of July 2022, with many other variants with proportions between 0.0 and 0.2. The graphic is visualized by Diego Bassani with data from GISAID.

We continue to see declines in proportion of cases due to BA.5, though still the majority (85%). 3 other variants are gaining traction: BA.4.6 now makes up 10% of cases particularly in Central Plains, Southeast & Northeast regions…

A bar chart shows data for the weeks of 6/18/2022 through 9/17/2022 with levels for each viral lineage shown vertically. In mid-June, BA.2.12.1 was the dominant lineage, with smaller amounts of BA.5, BA.4, and BA.2 circulating. As time went on, BA.5 quickly grew and BA.2.12.1 and BA.2 began to shrink, with BA.4 remaining stable at around 10 percent of viral lineages. By early July, BA.5 had become the dominant variant. As of 9/17/2022, BA.5 makes up the vast majority of cases at 84.8 percent, followed by BA.4.6 at 10.3 percent. In the past two weeks, it appears BA.5 is slowly declining while BA.4.6 slightly increases.

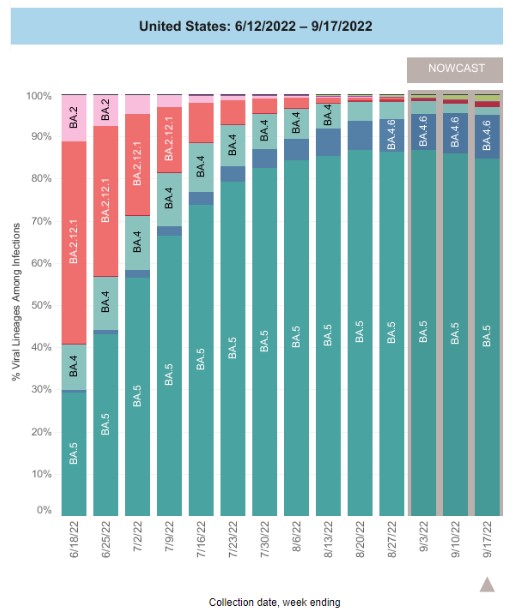
BF.7 (lime green) is at 1.7% & highest in the Northeast; and BA.2.75/BA.2.75.2 (dark red) is at 1.3%, with slightly higher percentages on the West Coast & Great Lakes.

It is increasingly hard to keep track of these variants & their subvariants. Dr Topol provides a nice summary. BA2.75 (Centaurus) had caused a surge in India, but has not been predominant in areas that first had BA4/5. It is unclear what the newer BA2.75.2 will do.

Screenshot of a Twitter post from Eric Topol reading, “BF.7 is BA.5.2.1X. BA.27 isn’t as concerning as further BA.2 derivatives. BA.2.75.2 acquired 3 more key spike mutations, more immune evasion potential. NB: The virus is still showing substantial signs of evolution; this is just the spike.” There’s a graph attached to the bottom of the tweet in which the genetic mutations of BA.4/BA.5, BA.2.75, BA.2.75.2, BJ.1, BA.2.10.4, and BA.2.3.20 are illustrated. BA.2.75.2 acquired 3 more key spike mutations with more immune evasion potential. BA.2.10.4 and BA.2.3.20 show 8 and 9 mutations respectively. Text and illustrations by Eric Topol with original data from Tom Peacock.

The existence of so many variants is concerning for many reasons. It means the virus is getting lots of chances to evolve. It is more difficult to study the relative severity, immunity, and transmissibility of so many variants. And it increases the chances of another surge.

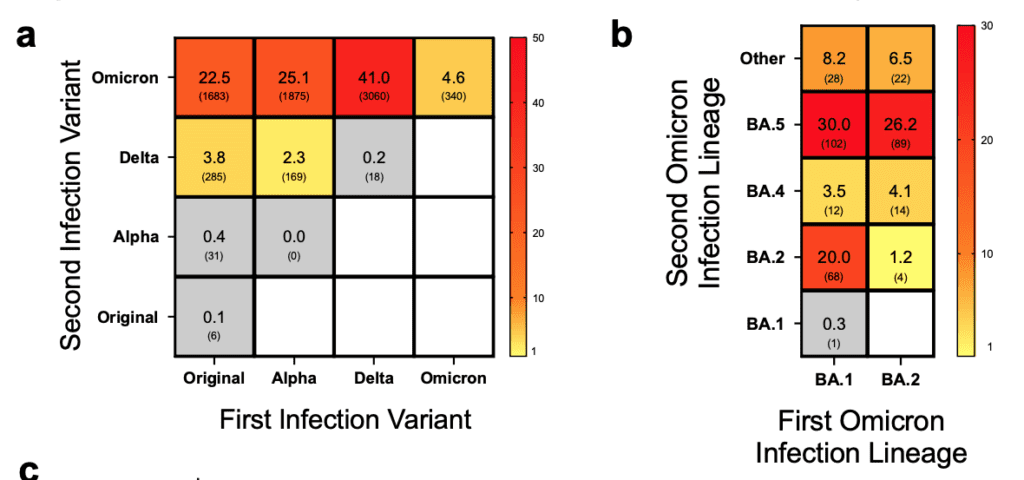
A pre-print from Denmark shows re-infections have become more common with newer variants. Few folks (in grey squares) were re-infected prior to Omicron. However, Omicron was easily able to re-infect folks. The second figure shows reinfections between Omicron strains is possible.

Two tables show reinfection frequencies across infection variants, with first infection variants in each column and second infection variants in each row. The table on the left shows data across original, alpha, delta, and omicron variants, with greater reinfection frequencies among Omicron variants; 93.2 percent or 6,958 cases of all reinfections were due to Omicron. The table on the right compares Omicron-to-Omicron reinfection cases across major sublineages BA.1, BA.2, BA.4, BA.5, and Other. BA.1 initial infections accounted for 62 percent of second Omicron infections, with the majority of those being infections from BA.5 at 30 percent or 102 cases, or BA.2 at 20 percent or 68 cases.

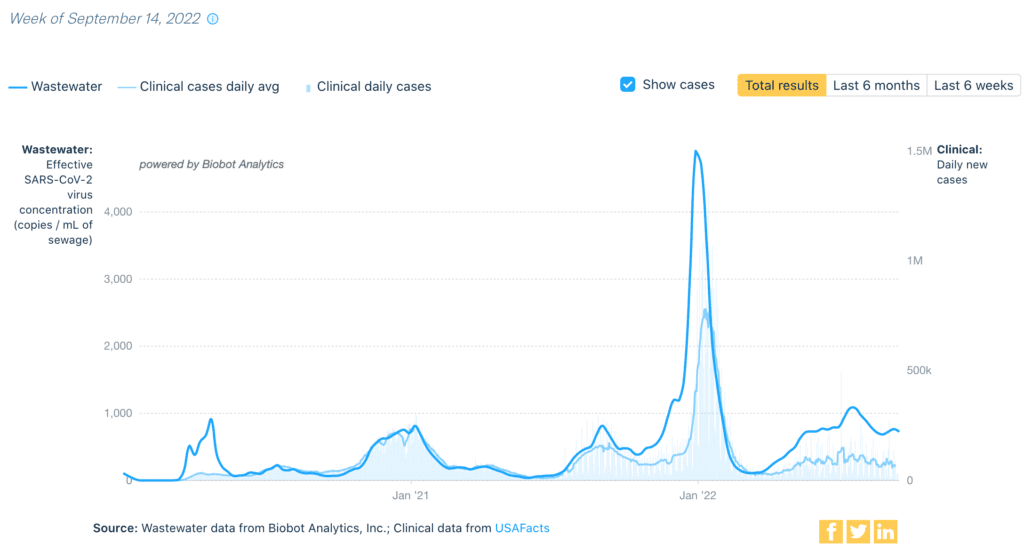
Wastewater Monitoring: National wastewater data has been fluctuating after a brief decline. It is still at relatively high levels. Regionally, the increase is mostly from the Northeast.

A line graph with overlapping lines indicates wastewater viral concentration in dark blue & daily clinical cases in light blue from January 2020 to September 2022. The x-axis is the date & the y-axis on the left states “Wastewater: Effective SARS-CoV-2 virus concentration, copies per mL, or milliliter, of sewage” and the y-axis on the right states “Clinical: daily new cases.” The clinical cases & daily average wastewaters have corresponding peaks & valleys, though the wastewater levels are consistently higher than the daily clinical cases, especially during surges, and the discrepancy has persisted since May 2022, confirming an ongoing summer surge. Wastwater and clinical daily cases have been relatively stable in recent weeks. On 9/14, wastewater showed 725 copies/mL of sewage. An average of 62,169 daily clinical cases was reported on 9/9. Source: “Wastewater data from Biobot Analytics, Inc.; Clinical data from USAFacts.”

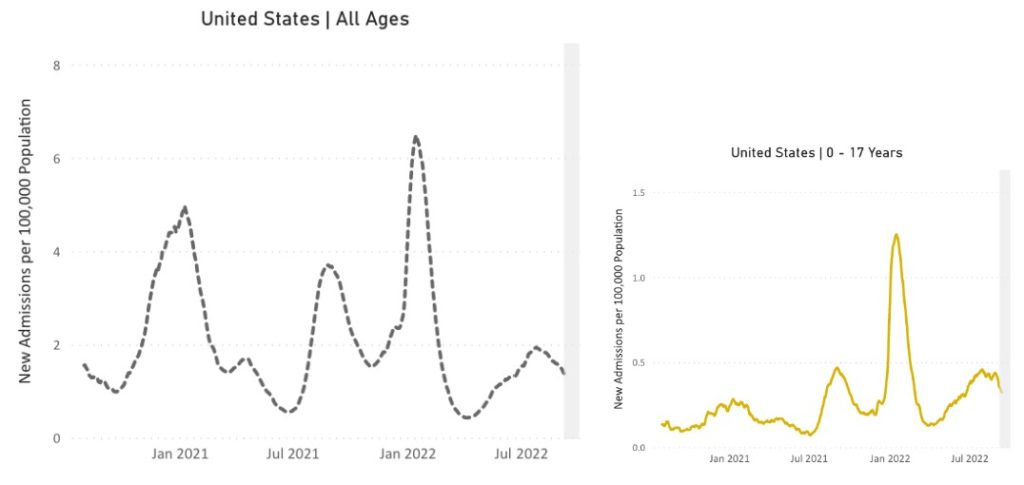
Hospitalizations: Overall hospitalizations continue to go down, which is excellent news. Among kids, hospitalizations are starting to decline, but are still fairly high compared to most of the pandemic. Our kids deserve better protections.

Two line charts representing new admissions of patients with confirmed COVID in the United States over time. The chart has “United States, All Ages,” as its title, “New Admissions per 100,000 Population” on its y-axis, and dates from January 2021 to July 2022 on its x-axis, though actual dates range from August 2020 to August 2022. The dotted line represents new admissions of patients with confirmed COVID in the US over time across all age ranges. The line indicates peak hospitalizations occurred in January 2021, August 2021, and January 2022, with smaller peaks happening in April 2021 and July 2022. At its latest data point, the line indicates that hospitalizations are currently moving in a downward trend. The solid yellow line shows new hospitalizations for children ages 0 to 17 years. Their hospitalizations have remained stable in recent months and are starting to decrease.

Deaths: From September 8th through September 14th, 2,503 people died of COVID nationally

On Long COVID: A population survey of 3,000 U.S adults found that 7% of all respondents reported Long COVID (using the UK definition). Long COVID was less common – but not eliminated – among those who were boosted.

“Long COVID is now the country’s 3rd leading neurological disorder” the American Academy of Neurology declared in July. Severity & lasting effect on the brain may not be related: people with cold-like symptoms are developing issues with cognition, anxiety, depression & sleep.

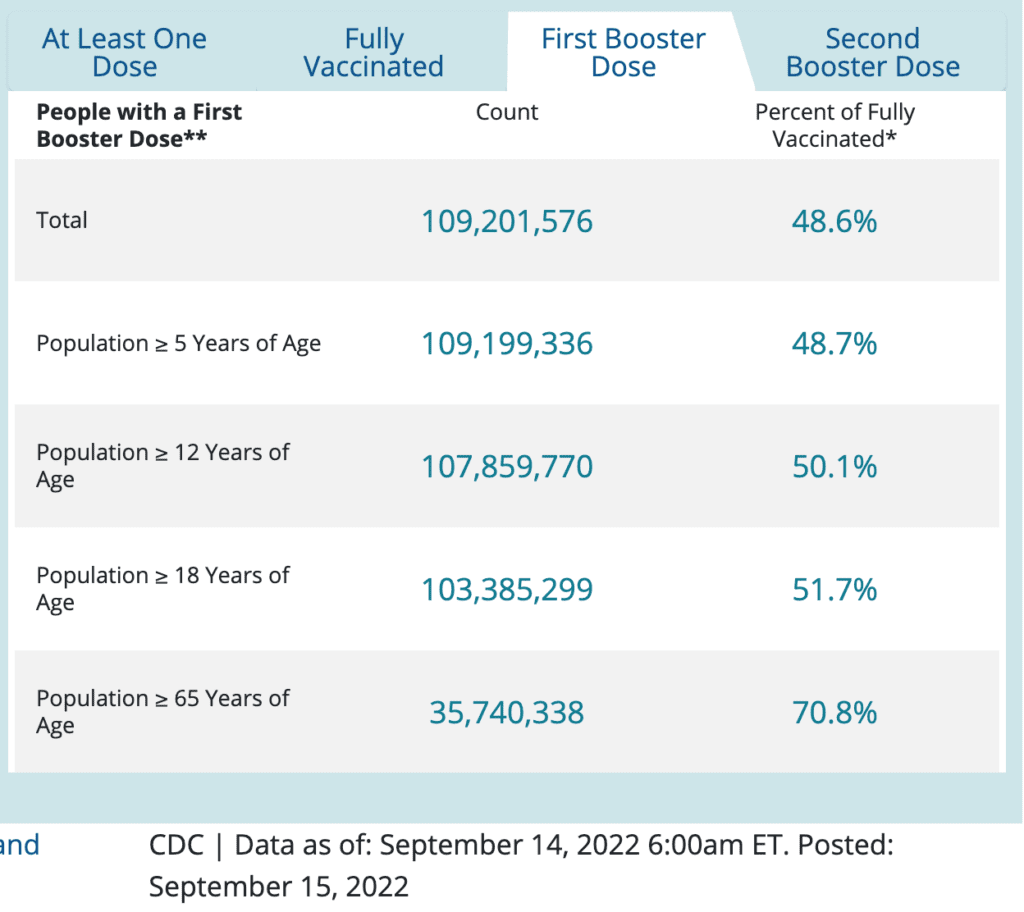
Forecast: The new updated boosters finally match the current strain. However, booster uptake has been low in the US – less than half of the population has even one booster. High-quality masking, good ventilation, access to testing & paid sick leave are all important to keep each other healthy!

A table highlights people with a first booster dose, with “Count” of those vaccinated in the center column and “Percent of Fully Vaccinated” in the right-most column. Rows show different populations of people: Total  population has 109, 201, 576 count, at 48.6 percent. Population greater than or equal to 5 years of age has 109,199,336 count, at 48.7 percent. Population greater than or equal to 12 years of age has 107,859,770 count, at 50.1 percent. Population greater than or equal to 18 years of age has 103,385,299 count, at 51.7 percent. Population greater than or equal to 65 years of age has 35,740,338 count, at 70.8 percent. Source: “CDC Data as of: September 14, 2022 6:00am ET. Posted: September 15, 2022”

Looking for an easy, effective way to clean your air? Corsi-Rosenthal boxes outperform many available air filters and work in homes, schools, & offices. Learn more about building one at cleanaircrew.org!

Actions to Take: Long COVID activists are demanding better research today, September 19. Learn more & get involved at: https://millionsmissing.meaction.net/protest2022/ 

Notes: 1) The numbers in this report were current as of 9/16/22. The CDC updates data frequently as it receives refreshed information. Today’s numbers may be slightly different from the data here. 2) Check out the links throughout & see our website for more! https://peoplescdc.org.

Share this:
Translate
Close