El clima: Como hemos visto durante todo el verano, más del 99 por ciento de la población vive en áreas con una transmisión de COVID sustancial o más alta. Los dos niveles de mapa más altos aquí muestran cuán altos son los niveles de casos, en 100-199 y 200-299 casos por 100,000 respectivamente.
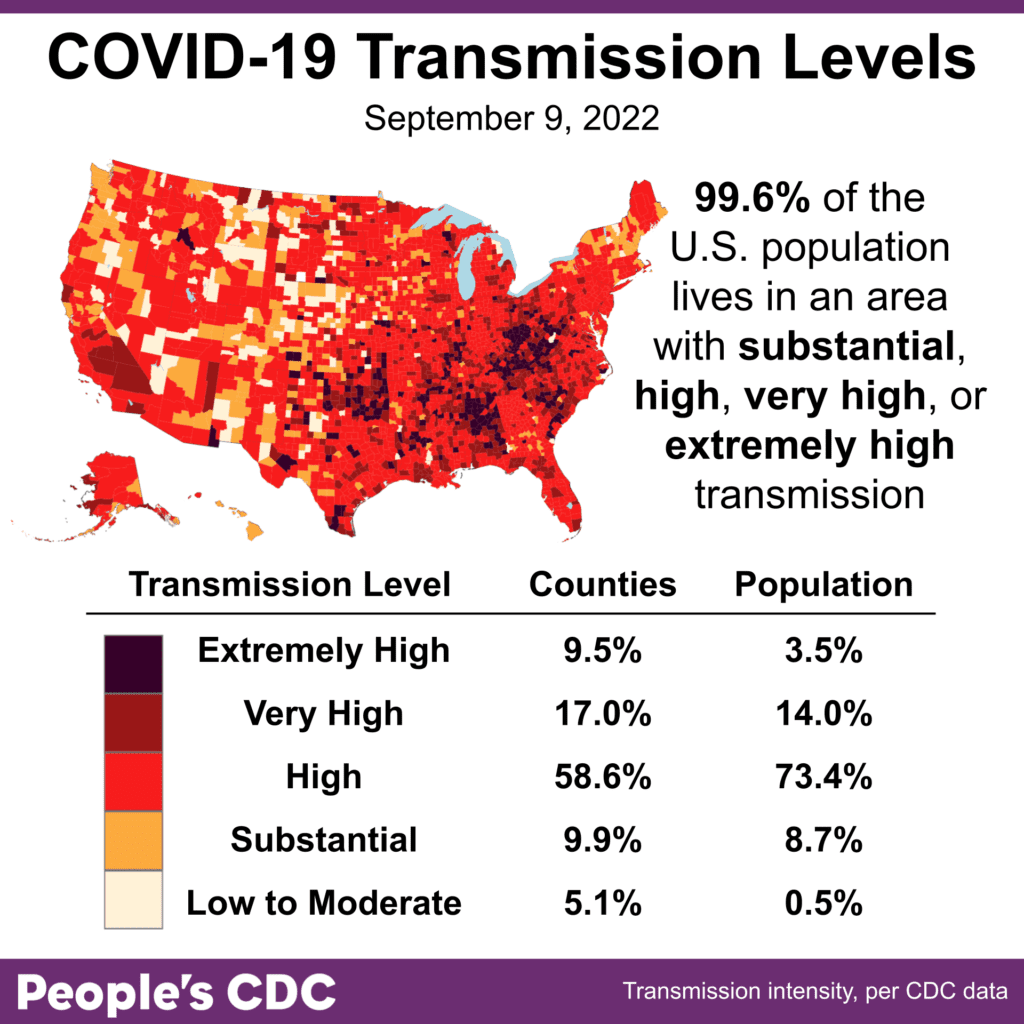
Sobre variantes: Aunque BA5 todavía constituye la mayoría de los casos en los Estados Unidos, mostró una ligera disminución por primera vez. Vemos que BA4.6 continúa creciendo lentamente y un pequeño aumento en BA2. Si bien la imagen de variantes no está clara ahora, reducir la propagación ayudaría a retrasar la aparición de nuevas variantes.
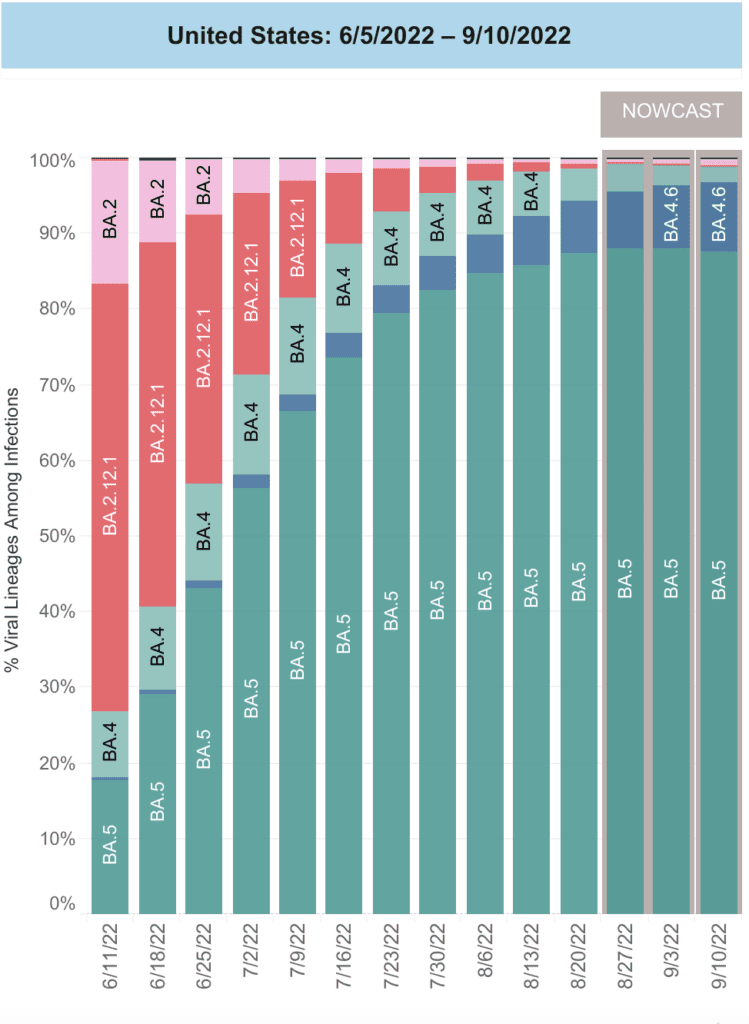
Monitoreo de aguas residuales: Datos nacionales de aguas residualesdespués de un breve descenso, volvió a subir esta semana, en todas las regiones excepto en el Oeste del pais. No está claro si esta tendencia continuará o si está siendo impulsada por BA4.6.
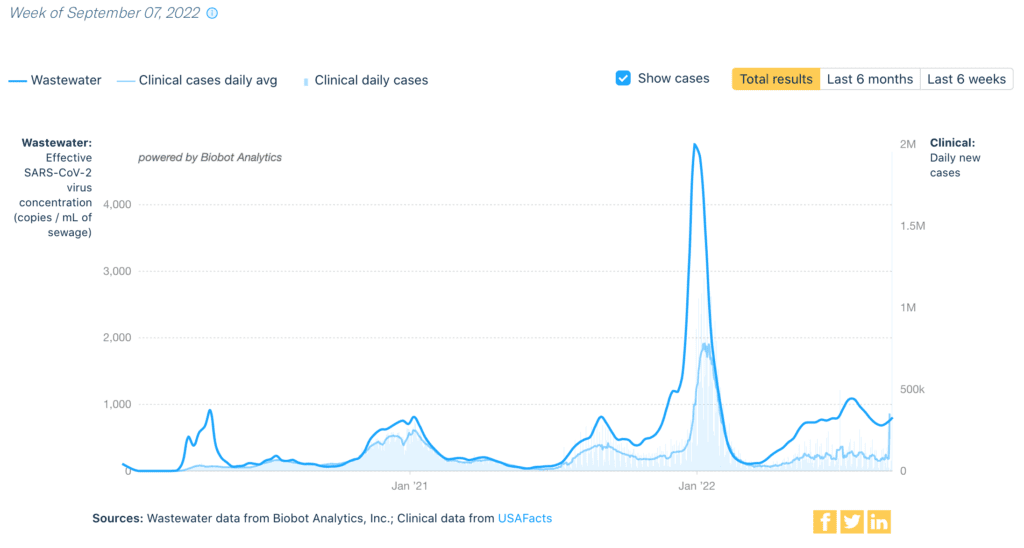
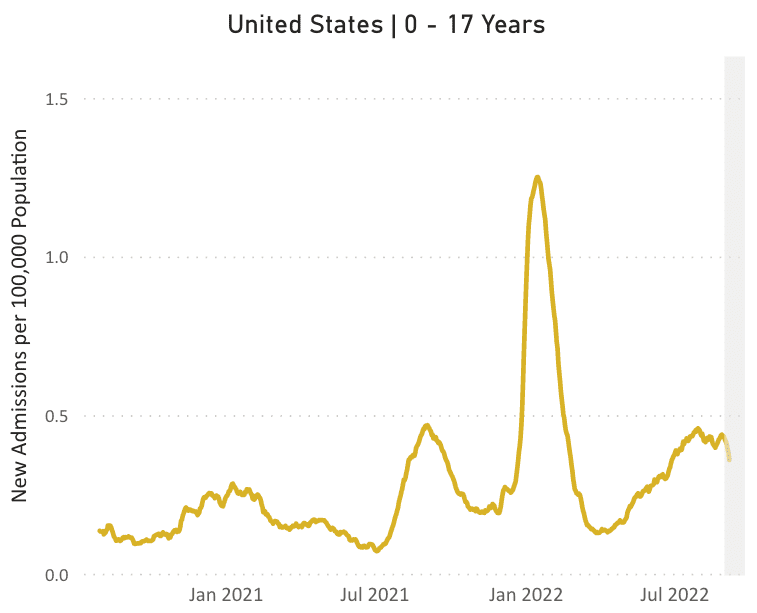
Hospitalizaciones: En general las hospitalizaciones también están disminuyendo. Sin embargo, entre los niños de 0 a 17 años, que están regresando a la escuela, vemos hospitalizaciones estables. (Los datos en la sección gris claro aún se están recopilando).
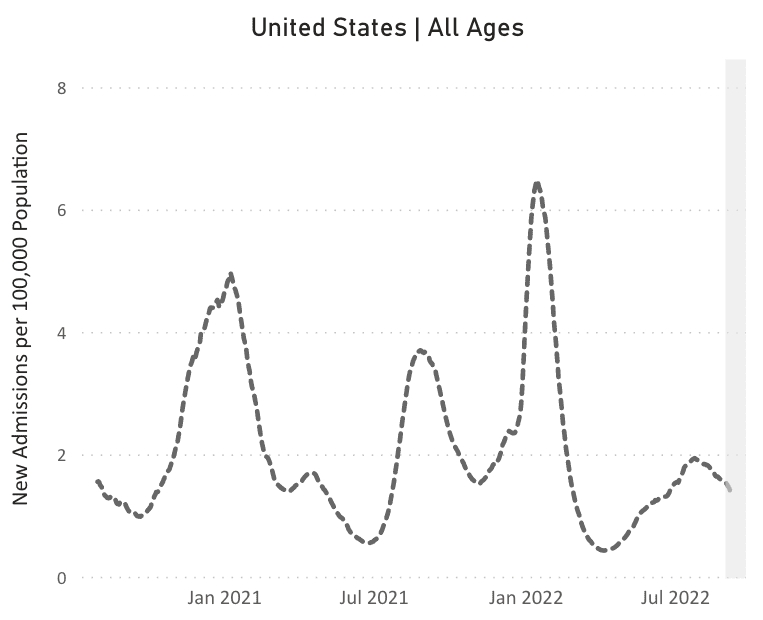
Fallecidos: De Septiembre 1 hasta el 7, 2,196 personas han fallecido por COVID a nivel nacional.
Sobre COVID largo: El Iniciativa de investigación sobre COVID Largo anunció su plan para comprender las causas y identificar tratamientos para Long COVID, centrándose particularmente en la hipótesis de que el virus puede permanecer oculto en el cuerpo.
Long COVID Families recientemente organizó una conferencia virtual sobre investigación y defensa con un enfoque en los estudiantes que regresan a la escuela. Puedes ver las grabaciones aquí.
Pronóstico: El AFL-CIO emitió una declaración destacando la necesidad de protecciones continuas para los trabajadores. Una nueva Caja de herramientas de la urgencia de la equidad también se publicó esta semana, lo que justifica la continuación del uso de capas de protección para mantener más seguras a nuestras comunidades escolares.
Necesitamos usar todas las capas de protección, incluido el nuevo refuerzo bivalente. Este refuerzo coincide con BA4 y BA5 y podría ayudar a reducir la propagación. En un movimiento miope, este puede ser el último dosis que paga el gobierno. Todos deberían tener acceso a la vacuna de refuerzo y a todas las herramientas de atención médica disponibles.
![Text explaining that the vaccine is provided through a federal program and is to be provided for free: “Vaccination providers may not charge any fee for the vaccine and may not charge the vaccine recipient any out-of-pocket charge for administration. However, vaccination providers may seek appropriate reimbursement from a program or plan that covers COVID-19 vaccine administration fees for the vaccine recipient (private insurance, Medicare, Medicaid, Health Resources & Services Administration [HRSA] COVID-19 Uninsured Program for non-insured recipients).” Violations are to be reported to HHS at 1-800-HHS-TIPS or online at https://TIPS.HHS.GOV Text explaining that the vaccine is provided through a federal program and is to be provided for free: “Vaccination providers may not charge any fee for the vaccine and may not charge the vaccine recipient any out-of-pocket charge for administration. However, vaccination providers may seek appropriate reimbursement from a program or plan that covers COVID-19 vaccine administration fees for the vaccine recipient (private insurance, Medicare, Medicaid, Health Resources & Services Administration [HRSA] COVID-19 Uninsured Program for non-insured recipients).” Violations are to be reported to HHS at 1-800-HHS-TIPS or online at https://TIPS.HHS.GOV](https://substackcdn.com/image/fetch/w_1456,c_limit,f_auto,q_auto:good,fl_progressive:steep/https%3A%2F%2Fbucketeer-e05bbc84-baa3-437e-9518-adb32be77984.s3.amazonaws.com%2Fpublic%2Fimages%2F50883437-017d-4051-9e35-4d23312cef2c_798x512.jpeg)
Hay muchas preguntas sobre cuándo recibir el refuerzo bivalente, especialmente si recientemente recibió una vacuna o una infección. Hay datos limitados, con un buen resumen. aquí.
En un esfuerzo continuo por incumplir sus responsabilidades, el gobierno lanzó la idea de cambiar a un refuerzo anual. Esto es anteponer la política a la ciencia. Si bien esperamos algún día tener mejores vacunas y menos variantes, una inyección anual en este momento es insuficiente.
Notas:
1) The numbers in this report were current as of 9/7. The CDC updates data frequently as it receives refreshed information. Today’s numbers may be slightly different from the data here.
2) ¡Consulte los enlaces a lo largo y visite nuestro sitio web para obtener más información! https://bej.gbh.mybluehost.me.